Venous Stents Market
Venous Stents Market by Material, Indication, Stent Design, Introducer Size, End User & Region | Forecast 2023 to 2033
Market Insights on Venous Stents covering sales outlook, demand forecast and up-to-date key trends
Venous Stents Market Snapshot
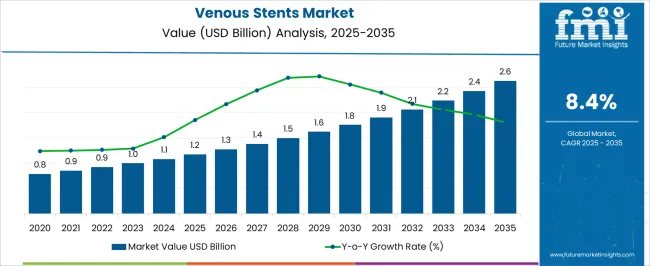
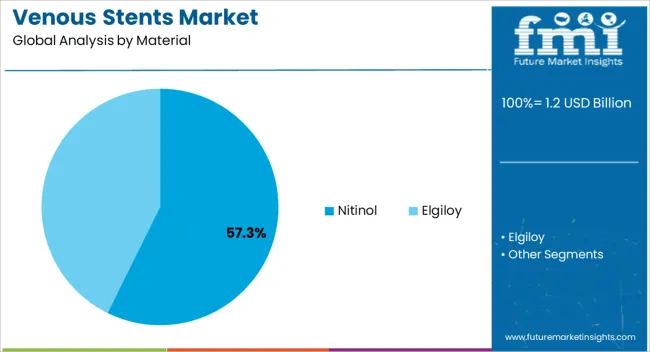
The global venous stents market held a valuation of US$ 921.4 Million in 2022, and it is anticipated to expand at a CAGR of 8.4% over the forecasted years. According to a recent study by Future Market Insights, nitinol material is leading the market with a share of about 89.5% in the year 2022, within the global market.
Market Outlook
Data Points |
Market Insights |
Market Value 2022 |
US$ 921.4 Million |
Market Value 2033 |
US$ 2.2 Billion |
CAGR 2023 to 2033 |
8.4% |
Market Share of Top 5 Countries |
52.6% |
Key Market Players |
Becton, Dickinson and Company, Cook Group Inc, Boston Scientific Corporation, Medtronic, Koninklijke Philips N.V. (Vesper Medical Inc.), Optimed Medizinische Instrumente GmbH, plus medica GmbH & Co. KG, Abbott Laboratories, Inc. |
A venous stent is a metal mesh tube that is placed inside a blocked or narrowed vein to keep it open. It acts as a scaffold to prevent the vein from collapsing and to allow blood to flow through it. Venous stenting is a minimally invasive procedure in which a fine angioplasty catheter is inserted into the affected vein. Using sophisticated imaging technology like venous ultrasound, a physician will carefully guide the angioplasty catheter to the vein's outer limits.
Venous stents are usually placed in larger, central veins such as the legs, chest, and abdomen. Stents are also used in arteries to keep them open after plaque has been removed. Venous stenting is also helpful in reduction of chronic pain, swelling, or helpful in venous ulcer healing in serious cases of existing post-thrombotic syndrome (PTS) after past deep vein thrombosis (DVT).
Don't pay for what you don't need
Customize your report by selecting specific countries or regions and save 30%!
Sales Analysis of Venous Stents Market from 2018 to 2022 Vs Market Outlook for 2023 to 2033.
The global sales of the venous stents are anticipated to rise at a CAGR of 8.4% between 2023 and 2033, owing to prevalence of venous diseases, adoption of minimally invasive procedures, growing ageing population, and increasing awareness about venous stents usage.
The global market holds around 8.5% share of the overall global stents market with a value of around US$ 10.8 Billion, in 2022.
The market for venous stents is increasing due to the rising prevalence of various diseases related to the venous, such as chronic venous insufficiency, deep vein thrombosis, phlebitis, varicose and spider veins, and venous stenosis. Such aforementioned disorders require venous stents for treatment purposes, and thus, the rising prevalence of venous disorders among people is driving the market.
Similarly, rising key player’s product development strategies like flexible venous stents with high radial strength are also expanding the market growth. Significant advancement has been made in the design and development of venous stents, including innovations in stent materials, design, and delivery systems. This has resulted in the development of more effective and safer stents, which will boost the demand.
Owing to the above-mentioned factors, the global market is expected to grow at a prominent pace, and reach a valuation of around US$ 2.2 Billion during the year 2033.
What are the Key Opportunities for the Manufacturers Operating in the Global Market?
Global cases of chronic cardiovascular diseases are increasing, owing to the world's growing senior population, as older people are more prone to heart-related problems.
- According to the WHO in 2019, annually almost 17.9 million deaths happen due to cardiovascular diseases (CVDs) worldwide. Consequently, as the prevalence of CVD among people increases, so does the demand for cardiovascular surgery, which is promoting market expansion.
Obesity is also a substantial global risk factor for a number of heart ailments. The excessive or incorrect deposition of fat within the arterial wall brought on by obesity can lead to coronary heart disease and other health issues. As a result, the increased obesity rate may demand several venous surgeries which indirectly aid the market growth.
- According to published article on proximal deep vein thrombosis (DVT) in medical critical care patients in 2022, around 13% to 31% patients are receiving medical critical care due to deep vein thrombosis. As per the article, 5.7% was the prevalence, while at around 10.1% was the incidence proportion for DVT.
The significant growth in patient base which is raising the demand for vein stent surgery is also aiding the market growth.
- For instance, according to published article on rising incidences study of post-thrombotic syndrome of upper extremity vein thrombosis in the Journal of Vascular Surgery: Venous and Lymphatic Disorders in 2022, venous thrombosis of upper extremity (UEVT) is responsible to cause PTS of upper extremity (UE-PTS) at about 14.1%. Hence, the market will boost by the increasing chronic symptomatic venous disease cases.
What are the Factors Restraining Demand within the Global Market?
The restraints of the venous stents market include the high cost of venous stent procedures, lack of skilled professionals, and the risk of complications associated with venous stent implantation. The high cost of venous stent procedures is a major restraint for the growth of the venous stent market, as it limits the adoption of these procedures in developing countries. The lack of skilled professionals is also a challenge for the growth of the venous stent market, as it limits the availability of these procedures in certain regions. The risk of complications associated with venous stent implantation, such as stent migration, stent fracture, and stent thrombosis, is also a restraint for the growth of the venous stent market. The venous stent market is highly competitive, with many players operating in the development, manufacturing, and commercialization of venous stents.
The recall of numerous venous devices from the market is another factor hindering the market growth. Recently, recalls of many product was motivated by recent documentation of unanticipated unfavorable patient effects.
- For instance, 7,000 venture catheters were recalled by vascular solutions Inc. in 2017 because the catheter tip contained excess material that could have split during operations and led to blood clots.
Country-wise Insights
What Makes the USA a Large Market for Venous Stents?
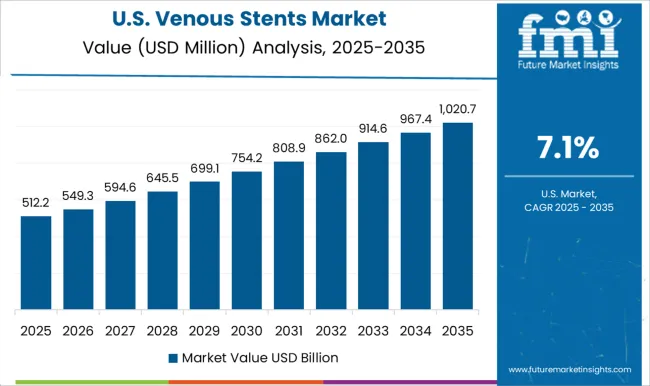
The USA led the global market with value share of around 32.8% in 2022 due to rising prevalence of deep vein thrombosis.
- Annually 900,000 individuals are affected by Deep vein thrombosis (DVT) or pulmonary embolism (PE) affects in the United States, according to the Centre for Disease Control and Prevention in June 2022.
Therefore, the demand for venous stents is increasing as a result of the rising number of DVT procedures performed nationwide.
The growing healthcare expenditure in theUSA is driving demand for venous stents as more patients seek treatment for venous diseases.
- According to the Centers for Medicare and Medicaid Services, healthcare expenditure in the USA is projected to reach US$ 6.2 Trillion by 2028, up from US$ 3.6 Trillion in 2018.
What Is the Outlook of Germany in the Global Market?
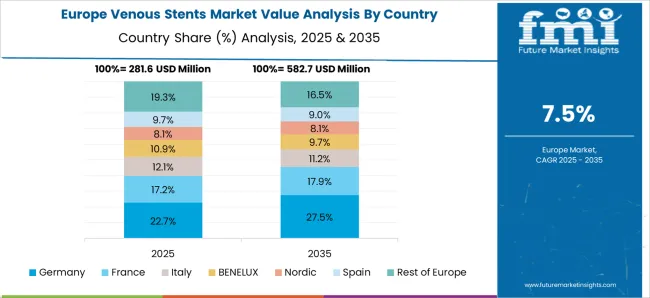
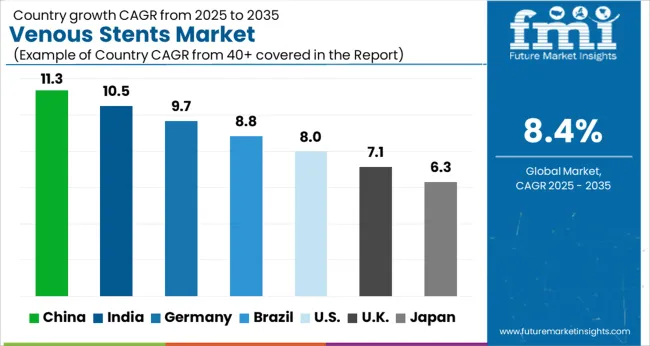
Germany held market share of around 4.4% in the global market 2022 and it is expected to expand further due to high prevalence of venous diseases.
The venous stents market in Germany is primarily driven by the increasing incidence of venous diseases and disorders. These conditions often require medical intervention, including the use of venous stents, to prevent serious complications such as pulmonary embolism or venous ulcers.
- According to published article on venous diseases epidemiologic study in Germany on 19,104 workers in the Vascular Health and Risk Management journal 2021, active venous therapy is clearly indicated in 22.3% of the adult working population in Germany.
What is the Scenario of China within the Global Market Space?
China holds a market share of 6.3% in 2022 in the global market. Increased interventional cardiology and peripheral vascular operations, as well as rising acceptance of technology developments in an effort to minimize treatment duration for high-risk patients, are the primary growth factors for this market.
- According to the Cetas healthcare system in Beijing, around 45% of peripheral treatments, 50% of PAD operations, and 30% atherectomy procedures were performed between 2019 and 2022.
Chinese regulatory approvals also confirm the quality and smooth market penetration for stents. For example, National Medical Products Administration (NMPA) regulatory services include strategy, registration, type testing, product technical requirement, and check clinical evaluation report.
What Makes India a Highly Lucrative Market for the Global Market?
India held a market share of around 3.6% in the global market 2022. The venous stents market in India is expected to grow significantly in the coming years, driven by the increasing availability of venous stents from global manufacturers. Many international companies are expanding their presence in India, either through partnerships or acquisitions of local companies, to tap into the growing demand for medical devices.
Get the data you need at a Fraction of the cost
Personalize your report by choosing insights you need
and save 40%!
Category-wise Insights
Which Material is Driving the Global Market Expansion?
Nitinol material is holding the market share of 89.5% in the global market 2022 because of its benefits over other materials and availability of reimbursement.
Nitinol stents are a type of self-expanding stent made from a nickel-titanium alloy that can withstand the high pressures and forces in the veins. The use of Nitinol stents has become increasingly popular in the treatment of venous diseases due to their flexibility, durability, and ability to maintain the shape of the vein after implantation. Such advantages of the product in surgical procedures are expected to drive the adoption of Nitinol stents.
Which Indication is Largely of Concern within the Global Market?
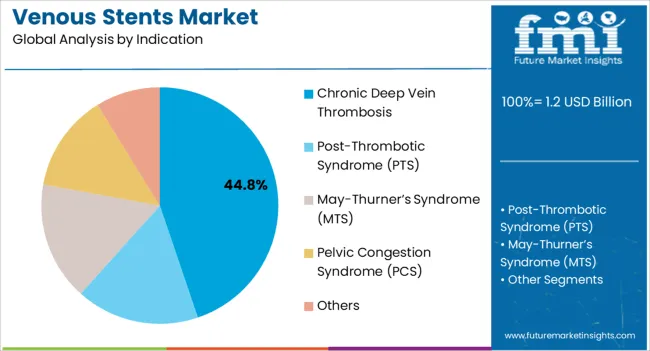
Chronic Deep Vein Thrombosis (DVT) has a market share of 41.6% in the global market 2022. The prevalence of chronic DVT is increasing due to factors such as aging, obesity, sedentary lifestyles, and an increase in the number of patients undergoing surgery or cancer treatment.
- For example, according to Centers for Disease Control and Prevention data 2023, every year, Chronic DVT or pulmonary embolism affects nearly 900,000 people in America, while causes death of more than 60,000 individuals.
Which Stent Design is Popular within the Global Market?
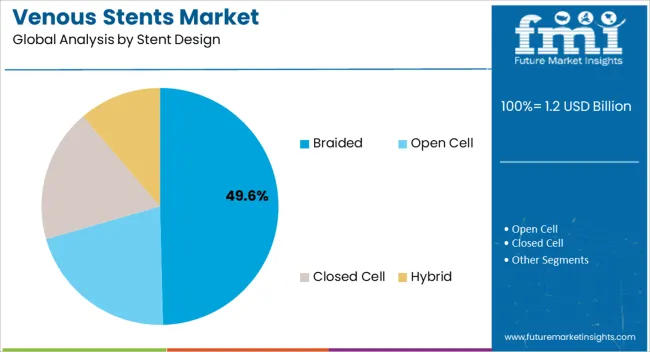
Open cell stent design has a market share of 88.1% in the global market 2022. In recent years, stents have been used more frequently in the treatment of venous disorders. Open-cell stents are made up of a mesh-like structure that allows for greater flexibility and conformability to the shape of the vein. This type of stent design has larger and more widely spaced struts compared to closed-cell stents, which can improve blood flow and reduce the risk of stent migration or fracture.
One of the advantages of open-cell stent design is that it allows for better coverage of longer lesions or areas of the vein with irregular shapes. Open-cell stents can also be compressed to a smaller profile for easier delivery through narrow or tortuous vessels.
Which Introducer Size is Largely of Concern within the Global Market?
Introducer size (F) 9 has a market share of 45.4% in the global market 2022. Introducer size 9 is an important in the venous stents market. An introducer is a device that is used to insert a stent into a blood vessel. The size of the introducer is an important consideration in venous stenting procedures, as it can impact the safety and efficacy of the procedure.
Introducer size 9 refers to an introducer with an outer diameter of 9 French (3 millimeters), which is a common size used in venous stenting procedures. Its advantage is like introducer size 9 is large enough to accommodate larger stents, which can be necessary in cases where the stenosis (narrowing) in the vein is severe.
Which End User Benefits More from the Sales within the Market?
Hospitals held a market share of 34.9% in the global market 2022. Hospitals are important end users for venous stents procedures because of availability of skilled healthcare professionals, and easy adoption of advanced technology in the hospital.
Rising incidence of chronic diseases being a major factor driving this growth. While there are no specific search results for hospital trends and drivers in the venous stents market, it can be inferred that the increasing prevalence of chronic diseases and the aging population are likely to drive demand for venous stents in hospitals. The development of new and innovative venous stents is also expected to further drive market growth.
Competitive Landscape
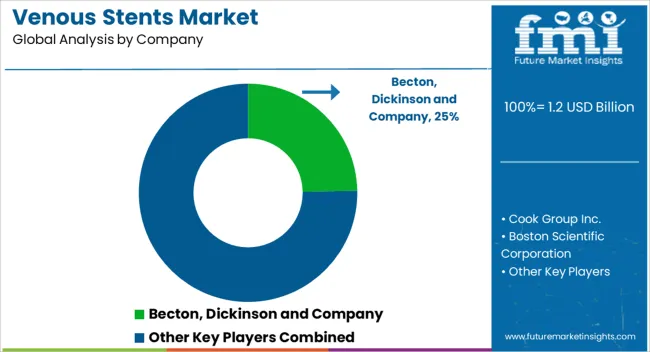
The key players in the market are actively working to improve their positions through product approvals, partnerships, acquisitions, launches, collaborations, and agreements with both existing and up-and-coming market participants. A manufacturer's chances of capturing a sizable market share significantly increases by acquisitions and partnerships.
A few examples of strategies acquired by the key players
- In May 2022, Becton Dickinson relaunched its Venovo venous stent in the USA market following a recall in May 2021.
- In December 2021, Vesper Medical, a US-based manufacturer of medical technology and peripheral vascular devices, has been acquired by Philips. With the new acquisition, Philip will be able to treat deep vein disease with a wider range of advanced venous stents.
Similarly, recent developments related to companies manufacturing venous stents have been tracked by the team at Future Market Insights. These are available in the full report.
Report Scope as Per Venous Stents Market Analysis
Attribute |
Details |
Historical Data Available for |
2018 to 2022 |
Forecast Period |
2023 to 2033 |
Market Analysis |
US$ Million for Value, and Units for Volume |
Key Regions Covered |
North America, Latin America, East Asia, South Asia & Pacific, Western Europe, Eastern Europe, Central Asia, Russia & Belarus, Balkan & Baltic Countries and Middle East & Africa |
Key Countries Covered |
The USA, Canada, Brazil, Mexico, Argentina, the United kingdom, Germany, Italy, Russia, Spain, France, Benelux, Nordics, Poland, Hungary, Romania, Czech Republic, India, Thailand, Indonesia, Malaysia, Philippines, Vietnam, Japan, China, South Korea, Australia & New Zealand, Kingdom of Saudi Arabia, Northern Africa, Türkiye, GCC Countries and South Africa |
Key Market Segments Covered |
Material, Indication, Stent Design, Introducer Size, End User, and Region |
Key Companies Profiled |
|
Report Coverage |
Market Forecast, Competition Intelligence, DROT Analysis, Market Dynamics and Challenges, Strategic Growth Initiatives |
Pricing |
Available upon Request |
Key Market Segments Covered in the Venous Stents Industry Research
Material:
- Nitinol
- Elgiloy
Indication:
- Chronic Deep Vein Thrombosis
- Post-Thrombotic Syndrome (PTS)
- May-Thurner’s Syndrome (MTS)
- Pelvic Congestion Syndrome (PCS)
- Others
Stent Design:
- Braided
- Open Cell
- Closed Cell
- Hybrid
Introducer Size:
- Size 6
- Size 7
- Size 8
- Size 9
- Size 10
End User:
- Hospital
- Ambulatory Surgery Centers
- Specialty Clinics
- Cardiac Catheterization Labs
Region:
- North America
- Latin America
- East Asia
- South Asia & Pacific
- Western Europe
- Eastern Europe
- Central Asia
- Russia & Belarus
- Balkan & Baltic Countries
- Middle East and Africa
Frequently Asked Questions
What is the global market size reported by FMI for 2022?
The global market is worth US$ 921.4 Million for 2022, and is set to expand 2.4X over the next ten years.
What is global market estimated to reach in 2023?
The global market estimates for 2023 is around US$ 990.5 Million.
What is the global market valuation expected for 2033?
The global market is set to reach US$ 2.2 Billion by end of 2033.
What value CAGR did the global market exhibit over the last 4 years?
The global market exhibited a value CAGR of 6.9% in the last 4 years.
What is the projected CAGR for the global market from 2023 to 2033?
The global market is set to expand at a CAGR of 8.4% between 2023 and 2033.
Which material has garnered significant value share in 2022?
Nitinol material held a significant share of 89.5% in 2022 globally.
Which stent design will expanded rapidly over the forecast period?
Hybrid stent design will expanded rapidly with at a CAGR of 11.3% between 2023 and 2033.
What are the trends driving the demand outlook of the global market?
Rising prevalence of venous diseases, adoption of minimally invasive procedures, growing ageing population, and increasing awareness about venous stents usage are the key trends of the market.
Which region dominated the global venous stents market?
North American region dominated the global market with USA contributing around US$ 301.9 Million in 2022
Which end user holds a large market share in the global market?
Hospitals held a market share of around 34.9% in the global market 2022.
Table of Content
1. Executive Summary | Venous Stents Market 1.1. Global Market Outlook 1.2. Demand Side Trends 1.3. Supply-Side Trends 1.4. Analysis and Recommendations 2. Market Overview 2.1. Market Coverage / Taxonomy 2.2. Market Definition / Scope / Limitations 2.3. Inclusions and Exclusions 3. Key Market Trends 3.1. Key Trends Impacting the Market 3.2. Development/Innovation Trends 4. Value Added Insights 4.1. Product Adoption Analysis 4.2. Product USP/Features Analysis 4.3. Regulatory Landscape, By Key Countries 4.4. Reimbursement Scenario 4.5. Recent Product Approvals/Launches 4.6. Supply Chain Analysis 4.7. Porter’s Analysis 4.8. Technological Assessment 5. Market Background 5.1. Macro-Economic Factors 5.1.1. Global GDP Growth Outlook 5.1.2. Global Healthcare Expenditure 5.1.3. Global Stents Market Outlook 5.2. Forecast Factors - Relevance & Impact 5.2.1. Top Companies Historical Growth 5.2.2. New Product Launches and Approvals 5.2.3. Epidemiology of Venous Diseases 5.2.4. Global Epidemiology of Venous Thromboembolism 5.2.5. R&D Expenditure by Key Players 5.2.6. Historic and Current Revenue of key players 5.2.7. Rising Consumer Awareness of the Product 5.2.8. Rising Adoption of Device Technological development 5.2.9. Strategic Developments by Key Players 5.2.10. Increase Adoption of Different for Venous Thromboembolism 5.2.11. Strategic Collaborations among Players 5.3. Market Dynamics 5.3.1. Drivers 5.3.2. Restraints 5.3.3. Opportunity 6. COVID-19 Crisis – Impact Assessment 6.1. COVID-19 and Impact Analysis 6.1.1. Revenue By Material 6.1.2. Revenue By Indication 6.1.3. Revenue By Stent Design 6.1.4. Revenue by Introducer Size 6.1.5. Revenue By End User 6.1.6. Revenue By Region 6.2. 2022 Market Scenario 7. Global Market Demand (Volume in Units) Analysis 2018 to 2022 and Forecast, 2023 to 2033 7.1. Historical Market Value (US$ Million) Analysis, 2018 to 2022 7.2. Current and Future Market Value (US$ Million) Projections, 2023 to 2033 7.2.1. Y-o-Y Growth Trend Analysis 8. Global Market - Pricing Analysis 8.1. Regional Pricing Analysis By Material Type 8.2. Pricing Break-up 8.2.1. Manufacturer Level 8.2.2. Distributor Level 8.3. Global Average Pricing Analysis Benchmark 8.4. Pricing Assumptions 9. Global Market Demand (in Value US$ Million) Analysis 2018 to 2022 and Forecast, 2023 to 2033 9.1. Historical Market Value (US$ Million) Analysis, 2018 to 2022 9.2. Current and Future Market Value (US$ Million) Projections, 2022 to 2033 9.2.1. Y-o-Y Growth Trend Analysis 9.2.2. Absolute $ Opportunity Analysis 10. Global Market Analysis 2018 to 2022 and Forecast 2023 to 2033, By Material 10.1. Introduction / Key Findings 10.2. Historical Market Size (US$ Million) and Volume (Units) Analysis by Material, 2018 to 2022 10.3. Current and Future Market Size (US$ Million) and Volume (Units) Analysis and Forecast by Material, 2023 to 2033 10.3.1. Nitinol 10.3.2. Elgiloy 10.4. Market Attractiveness Analysis By Material 11. Global Market Analysis 2018 to 2022 and Forecast 2023 to 2033, By Indication 11.1. Introduction / Key Findings 11.2. Historical Market Size (US$ Million) By Indication, 2018 to 2022 11.3. Current and Future Market Size (US$ Million) Analysis and Forecast By Indication, 2023 to 2033 11.3.1. Chronic Deep Vein Thrombosis 11.3.2. Post-Thrombotic Syndrome (PTS) 11.3.3. May-Thurner’s Syndrome (MTS) 11.3.4. Pelvic Congestion Syndrome (PCS) 11.3.5. Others 11.4. Market Attractiveness Analysis By Indication 12. Global Market Analysis 2018 to 2022 and Forecast 2023 to 2033, By Stent Design 12.1. Introduction / Key Findings 12.2. Historical Market Size (US$ Million) By Stent Design, 2018 to 2022 12.3. Current and Future Market Size (US$ Million) Analysis and Forecast By Stent Design, 2023 to 2033 12.3.1. Braided 12.3.2. Open Cell 12.3.3. Closed Cell 12.3.4. Hybrid 12.4. Market Attractiveness Analysis By Stent Design 13. Global Market Analysis 2018 to 2022 and Forecast 2023 to 2033, By Introducer Size 13.1. Introduction / Key Findings 13.2. Historical Market Size (US$ Million) By Introducer Size, 2018 to 2022 13.3. Current and Future Market Size (US$ Million) Analysis and Forecast By Introducer Size, 2023 to 2033 13.3.1. Size - 6 13.3.2. Size - 7 13.3.3. Size - 8 13.3.4. Size - 9 13.3.5. Size - 10 13.4. Market Attractiveness Analysis By Introducer Size 14. Global Market Analysis 2018 to 2022 and Forecast 2023 to 2033, By End User 14.1. Introduction / Key Findings 14.2. Historical Market Size (US$ Million) By End User, 2018 to 2022 14.3. Current and Future Market Size (US$ Million) Analysis and Forecast By End User, 2023 to 2033 14.3.1. Hospital 14.3.2. Ambulatory Surgery Centers 14.3.3. Specialty Clinics 14.3.4. Cardiac Catheterization Labs 14.4. Market Attractiveness Analysis By End User 15. Global Market Analysis 2018 to 2022 and Forecast 2023 to 2033, By Region 15.1. Introduction / Key Findings 15.2. Historical Market Size (US$ Million) and Volume (Units) Analysis, by Region, 2018 to 2022 15.3. Current and Future Market Size (US$ Million) and Volume (Units) Analysis Forecast by Region, 2023 to 2033 15.3.1. North America 15.3.2. Latin America 15.3.3. East Asia 15.3.4. South Asia & Pacific 15.3.5. Western Europe 15.3.6. Eastern Europe 15.3.7. Central Asia 15.3.8. Russia & Belarus 15.3.9. Balkan & Baltic Countries 15.3.10. Middle East and Africa 15.4. Market Attractiveness Analysis By Region 16. North America Market Analysis 2018 to 2022 and Forecast 2023 to 2033 16.1. Introduction 16.2. Historical Market Size (US$ Million) and Volume (Units) Analysis Trend Analysis by Market Taxonomy, 2018 to 2022 16.3. Current and Future Market Size (US$ Million) and Volume (Units) Analysis and Forecast by Market Taxonomy, 2023 to 2033 16.3.1. By Country 16.3.1.1. USA 16.3.1.2. Canada 16.3.2. By Material 16.3.3. By Indication 16.3.4. By Stent Design 16.3.5. By Introducer Size 16.3.6. By End User 16.4. Market Attractiveness Analysis 16.4.1. By Country 16.4.2. By Material 16.4.3. By Indication 16.4.4. By Stent Design 16.4.5. By Introducer Size 16.4.6. By End User 16.5. Market Trends 16.6. PESTLE Analysis 16.7. Key Market Participants - Intensity Mapping 16.8. Drivers and Restraints - Impact Analysis 16.9. Country Level Analysis & Forecast 16.9.1. USA Market Analysis 16.9.1.1. Introduction 16.9.1.2. Market Analysis and Forecast by Market Taxonomy 16.9.1.2.1. By Material 16.9.1.2.2. By Indication 16.9.1.2.3. By Stent Design 16.9.1.2.4. By Introducer Size 16.9.1.2.5. By End User 16.9.2. Canada Market Analysis 16.9.2.1. Introduction 16.9.2.2. Market Analysis and Forecast by Market Taxonomy 16.9.2.2.1. By Material 16.9.2.2.2. By Indication 16.9.2.2.3. By Stent Design 16.9.2.2.4. By Introducer Size 16.9.2.2.5. By End User 17. Latin America Market Analysis 2018 to 2022 and Forecast 2023 to 2033 17.1. Introduction 17.2. Historical Market Size (US$ Million) and Volume (Units) Analysis Trend Analysis By Market Taxonomy, 2018 to 2022 17.3. Current and Future Market Size (US$ Million) and Volume (Units) Analysis and Forecast by Market Taxonomy, 2023 to 2033 17.3.1. By Country 17.3.1.1. Brazil 17.3.1.2. Mexico 17.3.1.3. Argentina 17.3.1.4. Rest of LATAM 17.3.2. By Material 17.3.3. By Indication 17.3.4. By Stent Design 17.3.5. By Introducer Size 17.3.6. By End User 17.4. Market Attractiveness Analysis 17.4.1. By Country 17.4.2. By Material 17.4.3. By Indication 17.4.4. By Stent Design 17.4.5. By Introducer Size 17.4.6. By End User 17.5. Market Trends 17.6. PESTLE Analysis 17.7. Key Market Participants - Intensity Mapping 17.8. Drivers and Restraints - Impact Analysis 17.9. Country Level Analysis & Forecast 17.9.1. Brazil Market Analysis 17.9.1.1. Introduction 17.9.1.2. Market Analysis and Forecast by Market Taxonomy 17.9.1.2.1. By Material 17.9.1.2.2. By Indication 17.9.1.2.3. By Stent Design 17.9.1.2.4. By Introducer Size 17.9.1.2.5. By End User 17.9.2. Mexico Market Analysis 17.9.2.1. Introduction 17.9.2.2. Market Analysis and Forecast by Market Taxonomy 17.9.2.2.1. By Material 17.9.2.2.2. By Indication 17.9.2.2.3. By Stent Design 17.9.2.2.4. By Introducer Size 17.9.2.2.5. By End User 17.9.3. Argentina Market Analysis 17.9.3.1. Introduction 17.9.3.2. Market Analysis and Forecast by Market Taxonomy 17.9.3.2.1. By Material 17.9.3.2.2. By Indication 17.9.3.2.3. By Stent Design 17.9.3.2.4. By Introducer Size 17.9.3.2.5. By End User 18. East Asia Market Analysis 2018 to 2022 and Forecast 2023 to 2033 18.1. Introduction 18.2. Historical Market Size (US$ Million) and Volume (Units) Analysis Trend Analysis By Market Taxonomy, 2018 to 2022 18.3. Current and Future Market Size (US$ Million) and Volume (Units) Analysis and Forecast by Market Taxonomy, 2023 to 2033 18.3.1. By Country 18.3.1.1. China 18.3.1.2. Japan 18.3.1.3. South Korea 18.3.2. By Material 18.3.3. By Indication 18.3.4. By Stent Design 18.3.5. By Introducer Size 18.3.6. By End User 18.4. Market Attractiveness Analysis 18.4.1. By Country 18.4.2. By Material 18.4.3. By Indication 18.4.4. By Stent Design 18.4.5. By Introducer Size 18.4.6. By End User 18.5. Market Trends 18.6. PESTLE Analysis 18.7. Key Market Participants - Intensity Mapping 18.8. Drivers and Restraints - Impact Analysis 18.9. Country Level Analysis & Forecast 18.9.1. China Market Analysis 18.9.1.1. Introduction 18.9.1.2. Market Analysis and Forecast by Market Taxonomy 18.9.1.2.1. By Material 18.9.1.2.2. By Indication 18.9.1.2.3. By Stent Design 18.9.1.2.4. By Introducer Size 18.9.1.2.5. By End User 18.9.2. Japan Market Analysis 18.9.2.1. Introduction 18.9.2.2. Market Analysis and Forecast by Market Taxonomy 18.9.2.2.1. By Material 18.9.2.2.2. By Indication 18.9.2.2.3. By Stent Design 18.9.2.2.4. By Introducer Size 18.9.2.2.5. By End User 18.9.3. South Korea Market Analysis 18.9.3.1. Introduction 18.9.3.2. Market Analysis and Forecast by Market Taxonomy 18.9.3.2.1. By Material 18.9.3.2.2. By Indication 18.9.3.2.3. By Stent Design 18.9.3.2.4. By Introducer Size 18.9.3.2.5. By End User 19. South Asia Market Analysis 2018 to 2022 and Forecast 2023 to 2033 19.1. Introduction 19.2. Historical Market Size (US$ Million) and Volume (Units) Analysis Trend Analysis By Market Taxonomy, 2018 to 2022 19.3. Current and Future Market Size (US$ Million) and Volume (Units) Analysis and Forecast by Market Taxonomy, 2023 to 2033 19.3.1. By Country 19.3.1.1. India 19.3.1.2. Indonesia 19.3.1.3. Thailand 19.3.1.4. Philippines 19.3.1.5. Malaysia 19.3.1.6. Vietnam 19.3.1.7. Rest of ASEAN 19.3.1.8. Australia & New Zeland 19.3.2. By Material 19.3.3. By Indication 19.3.4. By Stent Design 19.3.5. By Introducer Size 19.3.6. By End User 19.4. Market Attractiveness Analysis 19.4.1. By Country 19.4.2. By Material 19.4.3. By Indication 19.4.4. By Stent Design 19.4.5. By Introducer Size 19.4.6. By End User 19.5. Market Trends 19.6. PESTLE Analysis 19.7. Key Market Participants - Intensity Mapping 19.8. Drivers and Restraints - Impact Analysis 19.9. Country Level Analysis & Forecast 19.9.1. India Market Analysis 19.9.1.1. Introduction 19.9.1.2. Market Analysis and Forecast by Market Taxonomy 19.9.1.2.1. By Material 19.9.1.2.2. By Indication 19.9.1.2.3. By Stent Design 19.9.1.2.4. By Introducer Size 19.9.1.2.5. By End User 19.9.2. Indonesia Market Analysis 19.9.2.1. Introduction 19.9.2.2. Market Analysis and Forecast by Market Taxonomy 19.9.2.2.1. By Material 19.9.2.2.2. By Indication 19.9.2.2.3. By Stent Design 19.9.2.2.4. By Introducer Size 19.9.2.2.5. By End User 19.9.3. Thailand Market Analysis 19.9.3.1. Introduction 19.9.3.2. Market Analysis and Forecast by Market Taxonomy 19.9.3.2.1. By Material 19.9.3.2.2. By Indication 19.9.3.2.3. By Stent Design 19.9.3.2.4. By Introducer Size 19.9.3.2.5. By End User 19.9.4. Philippines Market Analysis 19.9.4.1. Introduction 19.9.4.2. Market Analysis and Forecast by Market Taxonomy 19.9.4.2.1. By Material 19.9.4.2.2. By Indication 19.9.4.2.3. By Stent Design 19.9.4.2.4. By Introducer Size 19.9.4.2.5. By End User 19.9.5. Malaysia Market Analysis 19.9.5.1. Introduction 19.9.5.2. Market Analysis and Forecast by Market Taxonomy 19.9.5.2.1. By Material 19.9.5.2.2. By Indication 19.9.5.2.3. By Stent Design 19.9.5.2.4. By Introducer Size 19.9.5.2.5. By End User 19.9.6. Vietnam Market Analysis 19.9.6.1. Introduction 19.9.6.2. Market Analysis and Forecast by Market Taxonomy 19.9.6.2.1. By Material 19.9.6.2.2. By Indication 19.9.6.2.3. By Stent Design 19.9.6.2.4. By Introducer Size 19.9.6.2.5. By End User 19.9.7. Australia & New Zealand Market Analysis 19.9.7.1. Introduction 19.9.7.2. Market Analysis and Forecast by Market Taxonomy 19.9.7.2.1. By Material 19.9.7.2.2. By Indication 19.9.7.2.3. By Stent Design 19.9.7.2.4. By Introducer Size 19.9.7.2.5. By End User 20. Western Europe Market Analysis 2018 to 2022 and Forecast 2023 to 2033 20.1. Introduction 20.2. Historical Market Size (US$ Million) and Volume (Units) Analysis Trend Analysis by Market Taxonomy, 2018 to 2022 20.3. Current and Future Market Size (US$ Million) and Volume (Units) Analysis and Forecast by Market Taxonomy, 2023 to 2033 20.3.1. By Country 20.3.1.1. Germany 20.3.1.2. France 20.3.1.3. Spain 20.3.1.4. Italy 20.3.1.5. BENELUX 20.3.1.6. Nordics 20.3.1.7. United Kingdom 20.3.2. By Material 20.3.3. By Indication 20.3.4. By Stent Design 20.3.5. By Introducer Size 20.3.6. By End User 20.4. Market Attractiveness Analysis 20.4.1. By Country 20.4.2. By Material 20.4.3. By Indication 20.4.4. By Stent Design 20.4.5. By Introducer Size 20.4.6. By End User 20.5. Market Trends 20.6. PESTLE Analysis 20.7. Key Market Participants - Intensity Mapping 20.8. Drivers and Restraints - Impact Analysis 20.9. Country Level Analysis & Forecast 20.9.1. Germany Market Analysis 20.9.1.1. Introduction 20.9.1.2. Market Analysis and Forecast by Market Taxonomy 20.9.1.2.1. By Material 20.9.1.2.2. By Indication 20.9.1.2.3. By Stent Design 20.9.1.2.4. By Introducer Size 20.9.1.2.5. By End User 20.9.2. France Market Analysis 20.9.2.1. Introduction 20.9.2.2. Market Analysis and Forecast by Market Taxonomy 20.9.2.2.1. By Material 20.9.2.2.2. By Indication 20.9.2.2.3. By Stent Design 20.9.2.2.4. By Introducer Size 20.9.2.2.5. By End User 20.9.3. Spain Market Analysis 20.9.3.1. Introduction 20.9.3.2. Market Analysis and Forecast by Market Taxonomy 20.9.3.2.1. By Material 20.9.3.2.2. By Indication 20.9.3.2.3. By Stent Design 20.9.3.2.4. By Introducer Size 20.9.3.2.5. By End User 20.9.4. Italy Market Analysis 20.9.4.1. Introduction 20.9.4.2. Market Analysis and Forecast by Market Taxonomy 20.9.4.2.1. By Material 20.9.4.2.2. By Indication 20.9.4.2.3. By Stent Design 20.9.4.2.4. By Introducer Size 20.9.4.2.5. By End User 20.9.5. BENELUX Market Analysis 20.9.5.1. Introduction 20.9.5.2. Market Analysis and Forecast by Market Taxonomy 20.9.5.2.1. By States 20.9.5.2.1.1. Belgium 20.9.5.2.1.2. Netherlands 20.9.5.2.1.3. Luxembourg 20.9.5.2.2. By Material 20.9.5.2.3. By Indication 20.9.5.2.4. By Stent Design 20.9.5.2.5. By Introducer Size 20.9.5.2.6. By End User 20.9.6. Nordic Countries Market Analysis 20.9.6.1. Introduction 20.9.6.2. Market Analysis and Forecast by Market Taxonomy 20.9.6.2.1. By States 20.9.6.2.1.1. Denmark 20.9.6.2.1.2. Norway 20.9.6.2.1.3. Sweden 20.9.6.2.1.4. Finland 20.9.6.2.1.5. Iceland 20.9.6.2.1.6. Greenland 20.9.6.2.2. By Material 20.9.6.2.3. By Indication 20.9.6.2.4. By Stent Design 20.9.6.2.5. By Introducer Size 20.9.6.2.6. By End User 20.9.7. United Kingdom Market Analysis 20.9.7.1. Introduction 20.9.7.2. Market Analysis and Forecast by Market Taxonomy 20.9.7.2.1. By Material 20.9.7.2.2. By Indication 20.9.7.2.3. By Stent Design 20.9.7.2.4. By Introducer Size 20.9.7.2.5. By End User 21. Eastern Europe Market Analysis 2018 to 2022 and Forecast 2023 to 2033 21.1. Introduction 21.2. Historical Market Size (US$ Million) and Volume (Units) Analysis Trend Analysis by Market Taxonomy, 2018 to 2022 21.3. Current and Future Market Size (US$ Million) and Volume (Units) Analysis and Forecast by Market Taxonomy, 2023 to 2033 21.3.1. By Country 21.3.1.1. Poland 21.3.1.2. Hungary 21.3.1.3. Romania 21.3.1.4. Czech Republic 21.3.1.5. Others 21.3.2. By Material 21.3.3. By Indication 21.3.4. By Stent Design 21.3.5. By Introducer Size 21.3.6. By End User 21.4. Market Attractiveness Analysis 21.4.1. By Country 21.4.2. By Material 21.4.3. By Indication 21.4.4. By Stent Design 21.4.5. By Introducer Size 21.4.6. By End User 21.5. Market Trends 21.6. PESTLE Analysis 21.7. Key Market Participants - Intensity Mapping 21.8. Drivers and Restraints - Impact Analysis 21.9. Country Level Analysis & Forecast 21.9.1. Poland Market Analysis 21.9.1.1. Introduction 21.9.1.2. Market Analysis and Forecast by Market Taxonomy 21.9.1.2.1. By Material 21.9.1.2.2. By Indication 21.9.1.2.3. By Stent Design 21.9.1.2.4. By Introducer Size 21.9.1.2.5. By End User 21.9.2. Hungary Market Analysis 21.9.2.1. Introduction 21.9.2.2. Market Analysis and Forecast by Market Taxonomy 21.9.2.2.1. By Material 21.9.2.2.2. By Indication 21.9.2.2.3. By Stent Design 21.9.2.2.4. By Introducer Size 21.9.2.2.5. By End User 21.9.3. Romania Market Analysis 21.9.3.1. Introduction 21.9.3.2. Market Analysis and Forecast by Market Taxonomy 21.9.3.2.1. By Material 21.9.3.2.2. By Indication 21.9.3.2.3. By Stent Design 21.9.3.2.4. By Introducer Size 21.9.3.2.5. By End User 21.9.4. Czech Republic Market Analysis 21.9.4.1. Introduction 21.9.4.2. Market Analysis and Forecast by Market Taxonomy 21.9.4.2.1. By Material 21.9.4.2.2. By Indication 21.9.4.2.3. By Stent Design 21.9.4.2.4. By Introducer Size 21.9.4.2.5. By End User 22. Central Asia Market 2018 to 2022 and Forecast 2023 to 2033 22.1. Introduction 22.2. Historical Market Size (US$ Million) and Volume (Units) Analysis Trend Analysis By Market Taxonomy, 2018 to 2022 22.3. Current and Future Market Size (US$ Million) and Volume (Units) Analysis and Forecast by Market Taxonomy, 2023 to 2033 22.3.1. By Material 22.3.2. By Indication 22.3.3. By Stent Design 22.3.4. By Introducer Size 22.3.5. By End User 22.4. Market Attractiveness Analysis 22.4.1. By Material 22.4.2. By Indication 22.4.3. By Stent Design 22.4.4. By Introducer Size 22.4.5. By End User 22.5. Market Trends 22.6. PESTLE Analysis 22.7. Key Market Participants - Intensity Mapping 22.8. Drivers and Restraints - Impact Analysis 23. Russia & Belarus Market 2018 to 2022 and Forecast 2023 to 2033 23.1. Introduction 23.2. Historical Market Size (US$ Million) and Volume (Units) Analysis Trend Analysis By Market Taxonomy, 2018 to 2022 23.3. Current and Future Market Size (US$ Million) and Volume (Units) Analysis and Forecast by Market Taxonomy, 2023 to 2033 23.3.1. By Material 23.3.2. By Indication 23.3.3. By Stent Design 23.3.4. By Introducer Size 23.3.5. By End User 23.4. Market Attractiveness Analysis 23.4.1. By Material 23.4.2. By Indication 23.4.3. By Stent Design 23.4.4. By Introducer Size 23.4.5. By End User 23.5. Market Trends 23.6. PESTLE Analysis 23.7. Key Market Participants - Intensity Mapping 23.8. Drivers and Restraints - Impact Analysis 24. Balkan & Baltic Countries Market Analysis 2018 to 2022 and Forecast 2023 to 2033 24.1. Introduction 24.2. Historical Market Size (US$ Million) and Volume (Units) Analysis Trend Analysis by Market Taxonomy, 2018 to 2022 24.3. Current and Future Market Size (US$ Million) and Volume (Units) Analysis and Forecast by Market Taxonomy, 2023 to 2033 24.3.1. By Material 24.3.2. By Indication 24.3.3. By Stent Design 24.3.4. By Introducer Size 24.3.5. By End User 24.4. Market Attractiveness Analysis 24.4.1. By Material 24.4.2. By Indication 24.4.3. By Stent Design 24.4.4. By Introducer Size 24.4.5. By End User 24.5. Market Trends 24.6. PESTLE Analysis 24.7. Key Market Participants - Intensity Mapping 24.8. Drivers and Restraints - Impact Analysis 25. Middle East & Africa Market Analysis 2018 to 2022 and Forecast 2023 to 2033 25.1. Introduction 25.2. Historical Market Size (US$ Million) and Volume (Units) Analysis Trend Analysis by Market Taxonomy, 2018 to 2022 25.3. Current and Future Market Size (US$ Million) and Volume (Units) Analysis and Forecast by Market Taxonomy, 2023 to 2033 25.3.1. By Country 25.3.1.1. GCC Countries 25.3.1.2. Kingdom of Saudi Arabia 25.3.1.3. Türkiye 25.3.1.4. Northern Africa 25.3.1.5. South Africa 25.3.1.6. Israel 25.3.2. By Material 25.3.3. By Indication 25.3.4. By Stent Design 25.3.5. By Introducer Size 25.3.6. By End User 25.4. Market Attractiveness Analysis 25.4.1. By Country 25.4.2. By Material 25.4.3. By Indication 25.4.4. By Stent Design 25.4.5. By Introducer Size 25.4.6. By End User 25.5. Market Trends 25.6. PESTLE Analysis 25.7. Key Market Participants - Intensity Mapping 25.8. Drivers and Restraints - Impact Analysis 25.9. Country Level Analysis & Forecast 25.9.1. GCC Countries Market Analysis 25.9.1.1. Introduction 25.9.1.2. Market Analysis and Forecast by Market Taxonomy 25.9.1.2.1. By Material 25.9.1.2.2. By Indication 25.9.1.2.3. By Stent Design 25.9.1.2.4. By Introducer Size 25.9.1.2.5. By End User 25.9.2. Kingdom of Saudi Arabia Market Analysis 25.9.2.1. Introduction 25.9.2.2. Market Analysis and Forecast by Market Taxonomy 25.9.2.2.1. By Material 25.9.2.2.2. By Indication 25.9.2.2.3. By Stent Design 25.9.2.2.4. By Introducer Size 25.9.2.2.5. By End User 25.9.3. Türkiye Market Analysis 25.9.3.1. Introduction 25.9.3.2. Market Analysis and Forecast by Market Taxonomy 25.9.3.2.1. By Material 25.9.3.2.2. By Indication 25.9.3.2.3. By Stent Design 25.9.3.2.4. By Introducer Size 25.9.3.2.5. By End User 25.9.4. Northern Africa Market Analysis 25.9.4.1. Introduction 25.9.4.2. Market Analysis and Forecast by Market Taxonomy 25.9.4.2.1. By Material 25.9.4.2.2. By Indication 25.9.4.2.3. By Stent Design 25.9.4.2.4. By Introducer Size 25.9.4.2.5. By End User 25.9.5. South Africa Market Analysis 25.9.5.1. Introduction 25.9.5.2. Market Analysis and Forecast by Market Taxonomy 25.9.5.2.1. By Material 25.9.5.2.2. By Indication 25.9.5.2.3. By Stent Design 25.9.5.2.4. By Introducer Size 25.9.5.2.5. By End User 25.9.6. Israel Market Analysis 25.9.6.1. Introduction 25.9.6.2. Market Analysis and Forecast by Market Taxonomy 25.9.6.2.1. By Material 25.9.6.2.2. By Indication 25.9.6.2.3. By Stent Design 25.9.6.2.4. By Introducer Size 25.9.6.2.5. By End User 26. Market Structure Analysis 26.1. Market Analysis by Tier of Companies 26.2. Market Share Analysis of Top Players (%) 26.3. Market Presence Analysis 26.3.1. By Regional Footprint of Players 26.3.2. Product Footprint of Players 26.3.3. Channel Footprint of Players 27. Competition Analysis 27.1. Competition Dashboard 27.2. Competition Benchmarking 27.3. Competition Deep Dive 27.3.1. Becton, Dickinson and Company 27.3.1.1. Overview 27.3.1.2. Product Portfolio 27.3.1.3. Key Financials 27.3.1.4. SWOT Analysis 27.3.1.5. Key Developments 27.3.1.6. Sales Footprint 27.3.1.7. Strategy Overview 27.3.1.7.1. Marketing Strategies 27.3.1.7.2. Product Strategies 27.3.1.7.3. Channel Strategies 27.3.2. Cook Group Inc 27.3.2.1. Overview 27.3.2.2. Product Portfolio 27.3.2.3. Key Financials 27.3.2.4. SWOT Analysis 27.3.2.5. Key Developments 27.3.2.6. Sales Footprint 27.3.2.7. Strategy Overview 27.3.2.7.1. Marketing Strategies 27.3.2.7.2. Product Strategies 27.3.2.7.3. Channel Strategies 27.3.3. Boston Scientific Corporation 27.3.3.1. Overview 27.3.3.2. Product Portfolio 27.3.3.3. Key Financials 27.3.3.4. SWOT Analysis 27.3.3.5. Key Developments 27.3.3.6. Sales Footprint 27.3.3.7. Strategy Overview 27.3.3.7.1. Marketing Strategies 27.3.3.7.2. Product Strategies 27.3.3.7.3. Channel Strategies 27.3.4. Medtronic 27.3.4.1. Overview 27.3.4.2. Product Portfolio 27.3.4.3. Key Financials 27.3.4.4. SWOT Analysis 27.3.4.5. Key Developments 27.3.4.6. Sales Footprint 27.3.4.7. Strategy Overview 27.3.4.7.1. Marketing Strategies 27.3.4.7.2. Product Strategies 27.3.4.7.3. Channel Strategies 27.3.5. Koninklijke Philips N.V. (Vesper Medical Inc.) 27.3.5.1. Overview 27.3.5.2. Product Portfolio 27.3.5.3. Key Financials 27.3.5.4. SWOT Analysis 27.3.5.5. Key Developments 27.3.5.6. Sales Footprint 27.3.5.7. Strategy Overview 27.3.5.7.1. Marketing Strategies 27.3.5.7.2. Product Strategies 27.3.5.7.3. Channel Strategies 27.3.6. Optimed Medizinische Instrumente GmbH 27.3.6.1. Overview 27.3.6.2. Product Portfolio 27.3.6.3. Key Financials 27.3.6.4. SWOT Analysis 27.3.6.5. Key Developments 27.3.6.6. Sales Footprint 27.3.6.7. Strategy Overview 27.3.6.7.1. Marketing Strategies 27.3.6.7.2. Product Strategies 27.3.6.7.3. Channel Strategies 27.3.7. plus medica GmbH & Co. KG 27.3.7.1. Overview 27.3.7.2. Product Portfolio 27.3.7.3. Key Financials 27.3.7.4. SWOT Analysis 27.3.7.5. Key Developments 27.3.7.6. Sales Footprint 27.3.7.7. Strategy Overview 27.3.7.7.1. Marketing Strategies 27.3.7.7.2. Product Strategies 27.3.7.7.3. Channel Strategies 27.3.8. Abbott Laboratories, Inc. 27.3.8.1. Overview 27.3.8.2. Product Portfolio 27.3.8.3. Key Financials 27.3.8.4. SWOT Analysis 27.3.8.5. Key Developments 27.3.8.6. Sales Footprint 27.3.8.7. Strategy Overview 27.3.8.7.1. Marketing Strategies 27.3.8.7.2. Product Strategies 27.3.8.7.3. Channel Strategies 28. Assumptions and Acronyms Used 29. Research Methodolog
Don't pay for what you don't need
Customize your report by selecting specific countries or regions and save 30%!
List of Tables
Table 01: Global Market Size (US$ Million) Analysis 2018 to 2022 and Forecast, 2023 to 2033, By Material Table 02: Global Market Volume (in ‘Units) Analysis 2018 to 2022 and Forecast, 2023 to 2033, By Material Table 03: Global Market Size (US$ Million) Analysis 2018 to 2022 and Forecast, 2023 to 2033, By Indication Table 04: Global Market Size (US$ Million) Analysis 2018 to 2022 and Forecast, 2023 to 2033, By Stent Design Table 05: Global Market Size (US$ Million) Analysis 2018 to 2022 and Forecast, 2023 to 2033, By Introducer Size Table 06: Global Market Size (US$ Million) Analysis 2018 to 2022 and Forecast, 2023 to 2033, By End User Table 07: Global Market Size (US$ Million) Analysis 2018 to 2022 and Forecast, 2023 to 2033, By Region Table 08: Global Market Volume (in ‘Units) Analysis 2018 to 2022 and Forecast, 2023 to 2033, By Region Table 09: North America Market Size (US$ Million) Analysis 2018 to 2022 and Forecast, 2023 to 2033, By Country Table 10: North America Market Size (US$ Million) Analysis 2018 to 2022 and Forecast, 2023 to 2033, By Material Table 11: North America Market Volume (in ‘Units) Analysis 2018 to 2022 and Forecast, 2023 to 2033, By Material Table 12: North America Market Size (US$ Million) Analysis 2018 to 2022 and Forecast, 2023 to 2033, By Indication Table 13: North America Market Size (US$ Million) Analysis 2018 to 2022 and Forecast, 2023 to 2033, By Stent Design Table 14: North America Market Size (US$ Million) Analysis 2018 to 2022 and Forecast, 2023 to 2033, By Introducer Size Table 15: North America Market Size (US$ Million) Analysis 2018 to 2022 and Forecast, 2023 to 2033, By End User Table 16: Latin America Market Size (US$ Million) Analysis 2018 to 2022 and Forecast, 2023 to 2033, By Country Table 17: Latin America Market Size (US$ Million) Analysis 2018 to 2022 and Forecast, 2023 to 2033, By Material Table 18: Latin America Market Volume (in ‘Units) Analysis 2018 to 2022 and Forecast, 2023 to 2033, By Material Table 19: Latin America Market Size (US$ Million) Analysis 2018 to 2022 and Forecast, 2023 to 2033, By Indication Table 20: Latin America Market Size (US$ Million) Analysis 2018 to 2022 and Forecast, 2023 to 2033, By Stent Design Table 21: Latin America Market Size (US$ Million) Analysis 2018 to 2022 and Forecast, 2023 to 2033, By Introducer Size Table 22: Latin America Market Size (US$ Million) Analysis 2018 to 2022 and Forecast, 2023 to 2033, By End User Table 23: East Asia Market Size (US$ Million) Analysis 2018 to 2022 and Forecast, 2023 to 2033, By Country Table 24: East Asia Market Size (US$ Million) Analysis 2018 to 2022 and Forecast, 2023 to 2033, By Material Table 25: East Asia Market Volume (in 'Units) Analysis 2018 to 2022 and Forecast, 2023 to 2033, By Material Table 26: East Asia Market Size (US$ Million) Analysis 2018 to 2022 and Forecast, 2023 to 2033, By Indication Table 27: East Asia Market Size (US$ Million) Analysis 2018 to 2022 and Forecast, 2023 to 2033, By Stent Design Table 28: East Asia Market Size (US$ Million) Analysis 2018 to 2022 and Forecast, 2023 to 2033, By Introducer Size Table 29: East Asia Market Size (US$ Million) Analysis 2018 to 2022 and Forecast, 2023 to 2033, By End User Table 30: South Asia and Pacific Market Size (US$ Million) Analysis 2018 to 2022 and Forecast, 2023 to 2033, By Country Table 31: South Asia and Pacific Market Size (US$ Million) Analysis 2018 to 2022 and Forecast, 2023 to 2033, By Material Table 32: South Asia and Pacific Market Volume (in 'Units) Analysis 2018 to 2022 and Forecast, 2023 to 2033, By Material Table 33: South Asia and Pacific Market Size (US$ Million) Analysis 2018 to 2022 and Forecast, 2023 to 2033, By Indication Table 34: South Asia and Pacific Market Size (US$ Million) Analysis 2018 to 2022 and Forecast, 2023 to 2033, By Stent Design Table 35: South Asia and Pacific Market Size (US$ Million) Analysis 2018 to 2022 and Forecast, 2023 to 2033, By Introducer Size Table 36: South Asia and Pacific Market Size (US$ Million) Analysis 2018 to 2022 and Forecast, 2023 to 2033, By End User Table 37: Western Europe Market Size (US$ Million) Analysis 2018 to 2022 and Forecast, 2023 to 2033, By Country Table 38: Western Europe Market Size (US$ Million) Analysis 2018 to 2022 and Forecast, 2023 to 2033, By Material Table 39: Western Europe Market Volume (in 'Units) Analysis 2018 to 2022 and Forecast, 2023 to 2033, By Material Table 40: Western Europe Market Size (US$ Million) Analysis 2018 to 2022 and Forecast, 2023 to 2033, By Indication Table 41: Western Europe Market Size (US$ Million) Analysis 2018 to 2022 and Forecast, 2023 to 2033, By Stent Design Table 42: Western Europe Market Size (US$ Million) Analysis 2018 to 2022 and Forecast, 2023 to 2033, By Introducer Size Table 43: Western Europe Market Size (US$ Million) Analysis 2018 to 2022 and Forecast, 2023 to 2033, By End User Table 44: Eastern Europe Market Size (US$ Million) Analysis 2018 to 2022 and Forecast, 2023 to 2033, By Country Table 45: Eastern Europe Market Size (US$ Million) Analysis 2018 to 2022 and Forecast, 2023 to 2033, By Material Table 46: Eastern Europe Market Volume (in 'Units) Analysis 2018 to 2022 and Forecast, 2023 to 2033, By Material Table 47: Eastern Europe Market Size (US$ Million) Analysis 2018 to 2022 and Forecast, 2023 to 2033, By Indication Table 48: Eastern Europe Market Size (US$ Million) Analysis 2018 to 2022 and Forecast, 2023 to 2033, By Stent Design Table 49: Eastern Europe Market Size (US$ Million) Analysis 2018 to 2022 and Forecast, 2023 to 2033, By Introducer Size Table 50: Eastern Europe Market Size (US$ Million) Analysis 2018 to 2022 and Forecast, 2023 to 2033, By End User Table 51: Central Asia Market Volume (in 'Units) Analysis 2018 to 2022 and Forecast, 2023 to 2033, By Material Table 52: Central Asia Market size (US$ Million) Analysis 2018 to 2022 and Forecast, 2023 to 2033, By Material Table 53: Central Asia Market Size (US$ Million) Analysis 2018 to 2022 and Forecast, 2023 to 2033, By Indication Table 54: Central Asia Market Size (US$ Million) Analysis 2018 to 2022 and Forecast, 2023 to 2033, By Stent Design Table 55: Central Asia Market Size (US$ Million) Analysis 2018 to 2022 and Forecast, 2023 to 2033, By Introducer Size Table 56: Central Asia Market Size (US$ Million) Analysis 2018 to 2022 and Forecast, 2023 to 2033, By End User Table 57: Russia & Belarus Market Size (US$ Million) Analysis 2018 to 2022 and Forecast, 2023 to 2033, By Material Table 58: Russia & Belarus Market Volume (in ‘Units) Analysis 2018 to 2022 and Forecast, 2023 to 2033, By Material Table 59: Russia & Belarus Market Size (US$ Million) Analysis 2018 to 2022 and Forecast, 2023 to 2033, By Indication Table 60: Russia & Belarus Market Size (US$ Million) Analysis 2018 to 2022 and Forecast, 2023 to 2033, By Stent Design Table 61: Russia & Belarus Market Size (US$ Million) Analysis 2018 to 2022 and Forecast, 2023 to 2033, By Introducer Size Table 62: Russia & Belarus Market Size (US$ Million) Analysis 2018 to 2022 and Forecast, 2023 to 2033, By End User Table 63: Balkan & Baltic Countries Market Size (US$ Million) Analysis 2018 to 2022 and Forecast, 2023 to 2033, By Material Table 64: Balkan & Baltic Countries Market Volume (in ‘Units) Analysis 2018 to 2022 and Forecast, 2023 to 2033, By Material Table 65: Balkan & Baltic Countries Market Size (US$ Million) Analysis 2018 to 2022 and Forecast, 2023 to 2033, By Indication Table 66: Balkan & Baltic Countries Market Size (US$ Million) Analysis 2018 to 2022 and Forecast, 2023 to 2033, By Stent Design Table 67: Balkan & Baltic Countries Market Size (US$ Million) Analysis 2018 to 2022 and Forecast, 2023 to 2033, By Introducer Size Table 68: Balkan & Baltic Countries Market Size (US$ Million) Analysis 2018 to 2022 and Forecast, 2023 to 2033, By End User Table 69: Middle East and Africa Market Size (US$ Million) Analysis 2018 to 2022 and Forecast, 2023 to 2033, By Country Table 70: Middle East and Africa Market Size (US$ Million) Analysis 2018 to 2022 and Forecast, 2023 to 2033, By Material Table 71: Middle East and Africa Market Volume (in ‘Units) Analysis 2018 to 2022 and Forecast, 2023 to 2033, By Material Table 72: Middle East and Africa Market Size (US$ Million) Analysis 2018 to 2022 and Forecast, 2023 to 2033, By Indication Table 73: Middle East and Africa Market Size (US$ Million) Analysis 2018 to 2022 and Forecast, 2023 to 2033, By Stent Design Table 74: Middle East and Africa Market Size (US$ Million) Analysis 2018 to 2022 and Forecast, 2023 to 2033, By Introducer Size Table 75: Middle East and Africa Market Size (US$ Million) Analysis 2018 to 2022 and Forecast, 2023 to 2033, By End User
List of Charts
Figure 01: Global Market Volume (in 'Units) Analysis, 2018 to 2022 Figure 02: Global Market Volume (in 'Units) & Y-o-Y Growth (%) Forecast, 2023 to 2033 Figure 03: Global Average Pricing Analysis Benchmark US$ per Venous Stent (2022) Figure 04: Global Market Value Analysis (US$ Million), 2018 to 2022 Figure 05: Global Market Value Forecast (US$ Million), 2023 to 2033 Figure 06: Global Market Absolute $ Opportunity, 2022–2033 Figure 07: Global Market Share Analysis (%), By Material, 2023 & 2033 Figure 08: Global Market Y-o-Y Analysis (%), By Material, 2023 to 2033 Figure 09: Global Market Attractiveness Analysis By Material, 2023 to 2033 Figure 10: Global Market Share Analysis (%), By Indication, 2023 & 2033 Figure 11: Global Market Y-o-Y Analysis (%), By Indication, 2023 to 2033 Figure 12: Global Market Attractiveness Analysis By Indication, 2023 to 2033 Figure 13: Global Market Share Analysis (%), By Stent Design, 2023 & 2033 Figure 14: Global Market Y-o-Y Analysis (%), By Stent Design, 2023 to 2033 Figure 15: Global Market Attractiveness Analysis By Stent Design, 2023 to 2033 Figure 16: Global Market Share Analysis (%), By Introducer Size, 2023 & 2033 Figure 17: Global Market Y-o-Y Analysis (%), By Introducer Size, 2023 to 2033 Figure 18: Global Market Attractiveness Analysis By Introducer Size, 2023 to 2033 Figure 19: Global Market Share Analysis (%), By End User, 2023 & 2033 Figure 20: Global Market Y-o-Y Analysis (%), By End User, 2023 to 2033 Figure 21: Global Market Attractiveness Analysis By End User, 2023 to 2033 Figure 22: Global Market Share Analysis (%), By Region, 2023 & 2033 Figure 23: Global Market Y-o-Y Analysis (%), By Region, 2023 to 2033 Figure 24: Global Market Attractiveness Analysis By Region, 2023 to 2033 Figure 25: North America Market Share Analysis (%), By Material, 2023 (E) Figure 26: North America Market Share Analysis (%), By Indication, 2023 (E) Figure 27: North America Market Share Analysis (%), By Stent Design, 2023 (E) Figure 28: North America Market Share Analysis (%), By Introducer Size, 2023 (E) Figure 29: North America Market Share Analysis (%), By End User, 2023 (E) Figure 30: North America Market Share Analysis (%), By Country, 2023 (E) Figure 31: North America Market Value Analysis (US$ Million), 2018 to 2022 Figure 32: North America Market Value Forecast (US$ Million), 2023 to 2033 Figure 33: North America Market Attractiveness Analysis By Material, 2023 to 2033 Figure 34: North America Market Attractiveness Analysis By Indication, 2023 to 2033 Figure 35: North America Market Attractiveness Analysis By Stent Design, 2023 to 2033 Figure 36: North America Market Attractiveness Analysis By Introducer Size, 2023 to 2033 Figure 37: North America Market Attractiveness Analysis By End User, 2023 to 2033 Figure 38: North America Market Attractiveness Analysis By Country, 2023 to 2033 Figure 39: USA Market Value Proportion Analysis, 2022 Figure 40: Global Vs USA Y-o-Y Growth Comparison, 2022 to 2033 Figure 41: USA Market Share Analysis (%) by Material, 2022 & 2033 Figure 42: USA Market Share Analysis (%) Indication, 2022 & 2033 Figure 43: USA Market Share Analysis (%) by Stent Design, 2022 & 2033 Figure 44: USA Market Share Analysis (%) by Introducer Size, 2022 & 2033 Figure 45: USA Market Share Analysis (%) by End User, 2022 & 2033 Figure 46: Canada Market Value Proportion Analysis, 2022 Figure 47: Global Vs Canada Y-o-Y Growth Comparison, 2022 to 2033 Figure 48: Canada Market Share Analysis (%) by Material, 2022 & 2033 Figure 49: Canada Market Share Analysis (%) Indication, 2022 & 2033 Figure 50: Canada Market Share Analysis (%) by Stent Design, 2022 & 2033 Figure 51: Canada Market Share Analysis (%) by Introducer Size, 2022 & 2033 Figure 52: Canada Market Share Analysis (%) by End User, 2022 & 2033 Figure 53: Latin America Market Share Analysis (%), By Material, 2023 (E) Figure 54: Latin America Market Share Analysis (%), By Indication, 2023 (E) Figure 55: Latin America Market Share Analysis (%), By Stent Design, 2023 (E) Figure 56: Latin America Market Share Analysis (%), By Introducer Size, 2023 (E) Figure 57: Latin America Market Share Analysis (%), By End User, 2023 (E) Figure 58: Latin America Market Share Analysis (%), By Country, 2023 (E) Figure 59: Latin America Market Value Analysis (US$ Million), 2018 to 2022 Figure 60: Latin America Market Value Forecast (US$ Million), 2023 to 2033 Figure 61: Latin America Market Attractiveness Analysis By Material, 2023 to 2033 Figure 62: Latin America Market Attractiveness Analysis By Indication, 2023 to 2033 Figure 63: Latin America Market Attractiveness Analysis By Stent Design, 2023 to 2033 Figure 64: Latin America Market Attractiveness Analysis By Introducer Size, 2023 to 2033 Figure 65: Latin America Market Attractiveness Analysis By End User, 2023 to 2033 Figure 66: Latin America Market Attractiveness Analysis By Country, 2023 to 2033 Figure 67: Brazil Market Value Proportion Analysis, 2022 Figure 68: Global Vs Brazil Y-o-Y Growth Comparison, 2022 to 2033 Figure 69: Brazil Market Share Analysis (%) by Material, 2022 & 2033 Figure 70: Brazil Market Share Analysis (%) Indication, 2022 & 2033 Figure 71: Brazil Market Share Analysis (%) by Stent Design, 2022 & 2033 Figure 72: Brazil Market Share Analysis (%) by Introducer Size, 2022 & 2033 Figure 73: Brazil Market Share Analysis (%) by End User, 2022 & 2033 Figure 74: Mexico Market Value Proportion Analysis, 2022 Figure 75: Global Vs Mexico Y-o-Y Growth Comparison, 2022 to 2033 Figure 76: Mexico Market Share Analysis (%) by Material, 2022 & 2033 Figure 77: Mexico Market Share Analysis (%) Indication, 2022 & 2033 Figure 78: Mexico Market Share Analysis (%) by Stent Design, 2022 & 2033 Figure 79: Mexico Market Share Analysis (%) by Introducer Size, 2022 & 2033 Figure 80: Mexico Market Share Analysis (%) by End User, 2022 & 2033 Figure 81: Argentina Market Value Proportion Analysis, 2022 Figure 82: Global Vs Argentina Y-o-Y Growth Comparison, 2022 to 2033 Figure 83: Argentina Market Share Analysis (%) by Material, 2022 & 2033 Figure 84: Argentina Market Share Analysis (%) Indication, 2022 & 2033 Figure 85: Argentina Market Share Analysis (%) by Stent Design, 2022 & 2033 Figure 86: Argentina Market Share Analysis (%) by Introducer Size, 2022 & 2033 Figure 87: Argentina Market Share Analysis (%) by End User, 2022 & 2033 Figure 88: East Asia Market Share Analysis (%), By Material, 2023 (E) Figure 89: East Asia Market Share Analysis (%), By Indication, 2023 (E) Figure 90: East Asia Market Share Analysis (%), By Stent Design, 2023 (E) Figure 91: East Asia Market Share Analysis (%), By Introducer Size, 2023 (E) Figure 92: East Asia Market Share Analysis (%), By End User, 2023 (E) Figure 93: East Asia Market Share Analysis (%), By Country, 2023 (E) Figure 94: East Asia Market Value Analysis (US$ Million), 2018 to 2022 Figure 95: East Asia Market Value Forecast (US$ Million), 2023 to 2033 Figure 96: East Asia Market Attractiveness Analysis By Material, 2023 to 2033 Figure 97: East Asia Market Attractiveness Analysis By Indication, 2023 to 2033 Figure 98: East Asia Market Attractiveness Analysis By Stent Design, 2023 to 2033 Figure 99: East Asia Market Attractiveness Analysis By Introducer Size, 2023 to 2033 Figure 100: East Asia Market Attractiveness Analysis By End User, 2023 to 2033 Figure 101: East Asia Market Attractiveness Analysis By Country, 2023 to 2033 Figure 102: China Market Value Proportion Analysis, 2022 Figure 103: Global Vs China Y-o-Y Growth Comparison, 2022 to 2033 Figure 104: China Market Share Analysis (%) by Material, 2022 & 2033 Figure 105: China Market Share Analysis (%) Indication, 2022 & 2033 Figure 106: China Market Share Analysis (%) by Stent Design, 2022 & 2033 Figure 107: China Market Share Analysis (%) by Introducer Size, 2022 & 2033 Figure 108: China Market Share Analysis (%) by End User, 2022 & 2033 Figure 109: Japan Market Value Proportion Analysis, 2022 Figure 110: Global Vs Japan Y-o-Y Growth Comparison, 2022 to 2033 Figure 111: Japan Market Share Analysis (%) by Material, 2022 & 2033 Figure 112: Japan Market Share Analysis (%) Indication, 2022 & 2033 Figure 113: Japan Market Share Analysis (%) by Stent Design, 2022 & 2033 Figure 114: Japan Market Share Analysis (%) by Introducer Size, 2022 & 2033 Figure 115: Japan Market Share Analysis (%) by End User, 2022 & 2033 Figure 116: South Korea Market Value Proportion Analysis, 2022 Figure 117: Global Vs South Korea Y-o-Y Growth Comparison, 2022 to 2033 Figure 118: South Korea Market Share Analysis (%) by Material, 2022 & 2033 Figure 119: South Korea Market Share Analysis (%) Indication, 2022 & 2033 Figure 120: South Korea Market Share Analysis (%) by Stent Design, 2022 & 2033 Figure 121: South Korea Market Share Analysis (%) by Introducer Size, 2022 & 2033 Figure 122: South Korea Market Share Analysis (%) by End User, 2022 & 2033 Figure 123: South Asia and Pacific Market Share Analysis (%), By Material, 2023 (E) Figure 124: South Asia and Pacific Market Share Analysis (%), By Indication, 2023 (E) Figure 125: South Asia and Pacific Market Share Analysis (%), By Stent Design, 2023 (E) Figure 126: South Asia and Pacific Market Share Analysis (%), By Introducer Size, 2023 (E) Figure 127: South Asia and Pacific Market Share Analysis (%), By End User, 2023 (E) Figure 128: South Asia and Pacific Market Share Analysis (%), By Country, 2023 (E) Figure 129: South Asia and Pacific Market Value Analysis (US$ Million), 2018 to 2022 Figure 130: South Asia and Pacific Market Value Forecast (US$ Million), 2023 to 2033 Figure 131: South Asia and Pacific Market Attractiveness Analysis By Material, 2023 to 2033 Figure 132: South Asia and Pacific Market Attractiveness Analysis By Indication, 2023 to 2033 Figure 133: South Asia and Pacific Market Attractiveness Analysis By Stent Design, 2023 to 2033 Figure 134: South Asia and Pacific Market Attractiveness Analysis By Introducer Size, 2023 to 2033 Figure 135: South Asia and Pacific Market Attractiveness Analysis By End User, 2023 to 2033 Figure 136: South Asia and Pacific Market Attractiveness Analysis By Country, 2023 to 2033 Figure 137: India Market Value Proportion Analysis, 2022 Figure 138: Global Vs India Y-o-Y Growth Comparison, 2022 to 2033 Figure 139: India Market Share Analysis (%) by Material, 2022 & 2033 Figure 140: India Market Share Analysis (%) Indication, 2022 & 2033 Figure 141: India Market Share Analysis (%) by Stent Design, 2022 & 2033 Figure 142: India Market Share Analysis (%) by Introducer Size, 2022 & 2033 Figure 143: India Market Share Analysis (%) by End User, 2022 & 2033 Figure 144: Indonesia Market Value Proportion Analysis, 2022 Figure 145: Global Vs Indonesia Y-o-Y Growth Comparison, 2022 to 2033 Figure 146: Indonesia Market Share Analysis (%) by Material, 2022 & 2033 Figure 147: Indonesia Market Share Analysis (%) Indication, 2022 & 2033 Figure 148: Indonesia Market Share Analysis (%) by Stent Design, 2022 & 2033 Figure 149: Indonesia Market Share Analysis (%) by Introducer Size, 2022 & 2033 Figure 150: Indonesia Market Share Analysis (%) by End User, 2022 & 2033 Figure 151: Thailand Market Value Proportion Analysis, 2022 Figure 152: Global Vs Thailand Y-o-Y Growth Comparison, 2022 to 2033 Figure 153: Thailand Market Share Analysis (%) by Material, 2022 & 2033 Figure 154: Thailand Market Share Analysis (%) Indication, 2022 & 2033 Figure 155: Thailand Market Share Analysis (%) by Stent Design, 2022 & 2033 Figure 156: Thailand Market Share Analysis (%) by Introducer Size, 2022 & 2033 Figure 157: Thailand Market Share Analysis (%) by End User, 2022 & 2033 Figure 158: Philippines Market Value Proportion Analysis, 2022 Figure 159: Global Vs Philippines Y-o-Y Growth Comparison, 2022 to 2033 Figure 160: Philippines Market Share Analysis (%) by Material, 2022 & 2033 Figure 161: Philippines Market Share Analysis (%) Indication, 2022 & 2033 Figure 162: Philippines Market Share Analysis (%) by Stent Design, 2022 & 2033 Figure 163: Philippines Market Share Analysis (%) by Introducer Size, 2022 & 2033 Figure 164: Philippines Market Share Analysis (%) by End User, 2022 & 2033 Figure 165: Malaysia Market Value Proportion Analysis, 2022 Figure 166: Global Vs Malaysia Y-o-Y Growth Comparison, 2022 to 2033 Figure 167: Malaysia Market Share Analysis (%) by Material, 2022 & 2033 Figure 168: Malaysia Market Share Analysis (%) Indication, 2022 & 2033 Figure 169: Malaysia Market Share Analysis (%) by Stent Design, 2022 & 2033 Figure 170: Malaysia Market Share Analysis (%) by Introducer Size, 2022 & 2033 Figure 171: Malaysia Market Share Analysis (%) by End User, 2022 & 2033 Figure 172: Vietnam Market Value Proportion Analysis, 2022 Figure 173: Global Vs Vietnam Y-o-Y Growth Comparison, 2022 to 2033 Figure 174: Vietnam Market Share Analysis (%) by Material, 2022 & 2033 Figure 175: Vietnam Market Share Analysis (%) Indication, 2022 & 2033 Figure 176: Vietnam Market Share Analysis (%) by Stent Design, 2022 & 2033 Figure 177: Vietnam Market Share Analysis (%) by Introducer Size, 2022 & 2033 Figure 178: Vietnam Market Share Analysis (%) by End User, 2022 & 2033 Figure 179: Australia and New Zealand Market Value Proportion Analysis, 2022 Figure 180: Global Vs Australia and New Zealand Y-o-Y Growth Comparison, 2022 to 2033 Figure 181: Australia and New Zealand Market Share Analysis (%) by Material, 2022 & 2033 Figure 182: Australia and New Zealand Market Share Analysis (%) Indication, 2022 & 2033 Figure 183: Australia and New Zealand Market Share Analysis (%) by Stent Design, 2022 & 2033 Figure 184: Australia and New Zealand Market Share Analysis (%) by Introducer Size, 2022 & 2033 Figure 185: Australia and New Zealand Market Share Analysis (%) by End User, 2022 & 2033 Figure 186: Western Europe Market Share Analysis (%), By Material, 2023 (E) Figure 187: Western Europe Market Share Analysis (%), By Indication, 2023 (E) Figure 188: Western Europe Market Share Analysis (%), By Stent Design, 2023 (E) Figure 189: Western Europe Market Share Analysis (%), By Introducer Size, 2023 (E) Figure 190: Western Europe Market Share Analysis (%), By End User, 2023 (E) Figure 191: Western Europe Market Share Analysis (%), By Country, 2023 (E) Figure 192: Western Europe Market Value Analysis (US$ Million), 2018 to 2022 Figure 193: Western Europe Market Value Forecast (US$ Million), 2023 to 2033 Figure 194: Western Europe Market Attractiveness Analysis By Material, 2023 to 2033 Figure 195: Western Europe Market Attractiveness Analysis By Indication, 2023 to 2033 Figure 196: Western Europe Market Attractiveness Analysis By Stent Design, 2023 to 2033 Figure 197: Western Europe Market Attractiveness Analysis By Introducer Size, 2023 to 2033 Figure 198: Western Europe Market Attractiveness Analysis By End User, 2023 to 2033 Figure 199: Western Europe Market Attractiveness Analysis By Country, 2023 to 2033 Figure 200: Germany Market Value Proportion Analysis, 2022 Figure 201: Global Vs Germany Y-o-Y Growth Comparison, 2022 to 2033 Figure 202: Germany Market Share Analysis (%) by Material, 2022 & 2033 Figure 203: Germany Market Share Analysis (%) Indication, 2022 & 2033 Figure 204: Germany Market Share Analysis (%) by Stent Design, 2022 & 2033 Figure 205: Germany Market Share Analysis (%) by Introducer Size, 2022 & 2033 Figure 206: Germany Market Share Analysis (%) by End User, 2022 & 2033 Figure 207: France Market Value Proportion Analysis, 2022 Figure 208: Global Vs France Y-o-Y Growth Comparison, 2022 to 2033 Figure 209: France Market Share Analysis (%) by Material, 2022 & 2033 Figure 210: France Market Share Analysis (%) Indication, 2022 & 2033 Figure 211: France Market Share Analysis (%) by Stent Design, 2022 & 2033 Figure 212: France Market Share Analysis (%) by Introducer Size, 2022 & 2033 Figure 213: France Market Share Analysis (%) by End User, 2022 & 2033 Figure 214: Spain Market Value Proportion Analysis, 2022 Figure 215: Global Vs Spain Y-o-Y Growth Comparison, 2022 to 2033 Figure 216: Spain Market Share Analysis (%) by Material, 2022 & 2033 Figure 217: Spain Market Share Analysis (%) Indication, 2022 & 2033 Figure 218: Spain Market Share Analysis (%) by Stent Design, 2022 & 2033 Figure 219: Spain Market Share Analysis (%) by Introducer Size, 2022 & 2033 Figure 220: Spain Market Share Analysis (%) by End User, 2022 & 2033 Figure 221: Italy Market Value Proportion Analysis, 2022 Figure 222: Global Vs Italy Y-o-Y Growth Comparison, 2022 to 2033 Figure 223: Italy Market Share Analysis (%) by Material, 2022 & 2033 Figure 224: Italy Market Share Analysis (%) Indication, 2022 & 2033 Figure 225: Italy Market Share Analysis (%) by Stent Design, 2022 & 2033 Figure 226: Italy Market Share Analysis (%) by Introducer Size, 2022 & 2033 Figure 227: Philippines Market Share Analysis (%) by End User, 2022 & 2033 Figure 228: BENELUX Market Value Proportion Analysis, 2022 Figure 229: Global Vs BENELUX Y-o-Y Growth Comparison, 2022 to 2033 Figure 230: BENELUX Market Share Analysis (%) by Material, 2022 & 2033 Figure 231: BENELUX Market Share Analysis (%) Indication, 2022 & 2033 Figure 232: BENELUX Market Share Analysis (%) by Stent Design, 2022 & 2033 Figure 233: BENELUX Market Share Analysis (%) by Introducer Size, 2022 & 2033 Figure 234: BENELUX Market Share Analysis (%) by End User, 2022 & 2033 Figure 235: Nordic Countries Market Value Proportion Analysis, 2022 Figure 236: Global Vs Nordic Countries Y-o-Y Growth Comparison, 2022 to 2033 Figure 237: Nordic Countries Market Share Analysis (%) by Material, 2022 & 2033 Figure 238: Nordic Countries Market Share Analysis (%) Indication, 2022 & 2033 Figure 239: Nordic Countries Market Share Analysis (%) by Stent Design, 2022 & 2033 Figure 240: Nordic Countries Market Share Analysis (%) by Introducer Size, 2022 & 2033 Figure 241: Nordic Countries Market Share Analysis (%) by End User, 2022 & 2033 Figure 242: United kingdom Market Value Proportion Analysis, 2022 Figure 243: Global Vs United kingdom Y-o-Y Growth Comparison, 2022 to 2033 Figure 244: United kingdom Market Share Analysis (%) by Material, 2022 & 2033 Figure 245: United kingdom Market Share Analysis (%) Indication, 2022 & 2033 Figure 246: United kingdom Market Share Analysis (%) by Stent Design, 2022 & 2033 Figure 247: United kingdom Market Share Analysis (%) by Introducer Size, 2022 & 2033 Figure 248: United kingdom Market Share Analysis (%) by End User, 2022 & 2033 Figure 249: Eastern Europe Market Share Analysis (%), By Material, 2023 (E) Figure 250: Eastern Europe Market Share Analysis (%), By Indication, 2023 (E) Figure 251: Eastern Europe Market Share Analysis (%), By Stent Design, 2023 (E) Figure 252: Eastern Europe Market Share Analysis (%), By Introducer Size, 2023 (E) Figure 253: Eastern Europe Market Share Analysis (%), By End User, 2023 (E) Figure 254: Eastern Europe Market Share Analysis (%), By Country, 2023 (E) Figure 255: Eastern Europe Market Value Analysis (US$ Million), 2018 to 2022 Figure 256: Eastern Europe Market Value Forecast (US$ Million), 2023 to 2033 Figure 257: Eastern Europe Market Attractiveness Analysis By Material, 2023 to 2033 Figure 258: Eastern Europe Market Attractiveness Analysis By Indication, 2023 to 2033 Figure 259: Eastern Europe Market Attractiveness Analysis By Stent Design, 2023 to 2033 Figure 260: Eastern Europe Market Attractiveness Analysis By Introducer Size, 2023 to 2033 Figure 261: Eastern Europe Market Attractiveness Analysis By End User, 2023 to 2033 Figure 262: Eastern Europe Market Attractiveness Analysis By Country, 2023 to 2033 Figure 263: Poland Market Value Proportion Analysis, 2022 Figure 264: Global Vs Poland Y-o-Y Growth Comparison, 2022 to 2033 Figure 265: Poland Market Share Analysis (%) by Material, 2022 & 2033 Figure 266: Poland Market Share Analysis (%) Indication, 2022 & 2033 Figure 267: Poland Market Share Analysis (%) by Stent Design, 2022 & 2033 Figure 268: Poland Market Share Analysis (%) by Introducer Size, 2022 & 2033 Figure 269: Poland Market Share Analysis (%) by End User, 2022 & 2033 Figure 270: Hungary Market Value Proportion Analysis, 2022 Figure 271: Global Vs Hungary Y-o-Y Growth Comparison, 2022 to 2033 Figure 272: Hungary Market Share Analysis (%) by Material, 2022 & 2033 Figure 273: Hungary Market Share Analysis (%) Indication, 2022 & 2033 Figure 274: Hungary Market Share Analysis (%) by Stent Design, 2022 & 2033 Figure 275: Hungary Market Share Analysis (%) by Introducer Size, 2022 & 2033 Figure 276: Hungary Market Share Analysis (%) by End User, 2022 & 2033 Figure 277: Romania Market Value Proportion Analysis, 2022 Figure 278: Global Vs Romania Y-o-Y Growth Comparison, 2022 to 2033 Figure 279: Romania Market Share Analysis (%) by Material, 2022 & 2033 Figure 280: Romania Market Share Analysis (%) Indication, 2022 & 2033 Figure 281: Romania Market Share Analysis (%) by Stent Design, 2022 & 2033 Figure 282: Romania Market Share Analysis (%) by Introducer Size, 2022 & 2033 Figure 283: Romania Market Share Analysis (%) by End User, 2022 & 2033 Figure 284: Czech Republic Market Value Proportion Analysis, 2022 Figure 285: Global Vs Czech Republic Y-o-Y Growth Comparison, 2022 to 2033 Figure 286: Czech Republic Market Share Analysis (%) by Material, 2022 & 2033 Figure 287: Czech Republic Market Share Analysis (%) Indication, 2022 & 2033 Figure 288: Czech Republic Market Share Analysis (%) by Stent Design, 2022 & 2033 Figure 289: Czech Republic Market Share Analysis (%) by Introducer Size, 2022 & 2033 Figure 290: Czech Republic Market Share Analysis (%) by End User, 2022 & 2033 Figure 291: Central Asia Market Share Analysis (%), By Material, 2023 (E) Figure 292: Central Asia Market Share Analysis (%), By Indication, 2023 (E) Figure 293: Central Asia Market Share Analysis (%), By, Stent Design 2023 (E) Figure 294: Central Asia Market Share Analysis (%), By, Introducer Size 2023 (E) Figure 295: Central Asia Market Share Analysis (%), By End User, 2023 (E) Figure 296: Central Asia Market Value Analysis (US$ Million), 2018 to 2022 Figure 297: Central Asia Market Value Forecast (US$ Million), 2023 to 2033 Figure 298: Central Asia Market Attractiveness Analysis By Material, 2023 to 2033 Figure 299: Central Asia Market Attractiveness Analysis By Indication, 2023 to 2033 Figure 300: Central Asia Market Attractiveness Analysis By Stent Design, 2023 to 2033 Figure 301: Central Asia Market Attractiveness Analysis By Introducer Size, 2023 to 2033 Figure 302: Central Asia Market Attractiveness Analysis By End User, 2023 to 2033 Figure 303: Russia & Belarus Market Share Analysis (%), By Material, 2023 (E) Figure 304: Russia & Belarus Market Share Analysis (%), By Indication, 2023 (E) Figure 305: Russia & Belarus Market Share Analysis (%), By, Stent Design 2023 (E) Figure 306: Russia & Belarus Market Share Analysis (%), By, Introducer Size 2023 (E) Figure 307: Russia & Belarus Market Share Analysis (%), By End User, 2023 (E) Figure 308: Russia & Belarus Market Value Analysis (US$ Million), 2018 to 2022 Figure 309: Russia & Belarus Market Value Forecast (US$ Million), 2023 to 2033 Figure 310: Russia & Belarus Market Attractiveness Analysis By Material, 2023 to 2033 Figure 311: Russia & Belarus Market Attractiveness Analysis By Indication, 2023 to 2033 Figure 312: Russia & Belarus Market Attractiveness Analysis By Stent Design, 2023 to 2033 Figure 313: Russia & Belarus Market Attractiveness Analysis By Introducer Size, 2023 to 2033 Figure 314: Russia & Belarus Market Attractiveness Analysis By End User, 2023 to 2033 Figure 315: Balkan & Baltic Countries Market Share Analysis (%), By Material, 2023 (E) Figure 316: Balkan & Baltic Countries Market Share Analysis (%), By Indication, 2023 (E) Figure 317: Balkan & Baltic Countries Market Share Analysis (%), By Stent Design, 2023 (E) Figure 318: Balkan & Baltic Countries Market Share Analysis (%), By Introducer Size, 2023 (E) Figure 319: Balkan & Baltic Countries Market Share Analysis (%), By End User, 2023 (E) Figure 320: Balkan & Baltic Countries Market Value Analysis (US$ Million), 2018 to 2022 Figure 321: Balkan & Baltic Countries Market Value Forecast (US$ Million), 2023 to 2033 Figure 322: Balkan & Baltic Countries Market Attractiveness Analysis By Material, 2023 to 2033 Figure 323: Balkan & Baltic Countries Market Attractiveness Analysis By Indication, 2023 to 2033 Figure 324: Balkan & Baltic Countries Market Attractiveness Analysis By Stent Design, 2023 to 2033 Figure 325: Balkan & Baltic Countries Market Attractiveness Analysis By Introducer Size, 2023 to 2033 Figure 326: Balkan & Baltic Countries Market Attractiveness Analysis By End User, 2023 to 2033 Figure 327: Middle East and Africa Market Share Analysis (%), By Material, 2023 (E) Figure 328: Middle East and Africa Market Share Analysis (%), By Indication, 2023 (E) Figure 329: Middle East and Africa Market Share Analysis (%), By Stent Design, 2023 (E) Figure 330: Middle East and Africa Market Share Analysis (%), By Introducer Size, 2023 (E) Figure 331: Middle East and Africa Market Share Analysis (%), By End User, 2023 (E) Figure 332: Middle East and Africa Market Share Analysis (%), By Country, 2023 (E) Figure 333: Middle East and Africa Market Value Analysis (US$ Million), 2018 to 2022 Figure 334: Middle East and Africa Market Value Forecast (US$ Million), 2023 to 2033 Figure 335: Middle East and Africa Market Attractiveness Analysis By Material, 2023 to 2033 Figure 336: Middle East and Africa Market Attractiveness Analysis By Indication, 2023 to 2033 Figure 337: Middle East and Africa Market Attractiveness Analysis By Stent Design, 2023 to 2033 Figure 338: Middle East and Africa Market Attractiveness Analysis By Introducer Size, 2023 to 2033 Figure 339: Middle East and Africa Market Attractiveness Analysis By End User, 2023 to 2033 Figure 340: Middle East and Africa Market Attractiveness Analysis By Country, 2023 to 2033 Figure 341: GCC Countries Market Value Proportion Analysis, 2022 Figure 342: Global Vs GCC Countries Y-o-Y Growth Comparison, 2022 to 2033 Figure 343: GCC Countries Market Share Analysis (%) by Material, 2022 & 2033 Figure 344: GCC Countries Market Share Analysis (%) Indication, 2022 & 2033 Figure 345: GCC Countries Applicators Market Share Analysis (%) by Stent Design, 2022 & 2033 Figure 346: GCC Countries Applicators Market Share Analysis (%) by Introducer Size, 2022 & 2033 Figure 347: GCC Countries Market Share Analysis (%) by End User, 2022 & 2033 Figure 348: Kingdom of Saudi Arabia Market Value Proportion Analysis, 2022 Figure 349: Global Vs Kingdom of Saudi Arabia Y-o-Y Growth Comparison, 2022 to 2033 Figure 350: Kingdom of Saudi Arabia Market Share Analysis (%) by Material, 2022 & 2033 Figure 351: Kingdom of Saudi Arabia Market Share Analysis (%) Indication, 2022 & 2033 Figure 352: Kingdom of Saudi Arabia Applicators Market Share Analysis (%) by Stent Design, 2022 & 2033 Figure 353: Kingdom of Saudi Arabia Applicators Market Share Analysis (%) by Introducer Size, 2022 & 2033 Figure 354: Kingdom of Saudi Arabia Market Share Analysis (%) by End User, 2022 & 2033 Figure 355: Türkiye Market Value Proportion Analysis, 2022 Figure 356: Global Vs Türkiye Y-o-Y Growth Comparison, 2022 to 2033 Figure 357: Türkiye Market Share Analysis (%) by Material, 2022 & 2033 Figure 358: Türkiye Market Share Analysis (%) Indication, 2022 & 2033 Figure 359: Türkiye Applicators Market Share Analysis (%) by Stent Design, 2022 & 2033 Figure 360: Türkiye Applicators Market Share Analysis (%) by Introducer Size, 2022 & 2033 Figure 361: Türkiye Market Share Analysis (%) by End User, 2022 & 2033 Figure 362: Northern Africa Market Value Proportion Analysis, 2022 Figure 363: Global Vs Northern Africa Y-o-Y Growth Comparison, 2022 to 2033 Figure 364: Northern Africa Market Share Analysis (%) by Material, 2022 & 2033 Figure 365: Northern Africa Market Share Analysis (%) Indication, 2022 & 2033 Figure 366: Northern Africa Applicators Market Share Analysis (%) by Stent Design, 2022 & 2033 Figure 367: Northern Africa Applicators Market Share Analysis (%) by Introducer Size, 2022 & 2033 Figure 368: Northern Africa Market Share Analysis (%) by End User, 2022 & 2033 Figure 369: South Africa Market Value Proportion Analysis, 2022 Figure 370: Global Vs South Africa Y-o-Y Growth Comparison, 2022 to 2033 Figure 371: South Africa Market Share Analysis (%) by Material, 2022 & 2033 Figure 372: Market Share Analysis (%) Indication, 2022 & 2033 Figure 373: South Africa Applicators Market Share Analysis (%) by Stent Design, 2022 & 2033 Figure 374: South Africa Applicators Market Share Analysis (%) by Introducer Size, 2022 & 2033 Figure 375: South Africa Market Share Analysis (%) by End User, 2022 & 2033 Figure 376: Israel Market Value Proportion Analysis, 2022 Figure 377: Global Vs Israel Y-o-Y Growth Comparison, 2022 to 2033 Figure 378: Israel Market Share Analysis (%) by Material, 2022 & 2033 Figure 379: Israel Market Share Analysis (%) Indication, 2022 & 2033 Figure 380: Israel Applicators Market Share Analysis (%) by Stent Design, 2022 & 2033 Figure 381: Israel Applicators Market Share Analysis (%) by Introducer Size, 2022 & 2033 Figure 382: Israel Market Share Analysis (%) by End User, 2022 & 2033
Recommendations
Explore Healthcare Insights
View Reports