Reports

- Global Locations -

Headquarters

Future Market Insights, Inc.

Christiana Corporate, 200
Continental Drive, Suite 401,
Newark, Delaware - 19713,
United States

T: +1-845-579-5705

Americas

Future Market Insights, Inc.

616 Corporate Way, Suite 2-9018,
Valley Cottage, NY 10989, United States

T: +1-347-918-3531

MEA

Future Market Insights

1602-6 Jumeirah Bay X2 Tower, Plot No: JLT-PH2-X2A,
Jumeirah Lakes Towers, Dubai,
United Arab Emirates

Europe

Future Market Insights

3rd Floor, 207 Regent Street,
W1B 3HH London
United Kingdom

T: + 44 (0) 20 8123 9659
D: +44 (0) 20 3287 4268

Asia Pacific

Future Market Insights

IndiaLand Global Tech Park, Unit UG-1, Behind Grand HighStreet, Phase 1, Hinjawadi, MH, Pune – 411057, India

Intravenous Iron Drugs Market Snapshot (2022 to 2032)

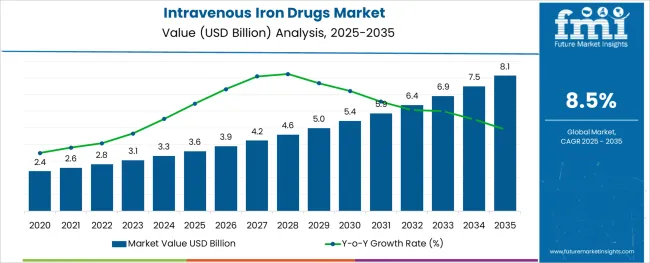
Newly-released Intravenous Iron Drugs market analysis report by Future Market Insights shows that global sales of the Intravenous Iron Drugs Market in 2021 were held at US$ 2.6 billion. With 8.5%, the projected market growth from 2022 to 2032 is expected to be higher than the historical growth.

The Intravenous Iron Drugs Market is projected to witness an absolute dollar opportunity of US$ 3.5 billion. The prevalence of chronic kidney disease (CKD), Inflammatory Bowel Disease (IBD), and cancer have increased the demand for intravenous iron medicines for the treatment of subsequent Iron Deficiency Anaemia.

Attribute Details
Global Intravenous Iron Drugs Market (2022) US$ 2.8 billion
Global Intravenous Iron Drugs Market (2032) US$ 6.3 billion
Global Intravenous Iron Drugs Market CAGR (2022 to 2032) 8.5%
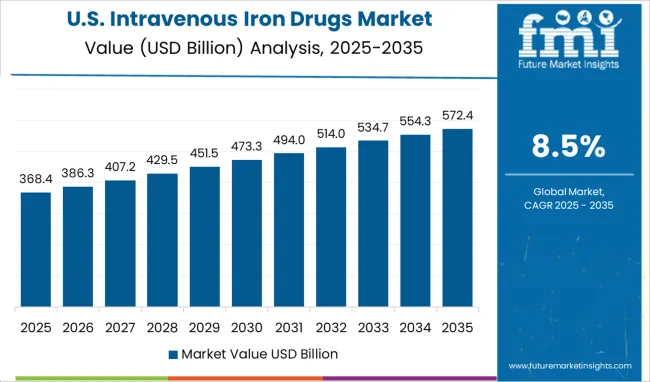
USA Intravenous Iron Drugs Market (2022) US$ 922.7 million
Key Companies Profiled
  • Vifor Pharma Management Ltd.
  • AMAG Pharmaceuticals
  • Daiichi Sankyo Company, Ltd.
  • Sanofi S.A.
  • Pharmacosmos A/S
  • Shield Therapeutics Plc
  • AbbVie Inc.
  • Nippon Shinyaku Co. Ltd.

Don't pay for what you don't need

Customize your report by selecting specific countries or regions and save 30%!

Revenue of Intravenous Iron Drugs Market from 2017 to 2021 Compared to Demand Outlook for 2022 to 2032

As per the Intravenous Iron Drugs market research by Future Market Insights - a market research and competitive intelligence provider, historically, from 2017 to 2021, the market value of the Intravenous Iron Drugs Market increased at around 8.1% CAGR, wherein, the region North America held a significant share in the global market.

Iron is a component of haemoglobin, which transports oxygen in the blood and also allows for the creation of red blood cells. Anaemia is a diagnosed condition in which an individual is lacking in the body's iron needs. Anaemia symptoms include weariness and loss of energy, unusually quick heartbeat when exercising, difficulties concentrating, pale skin and dizziness, sleeplessness, and cramping.

According to a recent survey done by the Vitamin and Mineral Nutrition Information System (VMNIS), around 40% of mothers and children in poor nations are anaemic. As a result, the market is expected to grow at a CAGR of 8.5% over the next ten years.

Anaemia is one of the most frequent blood illnesses nowadays. Anaemia affects an estimated 3 million people in the United States, according to the National Heart, Lung, and Blood Institute. The rising incidence of target illnesses such as rheumatoid arthritis, autoimmune diseases, renal issues, cancer, liver disorders, thyroid diseases, and inflammatory bowel disease is a significant factor driving the expansion of the intravenous iron medication market.

What will be the growth prospects of the Intravenous Iron Drugs Market?

As per National Kidney Foundation, the two primary causes of CKD are diabetes and hypertension. Also, according to the report, the chronic renal disease affects approximately 10% of the worldwide population, with over 2 million people needing dialysis on a daily basis. The bulk of all these people is often observed in nations such as Italy, the United States, Germany, Japan, and Brazil.

A significant number of people who have the disease are unaware of it until severe symptoms appear. The frequency of chronic kidney disease is expected to rise in developing economies such as India and China, implying an increase in the elderly population in the future years. With the increasing incidence of these disorders, there is a greater demand for intravenous iron medicines.

One of the biggest disadvantages of oral iron medications is the possibility of significant side effects. Digestive issues such as stomach pains, constipation, lack of appetite, nausea, and vomiting are common side effects of oral iron medications. Convulsions, shallow or quick breathing, exhaustion or weakness, fatigue, pale complexion, and bluish skin or fingernails can all result from an overdose of oral iron medications.

Intravenous iron medications, on the other hand, have been demonstrated to promote iron intake by the body, allowing Erythropoiesis-stimulating Agents (ESAs) to act more effectively in lowering anemic conditions. Other benefits of intravenous iron medications include heart health preservation and the potential to be utilized by dialysis patients, particularly those undergoing hemodialysis. These negative effects are thus expected to assist the changeover to intravenous iron medications, boosting their use during the projection period.
Sabyasachi Ghosh
Sabyasachi Ghosh

Principal Consultant

Talk to Analyst

Find your sweet spots for generating winning opportunities in this market.

Which Region is projected to Offer the Largest Opportunity for Intravenous Iron Drugs Market?

The market in Asia Pacific is expected to swell at a significant pace of 8.6% from 2022 to 2032. This may be ascribed to the availability of prominent players in the Asia Pacific, as well as the strengthening of healthcare infrastructure with the growing government efforts. Furthermore, the prevalence of IDA in rising economies such as China and India has aided industry expansion.

Besides, the market in Europe is anticipated to increase significantly throughout the forecast year as a result of the growing research and commercialization of new products, the acceptance of advanced medications, and the region's rising incidence of malignancy.
Country-wise Analysis

The USA Intravenous Iron Drugs Market Analysis

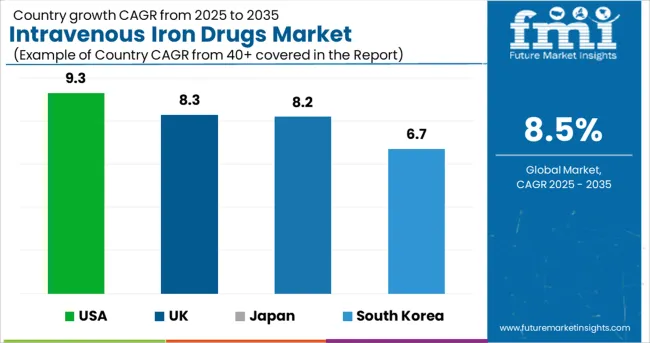
The United States dominated the North American Intravenous Iron Drugs Market, which is expected to reach US$ 2.2 billion by 2032 and will increase at a CAGR of 9.3% CAGR during the forecast period. The reimbursement and technological advancement facilities are advantageous factors for market growth in the United States.

The growing geriatric population is a key driver of market expansion in the country. According to USA Census Bureau projections, the number of Americans aged 65 and up is expected to grow from 52 million in 2018 to nearly 95 million by 2060. Furthermore, the share of people aged 65 and up is expected to rise from 16% to 23%.

Its dominance is also due to the region's rising rates of cancer, chronic renal disease, and gastrointestinal ailments. Furthermore, an increase in awareness of women's health and a surge in the frequency of celiac disease are the other factors boosting the market in the country.

The United Kingdom Intravenous Iron Drugs Market Analysis

The market for intravenous iron drugs in the United Kingdom stood at US$ 115 million in 2021. The market in the country is projected to swell at a CAGR of 8.2% during the forecast period to reach a valuation of US$ 278 million by 2032. The market in the country is expected to register an absolute dollar opportunity of US$ 151 million from 2022 to 2032.

Japan Intravenous Iron Drugs Market Analysis

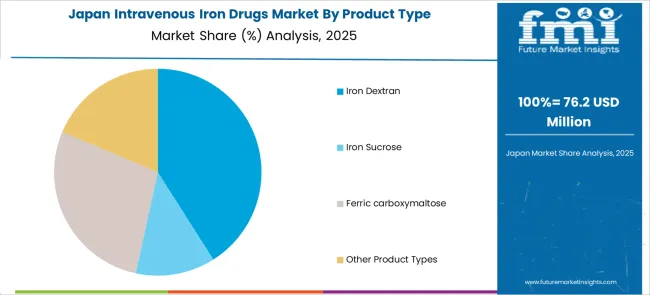
The market in Japan is likely to expand with an absolute dollar opportunity of US$ 128 million from 2022 to 2032. The market in the country is expected to reach a valuation of US$ 233 million by 2032 growing at a CAGR of 8.2% during the forecast period.
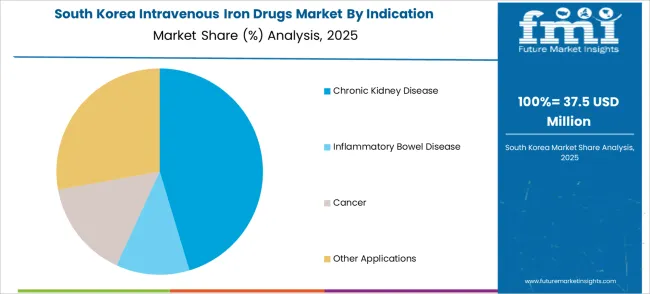
South Korea Intravenous Iron Drugs Market Analysis

In South Korea, the market is projected to reach a valuation of US$ 127 million by 2032, growing from US$ 66 million in 2022. With an absolute dollar opportunity of US$ 61 million, the market in the country is expected to register a CAGR of 6.7% during the forecast period.

Get the data you need at a Fraction of the cost

Personalize your report by choosing insights you need
and save 40%!

Category-wise Insights

Which Application offers the Highest Opportunity to the Intravenous Iron Drugs Market?

In 2020, the market for intravenous iron drugs led the market for intravenous medicines for chronic kidney disease, accounting for 30% of the total in 2021. This large market may be due to the fact that chronic kidney disease (CKD) and intravenous iron therapies are intensively used by CKD patients. IDA is a prevalent complication in CKD patients. It is uncommon in the early stages of renal illness; nevertheless, it happens as the disease progresses and kidney function declines.

Anaemia is caused by a decrease in the amount of Red Blood Cells (RBCs) in CKD patients. The growth in CKD cases has resulted in a large increase in the number of IDA patients. The conventional therapy for people with dialysis and non-dialysis-related CKD is intravenous iron. Dialysis is used to treat anaemia and end-stage renal failure.

Due to the increasing incidence of cancer and the consequent increase in the number of IDA cases, the market revenue through cancer application is expected to grow at the fastest CAGR throughout the projection period.

IDA affects a considerable proportion of cancer patients. Blood cancer, bone cancer, cervical cancer, colon cancer, and prostate cancer are all common cancers associated with anaemia. According to the NCBI, lung and breast cancers have the highest rate of anaemia among solid tumours. Hematologic cancers, such as leukaemia, lymphoma, and multiple myeloma, create abnormal blood cells, which weaken the immune system and cause anaemia. Chemotherapy and radiation therapy are two cancer therapies that cause anaemia in individuals.
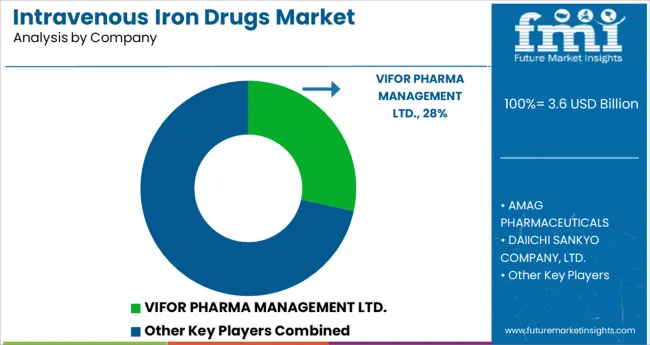
Competitive Analysis

Some of the key players in the global Intravenous Iron Drugs market include Vifor Pharma Management Ltd.; AMAG Pharmaceuticals; Daiichi Sankyo Company, Ltd.; Sanofi S.A.; Pharmacosmos A/S; Shield Therapeutics Plc; AbbVie Inc., Vifor Pharma Management Ltd.; AMAG Pharmaceuticals; Daiichi Sankyo Company, Ltd.; Sanofi S.A.; Pharmacosmos A/S; and Shield Therapeutics Plc among others.

Some of the recent developments in the Intravenous Iron Drugs Market are:

  • In April 2018, AMAG Pharmaceuticals got FDA clearance for a supplementary new drug application for ferumoxytol injection to cover all eligible people with iron-deficiency anemia (IDA) who cannot tolerate or do not respond to oral iron.
  • In May 2019, Rockwell Medical, Inc. filed a New Drug Application (NDA) to the United States Food and Drug Administration (FDA) for the Intravenous (I.V.) version of Triferic.
  • In September 2020, Daiichi Sankyo announced the formation of its wholly-owned subsidiary Daiichi Sankyo Vietnam Company Limited. This program was launched in order to strengthen the company's Asian business platform.

Market Segments Covered in Intravenous Iron Drugs Industry Analysis

By Product Type:

  • Iron Dextran
  • Iron Sucrose
  • Ferric carboxymaltose
  • Other Product Types

By Indication:

  • Chronic Kidney Disease
  • Inflammatory Bowel Disease
  • Cancer
  • Other Applications

By Region:

  • North America
  • Latin America
  • Europe
  • APAC
  • Middle East and Africa (MEA)

Frequently Asked Questions

What is the current worth of the Intravenous Iron Drugs market?

The global market is worth more than US$ 2.6 billion at present.

What is the sales forecast for the Intravenous Iron Drugs market?

The value of the Intravenous Iron Drugs Market is projected to increase at a CAGR of around 8.5% from 2022 to 2032.

What was the last 5 year’s market CAGR?

The value of the Intravenous Iron Drugs Market increased at a CAGR of around 8.1% from 2017 to 2021.

Which are the top 5 countries driving demand for Intravenous Iron Drugs?

The top 5 countries driving demand for the Intravenous Iron Drugs market are the USA, China, the United Kingdom, Japan, and South Korea.

At what percentage is sales of Intravenous Iron Drugs going to register growth in USA?

The USA market for Intravenous Iron Drugs is projected to expand at a CAGR of around 9.3% from 2022 to 2032.

Which are the key companies for Intravenous Iron Drugs?

The key companies in intravenous iron drugs market are AMAG Pharmaceuticals, AbbVie Inc., Daiichi Sankyo Company Ltd., Sanofi, and Vifor Pharma Management Ltd.

Table of Content

1. Executive Summary | Intravenous Iron Drugs Market

    1.1. Global Market Outlook

    1.2. Summary of Statistics

    1.3. Key Market Characteristics & Attributes

    1.4. Analysis and Recommendations

2. Market Overview

    2.1. Market Coverage / Taxonomy

    2.2. Market Definition / Scope / Limitations

3. Market Risks and Trends Assessment 

    3.1. Risk Assessment

        3.1.1. COVID-19 Crisis and Impact on Demand

        3.1.2. COVID-19 Impact Benchmark with Previous Crisis

        3.1.3. Impact on Market Value (US$ million)

        3.1.4. Assessment by Key Countries

        3.1.5. Assessment by Key Market Segments

        3.1.6. Action Points and Recommendation for Suppliers

    3.2. Key Trends Impacting the Market

    3.3. Formulation and Product Development Trends

4. Market Background and Foundation Data Points 

    4.1. Global Market (US$ million)

    4.2. Market Opportunity Assessment (US$ million)

        4.2.1. Total Available Market

        4.2.2. Serviceable Addressable Market

        4.2.3. Serviceable Obtainable Market

    4.3. Market Scenario Forecast

        4.3.1. Demand in optimistic Scenario

        4.3.2. Demand in Likely Scenario

        4.3.3. Demand in Conservative Scenario

    4.4. Investment Feasibility Analysis

        4.4.1. Investment in Established Markets

            4.4.1.1. In Short Term

            4.4.1.2. In Long Term

        4.4.2. Investment in Emerging Markets

            4.4.2.1. In Short Term

            4.4.2.2. In Long Term

    4.5. Forecast Factors - Relevance & Impact

        4.5.1. Top Companies Historical Growth

        4.5.2. Global Market Growth

        4.5.3. Adoption Rate, By Country

    4.6. Market Dynamics

        4.6.1. Market Driving Factors and Impact Assessment

        4.6.2. Prominent Market Challenges and Impact Assessment

        4.6.3. Market Opportunities

        4.6.4. Prominent Trends in the Global Market & Their Impact Assessment

5. Key Success Factors 

    5.1. Manufacturers’ Focus on Low Penetration High Growth Markets

    5.2. Banking on with Segments High Incremental Opportunity

    5.3. Peer Benchmarking

6. Global Market Demand Analysis 2017 to 2021 and Forecast, 2022 to 2032

    6.1. Historical Market Analysis, 2017 to 2021

    6.2. Current and Future Market Projections, 2022 to 2032

    6.3. Y-o-Y Growth Trend Analysis

7. Global Market Value Analysis 2017 to 2021 and Forecast, 2022 to 2032

    7.1. Historical Market Value (US$ million) Analysis, 2017 to 2021

    7.2. Current and Future Market Value (US$ million) Projections, 2022 to 2032

        7.2.1. Y-o-Y Growth Trend Analysis

        7.2.2. Absolute $ Opportunity Analysis

8. Global Market Analysis 2017 to 2021 and Forecast 2022 to 2032, By Product Type

    8.1. Introduction / Key Findings

    8.2. Historical Market Size (US$ million) Analysis By Product Type, 2017 to 2021

    8.3. Current and Future Market Size (US$ million) Analysis and Forecast By Product Type, 2022 to 2032

        8.3.1. Iron Dextran

        8.3.2. Iron Sucrose

        8.3.3. Ferric carboxymaltose

        8.3.4. Other Product Types

    8.4. Market Attractiveness Analysis By Product Type

9. Global Market Analysis 2017 to 2021 and Forecast 2022 to 2032, By Indication

    9.1. Introduction / Key Findings

    9.2. Historical Market Size (US$ million) Analysis By Indication, 2017 to 2021

    9.3. Current and Future Market Size (US$ million) Analysis and Forecast By Indication, 2022 to 2032

        9.3.1. Chronic Kidney Disease

        9.3.2. Inflammatory Bowel Disease

        9.3.3. Cancer

        9.3.4. Other Applications

    9.4. Market Attractiveness Analysis By Indication

10. Global Market Analysis 2017 to 2021 and Forecast 2022 to 2032, By Region

    10.1. Introduction

    10.2. Historical Market Size (US$ million) Analysis By Region, 2017 to 2021

    10.3. Current Market Size (US$ million) & Analysis and Forecast By Region, 2022 to 2032

        10.3.1. North America

        10.3.2. Latin America

        10.3.3. Europe

        10.3.4. Asia Pacific

        10.3.5. Middle East and Africa (MEA)

    10.4. Market Attractiveness Analysis By Region

11. North America Market Analysis 2017 to 2021 and Forecast 2022 to 2032

    11.1. Introduction

    11.2. Pricing Analysis

    11.3. Historical Market Value (US$ million) Trend Analysis By Market Taxonomy, 2017 to 2021

    11.4. Market Value (US$ million) & Forecast By Market Taxonomy, 2022 to 2032

        11.4.1. By Country

            11.4.1.1. The USA

            11.4.1.2. Canada

            11.4.1.3. Rest of North America

        11.4.2. By Product Type

        11.4.3. By Indication

    11.5. Market Attractiveness Analysis

        11.5.1. By Country

        11.5.2. By Product Type

        11.5.3. By Indication

12. Latin America Market Analysis 2017 to 2021 and Forecast 2022 to 2032

    12.1. Introduction

    12.2. Pricing Analysis

    12.3. Historical Market Value (US$ million) Trend Analysis By Market Taxonomy, 2017 to 2021

    12.4. Market Value (US$ million) & Forecast By Market Taxonomy, 2022 to 2032

        12.4.1. By Country

            12.4.1.1. Brazil

            12.4.1.2. Mexico

            12.4.1.3. Rest of Latin America

        12.4.2. By Product Type

        12.4.3. By Indication

    12.5. Market Attractiveness Analysis

        12.5.1. By Country

        12.5.2. By Product Type

        12.5.3. By Indication

13. Europe Market Analysis 2017 to 2021 and Forecast 2022 to 2032

    13.1. Introduction

    13.2. Pricing Analysis

    13.3. Historical Market Value (US$ million) Trend Analysis By Market Taxonomy, 2017 to 2021

    13.4. Market Value (US$ million) & Forecast By Market Taxonomy, 2022 to 2032

        13.4.1. By Country

            13.4.1.1. Germany

            13.4.1.2. France

            13.4.1.3. The United Kingdom

            13.4.1.4. Italy

            13.4.1.5. Benelux

            13.4.1.6. Nordic Countries

            13.4.1.7. Rest of Europe

        13.4.2. By Product Type

        13.4.3. By Indication

    13.5. Market Attractiveness Analysis

        13.5.1. By Country

        13.5.2. By Product Type

        13.5.3. By Indication

14. Asia Pacific Market Analysis 2017 to 2021 and Forecast 2022 to 2032

    14.1. Introduction

    14.2. Pricing Analysis

    14.3. Historical Market Value (US$ million) Trend Analysis By Market Taxonomy, 2017 to 2021

    14.4. Market Value (US$ million) & Forecast By Market Taxonomy, 2022 to 2032

        14.4.1. By Country

            14.4.1.1. China

            14.4.1.2. Japan

            14.4.1.3. South Korea

            14.4.1.4. Rest of Asia Pacific

        14.4.2. By Product Type

        14.4.3. By Indication

    14.5. Market Attractiveness Analysis

        14.5.1. By Country

        14.5.2. By Product Type

        14.5.3. By Indication

15. Middle East and Africa Market Analysis 2017 to 2021 and Forecast 2022 to 2032

    15.1. Introduction

    15.2. Pricing Analysis

    15.3. Historical Market Value (US$ million) Trend Analysis By Market Taxonomy, 2017 to 2021

    15.4. Market Value (US$ million) & Forecast By Market Taxonomy, 2022 to 2032

        15.4.1. By Country

            15.4.1.1. GCC Countries

            15.4.1.2. South Africa

            15.4.1.3. Turkey

            15.4.1.4. Rest of Middle East and Africa

        15.4.2. By Product Type

        15.4.3. By Indication

    15.5. Market Attractiveness Analysis

        15.5.1. By Country

        15.5.2. By Product Type

        15.5.3. By Indication

16. Key Countries Market Analysis 2017 to 2021 and Forecast 2022 to 2032

    16.1. Introduction

        16.1.1. Market Value Proportion Analysis, By Key Countries

        16.1.2. Global Vs. Country Growth Comparison

    16.2. US Market Analysis

        16.2.1. Value Proportion Analysis by Market Taxonomy

        16.2.2. Value & Analysis and Forecast by Market Taxonomy, 2017 to 2032

            16.2.2.1. By Product Type

            16.2.2.2. By Indication

    16.3. Canada Market Analysis

        16.3.1. Value Proportion Analysis by Market Taxonomy

        16.3.2. Value & Analysis and Forecast by Market Taxonomy, 2017 to 2032

            16.3.2.1. By Product Type

            16.3.2.2. By Indication

    16.4. Mexico Market Analysis

        16.4.1. Value Proportion Analysis by Market Taxonomy

        16.4.2. Value & Analysis and Forecast by Market Taxonomy, 2017 to 2032

            16.4.2.1. By Product Type

            16.4.2.2. By Indication

    16.5. Brazil Market Analysis

        16.5.1. Value Proportion Analysis by Market Taxonomy

        16.5.2. Value & Analysis and Forecast by Market Taxonomy, 2017 to 2032

            16.5.2.1. By Product Type

            16.5.2.2. By Indication

    16.6. Germany Market Analysis

        16.6.1. Value Proportion Analysis by Market Taxonomy

        16.6.2. Value & Analysis and Forecast by Market Taxonomy, 2017 to 2032

            16.6.2.1. By Product Type

            16.6.2.2. By Indication

    16.7. France Market Analysis

        16.7.1. Value Proportion Analysis by Market Taxonomy

        16.7.2. Value & Analysis and Forecast by Market Taxonomy, 2017 to 2032

            16.7.2.1. By Product Type

            16.7.2.2. By Indication

    16.8. Italy Market Analysis

        16.8.1. Value Proportion Analysis by Market Taxonomy

        16.8.2. Value & Analysis and Forecast by Market Taxonomy, 2017 to 2032

            16.8.2.1. By Product Type

            16.8.2.2. By Indication

    16.9. BENELUX Market Analysis

        16.9.1. Value Proportion Analysis by Market Taxonomy

        16.9.2. Value & Analysis and Forecast by Market Taxonomy, 2017 to 2032

            16.9.2.1. By Product Type

            16.9.2.2. By Indication

    16.10. The United Kingdom Market Analysis

        16.10.1. Value Proportion Analysis by Market Taxonomy

        16.10.2. Value & Analysis and Forecast by Market Taxonomy, 2017 to 2032

            16.10.2.1. By Product Type

            16.10.2.2. By Indication

    16.11. Nordic Countries Market Analysis

        16.11.1. Value Proportion Analysis by Market Taxonomy

        16.11.2. Value & Analysis and Forecast by Market Taxonomy, 2017 to 2032

            16.11.2.1. By Product Type

            16.11.2.2. By Indication

    16.12. China Market Analysis

        16.12.1. Value Proportion Analysis by Market Taxonomy

        16.12.2. Value & Analysis and Forecast by Market Taxonomy, 2017 to 2032

            16.12.2.1. By Product Type

            16.12.2.2. By Indication

    16.13. Japan Market Analysis

        16.13.1. Value Proportion Analysis by Market Taxonomy

        16.13.2. Value & Analysis and Forecast by Market Taxonomy, 2017 to 2032

            16.13.2.1. By Product Type

            16.13.2.2. By Indication

    16.14. South Korea Market Analysis

        16.14.1. Value Proportion Analysis by Market Taxonomy

        16.14.2. Value & Analysis and Forecast by Market Taxonomy, 2017 to 2032

            16.14.2.1. By Product Type

            16.14.2.2. By Indication

    16.15. GCC Countries Market Analysis

        16.15.1. Value Proportion Analysis by Market Taxonomy

        16.15.2. Value & Analysis and Forecast by Market Taxonomy, 2017 to 2032

            16.15.2.1. By Product Type

            16.15.2.2. By Indication

    16.16. South Africa Market Analysis

        16.16.1. Value Proportion Analysis by Market Taxonomy

        16.16.2. Value & Analysis and Forecast by Market Taxonomy, 2017 to 2032

            16.16.2.1. By Product Type

            16.16.2.2. By Indication

    16.17. Turkey Market Analysis

        16.17.1. Value Proportion Analysis by Market Taxonomy

        16.17.2. Value & Analysis and Forecast by Market Taxonomy, 2017 to 2032

            16.17.2.1. By Product Type

            16.17.2.2. By Indication

        16.17.3. Competition Landscape and Player Concentration in the Country

17. Market Structure Analysis

    17.1. Market Analysis by Tier of Companies

    17.2. Market Concentration

    17.3. Market Share Analysis of Top Players

    17.4. Market Presence Analysis

        17.4.1. By Regional footprint of Players

        17.4.2. Product footprint by Players

18. Competition Analysis

    18.1. Competition Dashboard

    18.2. Competition Benchmarking

    18.3. Competition Deep Dive

        18.3.1. VIFOR PHARMA MANAGEMENT LTD.

            18.3.1.1. Overview

            18.3.1.2. Product Portfolio

            18.3.1.3. Sales Footprint

            18.3.1.4. Strategy Overview

        18.3.2. AMAG PHARMACEUTICALS

            18.3.2.1. Overview

            18.3.2.2. Product Portfolio

            18.3.2.3. Sales Footprint

            18.3.2.4. Strategy Overview

        18.3.3. DAIICHI SANKYO COMPANY, LTD.

            18.3.3.1. Overview

            18.3.3.2. Product Portfolio

            18.3.3.3. Sales Footprint

            18.3.3.4. Strategy Overview

        18.3.4. SANOFI S.A.

            18.3.4.1. Overview

            18.3.4.2. Product Portfolio

            18.3.4.3. Sales Footprint

            18.3.4.4. Strategy Overview

        18.3.5. PHARMACOSMOS A/S

            18.3.5.1. Overview

            18.3.5.2. Product Portfolio

            18.3.5.3. Sales Footprint

            18.3.5.4. Strategy Overview

        18.3.6. SHIELD THERAPEUTICS PLC

            18.3.6.1. Overview

            18.3.6.2. Product Portfolio

            18.3.6.3. Sales Footprint

            18.3.6.4. Strategy Overview

        18.3.7. ABBVIE INC.

            18.3.7.1. Overview

            18.3.7.2. Product Portfolio

            18.3.7.3. Sales Footprint

            18.3.7.4. Strategy Overview

19. Assumptions and Acronyms Used

20. Research Methodology

Don't pay for what you don't need

Customize your report by selecting specific countries or regions and save 30%!

List of Tables

Table 1: Global Market Value (US$ million), By Product Type, 2017 to 2021

Table 2: Global Market Value (US$ million), By Product Type, 2022 to 2032

Table 3: Global Market Value (US$ million), By Indication, 2017 to 2021

Table 4: Global Market Value (US$ million), By Indication, 2022 to 2032

Table 5: Global Market, By Region, 2017 to 2021

Table 6: Global Market, By Region, 2022 to 2032

Table 7: North America Market Value (US$ million), By Product Type, 2017 to 2021

Table 8: North America Market Value (US$ million), By Product Type, 2022 to 2032

Table 9: North America Market Value (US$ million), By Indication, 2017 to 2021

Table 10: North America Market Value (US$ million), By Indication, 2022 to 2032

Table 11: North America Market, By Country, 2017 to 2021

Table 12: North America Market, By Country, 2022 to 2032

Table 13: Latin America Market Value (US$ million), By Product Type, 2017 to 2021

Table 14: Latin America Market Value (US$ million), By Product Type, 2022 to 2032

Table 15: Latin America Market Value (US$ million), By Indication, 2017 to 2021

Table 16: Latin America Market Value (US$ million), By Indication, 2022 to 2032

Table 17: Latin America Market, By Country, 2017 to 2021

Table 18: Latin America Market, By Country, 2022 to 2032

Table 19: Europe Market Value (US$ million), By Product Type, 2017 to 2021

Table 20: Europe Market Value (US$ million), By Product Type, 2022 to 2032

Table 21: Europe Market Value (US$ million), By Indication, 2017 to 2021

Table 22: Europe Market Value (US$ million), By Indication, 2022 to 2032

Table 23: Europe Market, By Country, 2017 to 2021

Table 24: Europe Market, By Country, 2022 to 2032

Table 25: Asia Pacific Market Value (US$ million), By Product Type, 2017 to 2021

Table 26: Asia Pacific Market Value (US$ million), By Product Type, 2022 to 2032

Table 27: Asia Pacific Market Value (US$ million), By Indication, 2017 to 2021

Table 28: Asia Pacific Market Value (US$ million), By Indication, 2022 to 2032

Table 29: Asia Pacific Market, By Country, 2017 to 2021

Table 30: Asia Pacific Market, By Country, 2022 to 2032

Table 31: MEA Market Value (US$ million), By Product Type, 2017 to 2021

Table 32: MEA Market Value (US$ million), By Product Type, 2022 to 2032

Table 33: MEA Market Value (US$ million), By Indication, 2017 to 2021

Table 34: MEA Market Value (US$ million), By Indication, 2022 to 2032

Table 35: MEA Market, By Country, 2017 to 2021

Table 36: MEA Market, By Country, 2022 to 2032

Table 37: Global Market Incremental $ Opportunity, By Product Type, 2017 to 2021

Table 38: Global Market Incremental $ Opportunity, By Indication, 2022 to 2032

Table 39: Global Market Incremental $ Opportunity, By Region, 2022 to 2032

Table 40: North America Market Incremental $ Opportunity, By Product Type, 2017 to 2021

Table 41: North America Market Incremental $ Opportunity, By Indication, 2022 to 2032

Table 42: North America Market Incremental $ Opportunity, By Country, 2022 to 2032

Table 43: Latin America Market Incremental $ Opportunity, By Product Type, 2017 to 2021

Table 44: Latin America Market Incremental $ Opportunity, By Indication, 2022 to 2032

Table 45: Latin America Market Incremental $ Opportunity, By Country, 2022 to 2032

Table 46: Europe Market Incremental $ Opportunity, By Product Type, 2017 to 2021

Table 47: Europe Market Incremental $ Opportunity, By Indication, 2022 to 2032

Table 48: Europe Market Incremental $ Opportunity, By Country, 2022 - 2032

Table 49: Asia Pacific Market Incremental $ Opportunity, By Product Type, 2017 to 2021

Table 50: Asia Pacific Market Incremental $ Opportunity, By Indication, 2022 to 2032

Table 51: Asia Pacific Market Incremental $ Opportunity, By Country, 2022 to 2032

Table 52: MEA Market Incremental $ Opportunity, By Product Type, 2017 to 2021

Table 53: MEA Market Incremental $ Opportunity, By Indication, 2022 to 2032

Table 54: MEA Market Incremental $ Opportunity, By Country, 2022 to 2032
Sabyasachi Ghosh
Sabyasachi Ghosh

Principal Consultant

Talk to Analyst

Find your sweet spots for generating winning opportunities in this market.

List of Charts

Figure 1: Global Market Value (US$ million) and Year-on-Year Growth, 2017 to 2032

Figure 2: Global Market Absolute $ Historical Gain (2017 to 2021) and Opportunity (2022 to 2032), US$ million

Figure 3: Global Market Share, By Product Type, 2022 to 2032

Figure 4: Global Market Y-o-Y Growth Projections, By Product Type - 2022 to 2032

Figure 5: Global Market Attractiveness Index, By Product Type - 2022 to 2032

Figure 6: Global Market Share, By Indication, 2022 to 2032

Figure 7: Global Market Y-o-Y Growth Projections, By Indication - 2022 to 2032

Figure 8: Global Market Attractiveness Index, By Indication - 2022 to 2032

Figure 9: Global Market Share, By Region, 2022 to 2032

Figure 10: Global Market Y-o-Y Growth Projections, By Region - 2022 to 2032

Figure 11: Global Market Attractiveness Index, By Region - 2022 to 2032

Figure 12: North America Market Value (US$ million) and Year-on-Year Growth, 2017 to 2032

Figure 13: North America Market Absolute $ Opportunity Historical (2017 to 2021) and Forecast Period (2022 to 2032), US$ million

Figure 14: North America Market Share, By Product Type, 2022 to 2032

Figure 15: North America Market Y-o-Y Growth Projections, By Product Type - 2022 to 2032

Figure 16: North America Market Attractiveness Index, By Product Type - 2022 to 2032

Figure 17: North America Market Share, By Indication, 2022 to 2032

Figure 18: North America Market Y-o-Y Growth Projections, By Indication - 2022 to 2032

Figure 19: North America Market Attractiveness Index, By Indication - 2022 to 2032

Figure 20: North America Market Share, By Country, 2022 to 2032

Figure 21: North America Market Y-o-Y Growth Projections, By Country - 2022 to 2032

Figure 22: North America Market Attractiveness Index, By Country - 2022 to 2032

Figure 23: Latin America Market Value (US$ million) and Year-on-Year Growth, 2017 to 2032

Figure 24: Latin America Market Absolute $ Opportunity Historical (2017 to 2021) and Forecast Period (2022 to 2032), US$ million

Figure 25: Latin America Market Share, By Product Type, 2022 to 2032

Figure 26: Latin America Market Y-o-Y Growth Projections, By Product Type - 2022 to 2032

Figure 27: Latin America Market Attractiveness Index, By Product Type - 2022 to 2032

Figure 28: Latin America Market Share, By Indication, 2022 to 2032

Figure 29: Latin America Market Y-o-Y Growth Projections, By Indication - 2022 to 2032

Figure 30: Latin America Market Attractiveness Index, By Indication - 2022 to 2032

Figure 31: Latin America Market Share, By Country, 2022 to 2032

Figure 32: Latin America Market Y-o-Y Growth Projections, By Country - 2022 to 2032

Figure 33: Latin America Market Attractiveness Index, By Country - 2022 to 2032

Figure 34: Europe Market Value (US$ million) and Year-on-Year Growth, 2017 to 2032

Figure 35: Europe Market Absolute $ Opportunity Historical (2017 to 2021) and Forecast Period (2022 to 2032), US$ million

Figure 36: Europe Market Share, By Product Type, 2022 to 2032

Figure 37: Europe Market Y-o-Y Growth Projections, By Product Type - 2022 to 2032

Figure 38: Europe Market Attractiveness Index, By Product Type - 2022 to 2032

Figure 39: Europe Market Share, By Indication, 2022 to 2032

Figure 40: Europe Market Y-o-Y Growth Projections, By Indication - 2022 to 2032

Figure 41: Europe Market Attractiveness Index, By Indication - 2022 to 2032

Figure 42: Europe Market Share, By Country, 2022 to 2032

Figure 43: Europe Market Y-o-Y Growth Projections, By Country - 2022 to 2032

Figure 44: Europe Market Attractiveness Index, By Country - 2022 to 2032

Figure 45: MEA Market Value (US$ million) and Year-on-Year Growth, 2017 to 2032

Figure 46: MEA Market Absolute $ Opportunity Historical (2017 to 2021) and Forecast Period (2022 to 2032), US$ million

Figure 47: MEA Market Share, By Product Type, 2022 to 2032

Figure 48: MEA Market Y-o-Y Growth Projections, By Product Type - 2022 to 2032

Figure 49: MEA Market Attractiveness Index, By Product Type - 2022 to 2032

Figure 50: MEA Market Share, By Indication, 2022 to 2032

Figure 51: MEA Market Y-o-Y Growth Projections, By Indication - 2022 to 2032

Figure 52: MEA Market Attractiveness Index, By Indication - 2022 to 2032

Figure 53: MEA Market Share, By Country, 2022 to 2032

Figure 54: MEA Market Y-o-Y Growth Projections, By Country - 2022 to 2032

Figure 55: MEA Market Attractiveness Index, By Country - 2022 to 2032

Figure 56: Asia Pacific Market Value (US$ million) and Year-on-Year Growth, 2017 to 2032

Figure 57: Asia Pacific Market Absolute $ Opportunity Historical (2017 to 2021) and Forecast Period (2022 to 2032), US$ million

Figure 58: Asia Pacific Market Share, By Product Type, 2022 to 2032

Figure 59: Asia Pacific Market Y-o-Y Growth Projections, By Product Type - 2022 to 2032

Figure 60: Asia Pacific Market Attractiveness Index, By Product Type - 2022 to 2032

Figure 61: Asia Pacific Market Share, By Indication, 2022 to 2032

Figure 62: Asia Pacific Market Y-o-Y Growth Projections, By Indication - 2022 to 2032

Figure 63: Asia Pacific Market Attractiveness Index, By Indication - 2022 to 2032

Figure 64: Asia Pacific Market Share, By Country, 2022 to 2032

Figure 65: Asia Pacific Market Y-o-Y Growth Projections, By Country - 2022 to 2032

Figure 66: Asia Pacific Market Attractiveness Index, By Country - 2022 to 2032

Figure 67: USA Market Value (US$ million) and Forecast, 2022 to 2032

Figure 68: USA Market Share, By Product Type, 2021

Figure 69: USA Market Share, By Indication, 2021

Figure 70: Canada Market Value (US$ million) and Forecast, 2022 to 2032

Figure 71: Canada Market Share, By Product Type, 2021

Figure 72: Canada Market Share, By Indication, 2021

Figure 73: Brazil Market Value (US$ million) and Forecast, 2022 to 2032

Figure 74: Brazil Market Share, By Product Type, 2021

Figure 75: Brazil Market Share, By Indication, 2021

Figure 76: Mexico Market Value (US$ million) and Forecast, 2022 to 2032

Figure 77: Mexico Market Share, By Product Type, 2021

Figure 78: Mexico Market Share, By Indication, 2021

Figure 79: Germany Market Value (US$ million) and Forecast, 2022 to 2032

Figure 80: Germany Market Share, By Product Type, 2021

Figure 81: Germany Market Share, By Indication, 2021

Figure 82: The United Kingdom Market Value (US$ million) and Forecast, 2022 to 2032

Figure 83: The United Kingdom Market Share, By Product Type, 2021

Figure 84: The United Kingdom Market Share, By Indication, 2021

Figure 85: France Market Value (US$ million) and Forecast, 2022 to 2032

Figure 86: France Market Share, By Product Type, 2021

Figure 87: France Market Share, By Indication, 2021

Figure 88: Italy Market Value (US$ million) and Forecast, 2022 to 2032

Figure 89: Italy Market Share, By Product Type, 2021

Figure 90: Italy Market Share, By Indication, 2021

Figure 91: BENELUX Market Value (US$ million) and Forecast, 2022 to 2032

Figure 92: BENELUX Market Share, By Product Type, 2021

Figure 93: BENELUX Market Share, By Indication, 2021

Figure 94: Nordic Countries Market Value (US$ million) and Forecast, 2022 to 2032

Figure 95: Nordic Countries Market Share, By Product Type, 2021

Figure 96: Nordic Countries Market Share, By Indication, 2021

Figure 97: China Market Value (US$ million) and Forecast, 2022 to 2032

Figure 98: China Market Share, By Product Type, 2021

Figure 99: China Market Share, By Indication, 2021

Figure 100: Japan Market Value (US$ million) and Forecast, 2022 to 2032

Figure 101: Japan Market Share, By Product Type, 2021

Figure 102: Japan Market Share, By Indication, 2021

Figure 103: South Korea Market Value (US$ million) and Forecast, 2022 to 2032

Figure 104: South Korea Market Share, By Product Type, 2021

Figure 105: South Korea Market Share, By Indication, 2021

Figure 106: GCC Countries Market Value (US$ million) and Forecast, 2022 to 2032

Figure 107: GCC Countries Market Share, By Product Type, 2021

Figure 108: GCC Countries Market Share, By Indication, 2021

Figure 109: South Africa Market Value (US$ million) and Forecast, 2022 to 2032

Figure 110: South Africa Market Share, By Product Type, 2021

Figure 111: South Africa Market Share, By Indication, 2021

Figure 112: Turkey Market Value (US$ million) and Forecast, 2022 to 2032

Figure 113: Turkey Market Share, By Product Type, 2021

Figure 114: Turkey Market Share, By Indication, 2021

Recommendations

Healthcare

Injectable Drug Market

Published : March 2024

Healthcare

General Anesthesia Drugs Market

Published : September 2023

Healthcare

Inhalation And Nasal Spray Generic Drugs Market

Published : November 2022

Healthcare

Antimetabolite Drugs Market

Published : September 2022

Explore Healthcare Insights

View Reports

Intravenous Iron Drugs Market