Reports

- Global Locations -

Headquarters

Future Market Insights, Inc.

Christiana Corporate, 200
Continental Drive, Suite 401,
Newark, Delaware - 19713,
United States

T: +1-845-579-5705

Americas

Future Market Insights, Inc.

616 Corporate Way, Suite 2-9018,
Valley Cottage, NY 10989, United States

T: +1-347-918-3531

MEA

Future Market Insights

1602-6 Jumeirah Bay X2 Tower, Plot No: JLT-PH2-X2A,
Jumeirah Lakes Towers, Dubai,
United Arab Emirates

Europe

Future Market Insights

3rd Floor, 207 Regent Street,
W1B 3HH London
United Kingdom

T: + 44 (0) 20 8123 9659
D: +44 (0) 20 3287 4268

Asia Pacific

Future Market Insights

IndiaLand Global Tech Park, Unit UG-1, Behind Grand HighStreet, Phase 1, Hinjawadi, MH, Pune – 411057, India

Environmental Test Chambers Market Outlook (2023 to 2033)

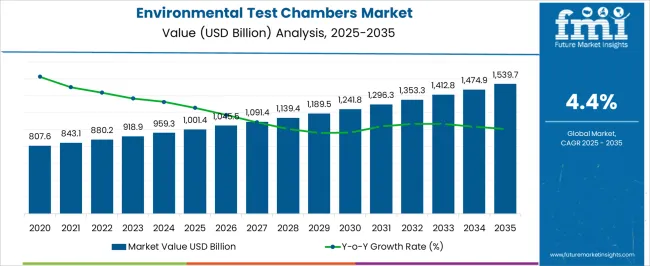
The environmental test chambers market share is likely to be worth US$ 915.3 million in 2023. The demand for environmental test chambers is registering an average growth pace with an estimated CAGR of 4.6% from 2023 to 2033. Due to the growing number of standards governing product quality in various industries, environmental test chamber manufacturers are likely to receive revenue potential as high as US$ 1,435.1 million by 2033.

Drivers in the Environmental Test Chambers Industry:

  • Stringent regulations: Increasing demand for compliance testing and product safety assurance to meet industry standards.
  • Technological advancements: Adoption of advanced testing equipment and software for improved accuracy and efficiency.
  • Growing need for reliability: Companies focus on testing product durability, performance, and quality to build customer trust.
  • Evolving industry requirements: Changing environmental conditions and product complexities drive the need for comprehensive testing.
  • Market expansion: Demand from various sectors like automotive, electronics, and pharmaceuticals fuels industry growth.

Challenges for Companies/Manufacturers in the Environmental Test Chambers Industry:

  • High equipment costs: Investing in advanced test chambers and specialized equipment poses financial challenges, especially for smaller companies.
  • Customization demands: Meeting diverse testing requirements and creating tailored solutions within budget constraints.
  • Technical expertise: The industry requires skilled personnel to operate and maintain complex testing systems.
  • Rapid technological advancements: Keeping up with evolving technologies and staying updated with industry trends.
  • Intense competition: Competing with established players and differentiating offerings in a crowded market.

Investment Opportunities in the Environmental Test Chambers Industry:

  • Research and development: Investing in new technologies and innovative solutions to improve testing capabilities.
  • Expansion into emerging sectors: Capitalizing on the growth of industries like renewable energy and electric vehicles.
  • Global market penetration: Exploring international markets with increasing environmental regulations and demand for quality testing.
  • Collaborations and partnerships: Forming strategic alliances with industry players, research institutions, and regulatory bodies.
  • After-sales services: Providing comprehensive support and maintenance services to enhance customer satisfaction.

Latest Trends in the Environmental Test Chambers Industry:

  • Smart testing solutions: Integration of IoT, automation, and real-time data analysis for advanced testing capabilities.
  • Sustainable practices: Focus on energy efficiency, reduced waste, and environmentally friendly materials in test chamber design.
  • Remote monitoring and control: Utilizing remote access and connectivity for real-time monitoring and management of test chambers.
  • Simulation accuracy: Advancements in simulation technology to replicate complex environmental conditions accurately.
  • Customized testing solutions: Offering tailored testing options to meet specific industry requirements and product specifications.

The environmental test chambers industry growth is likely to be aided by constant technology advancements and stringent regulatory criteria. The demand for environmental test chambers is rapidly increasing due to the requirement to ensure optimal quality of end-use products and monitor the effects of various stress factors

According to FMI's latest study on the environmental test chambers market, new trends are supporting the growth as they have evolved from simple analog chambers controlled by dials to advanced digital chambers controlled by programmable controllers.

With greater technology and newer refrigerants, these environmental test chambers have progressed dramatically in recent years. As a result, the sales of environmental test chambers are anticipated to rise rapidly during the forecast period.

Furthermore, manufacturers have continually concentrated on producing better, bigger, and faster chambers capable of performing testing on a wide range of products over the years. This factor is further anticipated to boost the market demand for environmental test chambers from 2023 to 2033.

The innovation in environmental test chambers surfaces with the rising use of handheld devices, and the sales of environmental test chambers with faster ramp rates and better safety features are anticipated to grow immensely, thus resulting in the high growth potential of the environmental test chambers industry.

Attributes Details
Environmental Test Chambers Market CAGR 4.6%
Environmental Test Chambers Market Size (2023) US$ 915.3 million
Environmental Test Chambers Market Share (2033) US$ 1,435.1 million

Don't pay for what you don't need

Customize your report by selecting specific countries or regions and save 30%!

What are the Key Environmental Test Chambers Market Dynamics?

Environmental chambers are made up of environmental testing equipment that is utilized in a variety of testing jobs, such as research and development, prototype evaluation, production testing, reliability testing, failure analysis, accelerated stress testing, and other jobs that require environmental simulation. As a result, the sales of environmental test chambers are predicted to grow.

Furthermore, the demand for environmental test chambers is projected to rise as they simulate the circumstances to which machinery, materials, gadgets, or components may be subjected in the real world.

Driving factors in the environmental test chambers industry include an increase in the number of regulations in industries such as aerospace and military, and automotive, as well as a growing demand for environmental test chambers to monitor the effects of various stress factors and supportive government initiatives.

Government restrictions and lockdown measures, as well as the temporary stoppage of operations in the automotive, aerospace, and electronics sectors, had a negative impact on the environmental test chambers industry size. Furthermore, in the current market outlook, shorter product lifecycles and rapidly changing testing requirements are the primary limitations of the market, which are having a negative impact on the growth of the target market share.

Comparative View of Adjacent Environmental Test Chambers Industry

Environmental Test Chambers Market:

Attributes Environmental Test Chambers Market
CAGR (2023 to 2033) 3%
Market Value (2033) US$ 1,435.1 million
Growth Factor The adoption of environmental test chambers is likely to be boosted by strong demand across key industry verticals.
Opportunity COVID-19 has created significant opportunities for the market in healthcare and pharmaceutical applications.
Key Trends Environment test chambers are used to test items, including medications, vaccinations, and blood samples that must be kept at specific temperatures.

Smart Climate Control Market:

Attributes Smart Climate Control Market
CAGR (2023 to 2033) 17.21%
Market Value (2033) US$ 11.5 billion
Growth Factor Across the globe, customer willingness to adopt energy-efficient solutions and safety devices and design healthy houses has improved dramatically.
Opportunity With growing consumer purchasing power in both developed and emerging countries, consumer items and home appliances account for a significant portion of spending.
Key Trends Latest advancements in air purifiers, thermostats, and smart sensors are becoming increasingly popular among homeowners who want to incorporate health and safety devices into their houses.

Environmental Control Systems Market:

Attributes Environmental Control Systems Market
CAGR (2023 to 2033) 4.34%
Market Value (2033) US$ 850 million
Growth Factor The environmental control systems market is being driven by technological developments in environmental control systems and increased air traffic.
Opportunity Heat loads from various avionics functionality and environmental control system architectures provide lucrative opportunities.
Key Trends Growing consumer spending in both developed and emerging countries.

During the forecast period 2023 to 2033, the said market size is expected to grow at a faster rate. In the medium term, demand for environmental test chambers is anticipated to recover steadily, with an optimistic long-term growth forecast.

The core semiconductor industry is likely to be the primary driver boosting the sales of environmental test chambers. The electronics industry's demand for a controlled environment is driving target market growth.

The environmental test chambers are used in the electronics industry to test circuit boards, ICs, transducers, semiconductors, power supplies, storage drives, touch panels, electronic assemblies, surge protectors, fuses, switches/connectors, and other components.

The market share is also being fueled by the expansion of lithium-ion battery-operated devices, which are very susceptible to harsh climatic conditions. These are some of the future market trends promoting the demand for environmental test chambers during the forecast period.

Nikhil Kaitwade
Nikhil Kaitwade

Principal Consultant

Talk to Analyst

Find your sweet spots for generating winning opportunities in this market.

Which Segment Dominates the Environmental Test Chambers Market by Type?

Rising Demand for Temperature & Humidity Chambers Drives Market Growth

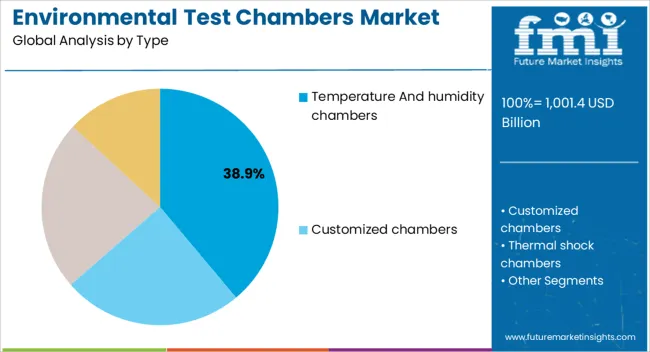
The dominating segment in the environmental test chambers industry is Temperature & Humidity Chambers, accounting for 56.2% of the market share in 2023. This segment is experiencing significant growth due to several key factors:

Temperature and humidity chambers play a crucial role in testing the reliability and performance of products in varying environmental conditions. Industries such as electronics, automotive, aerospace, and pharmaceuticals rely on these chambers to ensure their products can withstand diverse temperature and humidity settings.

With stringent quality control regulations and customer expectations for durable and high-quality products, manufacturers are investing in temperature and humidity chambers to test the impact of different environmental conditions on their products. This enables them to identify potential weaknesses and improve product performance.

Which Segment is Likely to Lead the Environmental Test Chambers Industry by Application?

Aerospace & Defense Sector Drives Growth in Environmental Test Chambers Industry

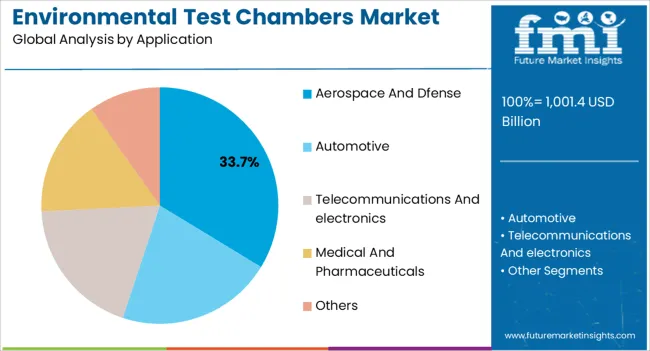
The dominating segment in the environmental test chambers industry based on application is the Aerospace & Defense sector, capturing a significant market share of 41.1% in 2023.

The Aerospace & Defense industry has stringent testing requirements to ensure the reliability, safety, and performance of components and systems used in aircraft, spacecraft, and defense equipment. Environmental test chambers play a vital role in simulating extreme conditions such as temperature, humidity, pressure, and vibration to assess the durability and functionality of these critical assets.

Aerospace and defense applications require components and systems that can withstand extreme environmental conditions encountered during flight, space missions, or combat situations. Environmental test chambers enable manufacturers to assess the performance and functionality of materials, electronics, sensors, and other critical components under realistic conditions, ensuring they meet stringent performance standards.

Get the data you need at a Fraction of the cost

Personalize your report by choosing insights you need
and save 40%!

What is the Regional Analysis for the Environmental Test Chambers Market?

Region United States Market
CAGR (2023 to 2033) 24.6%
Region Germany Market
CAGR (2023 to 2033) 6.1%
Region Japan Market
CAGR (2023 to 2033) 5.2%
Region Australia Market
CAGR (2023 to 2033) 0.4%

United States: Dominating the Market with Technological Innovations

The United States holds a significant value share of 24.6% in the global environmental test chambers industry. This dominance is driven by the region's focus on technological innovations. Companies in the United States are at the forefront of developing advanced test chamber solutions with cutting-edge features and capabilities. The market share reflects the country's strong presence in research and development, as well as its robust manufacturing infrastructure.

Germany: Leading in Quality and Precision

Germany has established itself as a leader in the environmental test chambers industry, capturing a value share of 6.1%. The country's renowned engineering expertise and emphasis on quality and precision contribute to its market success. German manufacturers are known for producing high-quality and reliable test chambers that meet the stringent standards of various industries. The emphasis on precision testing and adherence to international regulations further enhances Germany's position in the global market.

Japan: Focus on Innovation and Technological Advancements

With a value share of 5.2%, Japan plays a significant role in the environmental test chambers industry. The country's emphasis on innovation and technological advancements drives its market growth. Japanese companies are renowned for their continuous efforts to develop state-of-the-art test chamber solutions that meet the evolving needs of industries such as electronics, automotive, and aerospace. Japan's commitment to research and development, coupled with its strong manufacturing capabilities, enables it to maintain a competitive edge in the global market.

Australia: Niche Market with Growth Potential

While Australia's value share in the global environmental test chambers industry stands at 0.4%, the region presents unique growth opportunities. As an emerging market, Australia showcases the potential for expansion, driven by increasing awareness and demand for environmental testing across industries such as pharmaceuticals, food and beverages, and environmental monitoring. The country's focus on sustainability and stringent regulatory standards further contribute to the growth of the environmental test chambers industry in Australia.

Region China
Value CAGR (Latest Period) 5.4%
Region India
Value CAGR (Latest Period) 5.9%
Region United Kingdom
Value CAGR (Latest Period) 3.8%

China: Sustained Growth with Technological Advancements

China holds a significant market share in the environmental test chambers industry, boasting a value CAGR of 5.4%. The country's continuous focus on technological advancements and innovation has propelled its growth. Chinese manufacturers are investing in research and development to enhance the functionality and reliability of test chambers, catering to the diverse needs of industries like electronics, automotive, and aerospace. Furthermore, China's strong manufacturing capabilities and expanding domestic market contribute to its market dominance.

India: Accelerating Growth through Diverse Applications

India showcases a robust value CAGR of 5.9% in the global environmental test chambers industry. The country's growth is driven by the increasing adoption of environmental testing across various sectors, including pharmaceuticals, healthcare, and electronics. With rising awareness about product quality, safety regulations, and environmental sustainability, Indian manufacturers are focusing on providing technologically advanced and energy-efficient test chambers. The favorable government initiatives and investments in research and development further contribute to India's growth in the market.

United Kingdom: Precision and Compliance as Key Drivers

The United Kingdom holds a substantial market share in the environmental test chambers industry, with a value CAGR of 3.8%. The region's focus on precision testing, adherence to international standards, and stringent compliance requirements drive its market presence. UK-based manufacturers prioritize quality and accuracy in their test chambers, catering to industries like aerospace, defense, and automotive, which demand precise and reliable environmental testing solutions. The country's strong emphasis on research and development and collaborations with academic institutions contribute to its competitive advantage.
How is the Competition in the Environmental Test Chambers Industry?

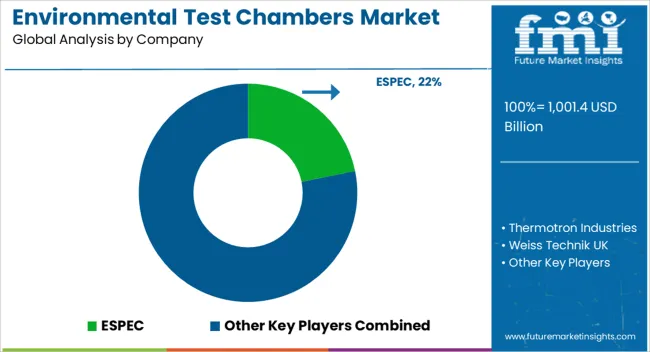
The environmental test chambers industry is highly competitive, with several prominent players driving innovation and market leadership.

Product launches, product approvals, and other organic growth tactics such as patents and events are being prioritized by a number of environmental test chamber companies.

Acquisitions and, partnerships & collaborations were two inorganic growth tactics seen in the environmental test chambers industry. These initiatives have paved the road for market players to expand their business and client base.

With the increased sales for environmental test chambers in the global industry, key players in the environmental test chambers industry are expected to benefit from attractive growth prospects in the future.

Key Players: Driving Innovation and Market Leadership

  • Thermotron Industries

With a rich history and a strong reputation, Thermotron Industries has established itself as a leading manufacturer of environmental test chambers. The company's focus on technological advancements, quality manufacturing, and exceptional customer service has helped it maintain a significant market share.

  • ESPEC North America Inc.

As a subsidiary of the ESPEC Corporation, ESPEC North America Inc. brings a global perspective to the environmental test chambers industry. The company offers a wide range of chambers with advanced features, catering to diverse industry requirements. ESPEC's commitment to continuous improvement and strong customer relationships sets it apart from competitors.

  • Weiss Technik UK.

Weiss Technik UK, part of the Weiss Technik Group, is a key player in the industry. The company specializes in providing custom-engineered solutions for environmental testing, leveraging its expertise in temperature, humidity, and climate simulation technologies. Its strong focus on research and development ensures cutting-edge solutions for customers.

Recent Developments in the Environmental Test Chambers Industry:

  • Weiss Technik stated in July 2021 that their Danfoss AKV electronic expansion valves for use in environmental test chambers had been successfully tested.
  • Binder Climatic Simulation and Photostability Test Chambers were recently introduced by one of the major manufacturers. This chamber features an RS-422 interface for transferring testing results to a PC for processing.
  • Weiss Umwelttechnik and Vötsch Industrietechnik, two well-known producers of environmental test chambers, joined in May 2021 to form Weiss Technik.

Key Players in the Environmental Test Chambers Industry

  • ESPEC
  • Thermotron Industries
  • Weiss Technik UK
  • Binder GmbH
  • Cincinnati Sub-Zero Products Inc.

Key Segments

By Type:

  • Temperature and humidity chambers
  • Customized chambers
  • Thermal shock chambers
  • Others (AGREE chambers, altitude chambers, HALT and HASS chambers, sand and dust chambers; salt and spray chambers; and remote conditioners)

By Application:

  • Aerospace and defense
  • Automotive
  • Telecommunications and electronics
  • Medical and pharmaceuticals
  • Others

By Region:

  • North America
  • Europe
  • Asia Pacific
  • Middle East & Africa
  • Latin America

Frequently Asked Questions

Which Application Holds Lucrative Opportunities?

Aerospace & defence sector holds high revenue potential.

Which Countries Dominate the Environmental Test Chambers Market?

The United States , Germany and Japan are estimated to dominate the global market.

What is the Growth Forecast for the Environmental Test Chambers Market?

The market is forecast to register a CAGR of 4.6% through 2033.

How is the Historical Performance of the Environmental Test Chambers Market?

During 2018 to 2022, the market registered a CAGR of 4.6%.

Which is the Top Trend in the Environmental Test Chambers Market?

The rising remote monitoring and smart testing solutions are the current market trends.

Table of Content

1. Executive Summary

    1.1. Global Market Outlook

    1.2. Demand-side Trends

    1.3. Supply-side Trends

    1.4. Technology Roadmap Analysis

    1.5. Analysis and Recommendations

2. Market Overview

    2.1. Market Coverage / Taxonomy

    2.2. Market Definition / Scope / Limitations

3. Market Background

    3.1. Market Dynamics

        3.1.1. Drivers

        3.1.2. Restraints

        3.1.3. Opportunity

        3.1.4. Trends

    3.2. Scenario Forecast

        3.2.1. Demand in Optimistic Scenario

        3.2.2. Demand in Likely Scenario

        3.2.3. Demand in Conservative Scenario

    3.3. Opportunity Map Analysis

    3.4. Product Life Cycle Analysis

    3.5. Supply Chain Analysis

        3.5.1. Supply Side Participants and their Roles

            3.5.1.1. Producers

            3.5.1.2. Mid-Level Participants (Traders/ Agents/ Brokers)

            3.5.1.3. Wholesalers and Distributors

        3.5.2. Value Added and Value Created at Node in the Supply Chain

        3.5.3. List of Raw Material Suppliers

        3.5.4. List of Existing and Potential Buyer’s

    3.6. Investment Feasibility Matrix

    3.7. Value Chain Analysis

        3.7.1. Profit Margin Analysis

        3.7.2. Wholesalers and Distributors

        3.7.3. Retailers

    3.8. PESTLE and Porter’s Analysis

    3.9. Regulatory Landscape

        3.9.1. By Key Regions

        3.9.2. By Key Countries

    3.10. Regional Parent Market Outlook

    3.11. Production and Consumption Statistics

    3.12. Import and Export Statistics

4. Global Market Analysis 2018 to 2022 and Forecast, 2023 to 2033

    4.1. Historical Market Size Value (US$ Million) & Volume (Units) Analysis, 2018 to 2022

    4.2. Current and Future Market Size Value (US$ Million) & Volume (Units) Projections, 2023 to 2033

        4.2.1. Y-o-Y Growth Trend Analysis

        4.2.2. Absolute $ Opportunity Analysis

5. Global Market Analysis 2018 to 2022 and Forecast 2023 to 2033, By Type

    5.1. Introduction / Key Findings

    5.2. Historical Market Size Value (US$ Million) & Volume (Units) Analysis By Type, 2018 to 2022

    5.3. Current and Future Market Size Value (US$ Million) & Volume (Units) Analysis and Forecast By Type, 2023 to 2033

        5.3.1. Temperature and humidity chambers

        5.3.2. Customized chambers

        5.3.3. Thermal shock chambers

        5.3.4. Others

    5.4. Y-o-Y Growth Trend Analysis By Type, 2018 to 2022

    5.5. Absolute $ Opportunity Analysis By Type, 2023 to 2033

6. Global Market Analysis 2018 to 2022 and Forecast 2023 to 2033, By Application

    6.1. Introduction / Key Findings

    6.2. Historical Market Size Value (US$ Million) & Volume (Units) Analysis By Application, 2018 to 2022

    6.3. Current and Future Market Size Value (US$ Million) & Volume (Units) Analysis and Forecast By Application, 2023 to 2033

        6.3.1. Aerospace and defence

        6.3.2. Automotive

        6.3.3. Telecommunications and electronics

        6.3.4. Medical and pharmaceuticals

        6.3.5. Others

    6.4. Y-o-Y Growth Trend Analysis By Application, 2018 to 2022

    6.5. Absolute $ Opportunity Analysis By Application, 2023 to 2033

7. Global Market Analysis 2018 to 2022 and Forecast 2023 to 2033, By Region

    7.1. Introduction

    7.2. Historical Market Size Value (US$ Million) & Volume (Units) Analysis By Region, 2018 to 2022

    7.3. Current Market Size Value (US$ Million) & Volume (Units) Analysis and Forecast By Region, 2023 to 2033

        7.3.1. North America

        7.3.2. Latin America

        7.3.3. Western Europe

        7.3.4. Eastern Europe

        7.3.5. South Asia and Pacific

        7.3.6. East Asia

        7.3.7. Middle East and Africa

    7.4. Market Attractiveness Analysis By Region

8. North America Market Analysis 2018 to 2022 and Forecast 2023 to 2033, By Country

    8.1. Historical Market Size Value (US$ Million) & Volume (Units) Trend Analysis By Market Taxonomy, 2018 to 2022

    8.2. Market Size Value (US$ Million) & Volume (Units) Forecast By Market Taxonomy, 2023 to 2033

        8.2.1. By Country

            8.2.1.1. U.S.

            8.2.1.2. Canada

        8.2.2. By Type

        8.2.3. By Application

    8.3. Market Attractiveness Analysis

        8.3.1. By Country

        8.3.2. By Type

        8.3.3. By Application

    8.4. Key Takeaways

9. Latin America Market Analysis 2018 to 2022 and Forecast 2023 to 2033, By Country

    9.1. Historical Market Size Value (US$ Million) & Volume (Units) Trend Analysis By Market Taxonomy, 2018 to 2022

    9.2. Market Size Value (US$ Million) & Volume (Units) Forecast By Market Taxonomy, 2023 to 2033

        9.2.1. By Country

            9.2.1.1. Brazil

            9.2.1.2. Mexico

            9.2.1.3. Rest of Latin America

        9.2.2. By Type

        9.2.3. By Application

    9.3. Market Attractiveness Analysis

        9.3.1. By Country

        9.3.2. By Type

        9.3.3. By Application

    9.4. Key Takeaways

10. Western Europe Market Analysis 2018 to 2022 and Forecast 2023 to 2033, By Country

    10.1. Historical Market Size Value (US$ Million) & Volume (Units) Trend Analysis By Market Taxonomy, 2018 to 2022

    10.2. Market Size Value (US$ Million) & Volume (Units) Forecast By Market Taxonomy, 2023 to 2033

        10.2.1. By Country

            10.2.1.1. Germany

            10.2.1.2. U.K.

            10.2.1.3. France

            10.2.1.4. Spain

            10.2.1.5. Italy

            10.2.1.6. Rest of Western Europe

        10.2.2. By Type

        10.2.3. By Application

    10.3. Market Attractiveness Analysis

        10.3.1. By Country

        10.3.2. By Type

        10.3.3. By Application

    10.4. Key Takeaways

11. Eastern Europe Market Analysis 2018 to 2022 and Forecast 2023 to 2033, By Country

    11.1. Historical Market Size Value (US$ Million) & Volume (Units) Trend Analysis By Market Taxonomy, 2018 to 2022

    11.2. Market Size Value (US$ Million) & Volume (Units) Forecast By Market Taxonomy, 2023 to 2033

        11.2.1. By Country

            11.2.1.1. Poland

            11.2.1.2. Russia

            11.2.1.3. Czech Republic

            11.2.1.4. Romania

            11.2.1.5. Rest of Eastern Europe

        11.2.2. By Type

        11.2.3. By Application

    11.3. Market Attractiveness Analysis

        11.3.1. By Country

        11.3.2. By Type

        11.3.3. By Application

    11.4. Key Takeaways

12. South Asia and Pacific Market Analysis 2018 to 2022 and Forecast 2023 to 2033, By Country

    12.1. Historical Market Size Value (US$ Million) & Volume (Units) Trend Analysis By Market Taxonomy, 2018 to 2022

    12.2. Market Size Value (US$ Million) & Volume (Units) Forecast By Market Taxonomy, 2023 to 2033

        12.2.1. By Country

            12.2.1.1. India

            12.2.1.2. Bangladesh

            12.2.1.3. Australia

            12.2.1.4. New Zealand

            12.2.1.5. Rest of South Asia and Pacific

        12.2.2. By Type

        12.2.3. By Application

    12.3. Market Attractiveness Analysis

        12.3.1. By Country

        12.3.2. By Type

        12.3.3. By Application

    12.4. Key Takeaways

13. East Asia Market Analysis 2018 to 2022 and Forecast 2023 to 2033, By Country

    13.1. Historical Market Size Value (US$ Million) & Volume (Units) Trend Analysis By Market Taxonomy, 2018 to 2022

    13.2. Market Size Value (US$ Million) & Volume (Units) Forecast By Market Taxonomy, 2023 to 2033

        13.2.1. By Country

            13.2.1.1. China

            13.2.1.2. Japan

            13.2.1.3. South Korea

        13.2.2. By Type

        13.2.3. By Application

    13.3. Market Attractiveness Analysis

        13.3.1. By Country

        13.3.2. By Type

        13.3.3. By Application

    13.4. Key Takeaways

14. Middle East and Africa Market Analysis 2018 to 2022 and Forecast 2023 to 2033, By Country

    14.1. Historical Market Size Value (US$ Million) & Volume (Units) Trend Analysis By Market Taxonomy, 2018 to 2022

    14.2. Market Size Value (US$ Million) & Volume (Units) Forecast By Market Taxonomy, 2023 to 2033

        14.2.1. By Country

            14.2.1.1. GCC Countries

            14.2.1.2. South Africa

            14.2.1.3. Israel

            14.2.1.4. Rest of MEA

        14.2.2. By Type

        14.2.3. By Application

    14.3. Market Attractiveness Analysis

        14.3.1. By Country

        14.3.2. By Type

        14.3.3. By Application

    14.4. Key Takeaways

15. Key Countries Market Analysis

    15.1. U.S.

        15.1.1. Pricing Analysis

        15.1.2. Market Share Analysis, 2022

            15.1.2.1. By Type

            15.1.2.2. By Application

    15.2. Canada

        15.2.1. Pricing Analysis

        15.2.2. Market Share Analysis, 2022

            15.2.2.1. By Type

            15.2.2.2. By Application

    15.3. Brazil

        15.3.1. Pricing Analysis

        15.3.2. Market Share Analysis, 2022

            15.3.2.1. By Type

            15.3.2.2. By Application

    15.4. Mexico

        15.4.1. Pricing Analysis

        15.4.2. Market Share Analysis, 2022

            15.4.2.1. By Type

            15.4.2.2. By Application

    15.5. Germany

        15.5.1. Pricing Analysis

        15.5.2. Market Share Analysis, 2022

            15.5.2.1. By Type

            15.5.2.2. By Application

    15.6. U.K.

        15.6.1. Pricing Analysis

        15.6.2. Market Share Analysis, 2022

            15.6.2.1. By Type

            15.6.2.2. By Application

    15.7. France

        15.7.1. Pricing Analysis

        15.7.2. Market Share Analysis, 2022

            15.7.2.1. By Type

            15.7.2.2. By Application

    15.8. Spain

        15.8.1. Pricing Analysis

        15.8.2. Market Share Analysis, 2022

            15.8.2.1. By Type

            15.8.2.2. By Application

    15.9. Italy

        15.9.1. Pricing Analysis

        15.9.2. Market Share Analysis, 2022

            15.9.2.1. By Type

            15.9.2.2. By Application

    15.10. Poland

        15.10.1. Pricing Analysis

        15.10.2. Market Share Analysis, 2022

            15.10.2.1. By Type

            15.10.2.2. By Application

    15.11. Russia

        15.11.1. Pricing Analysis

        15.11.2. Market Share Analysis, 2022

            15.11.2.1. By Type

            15.11.2.2. By Application

    15.12. Czech Republic

        15.12.1. Pricing Analysis

        15.12.2. Market Share Analysis, 2022

            15.12.2.1. By Type

            15.12.2.2. By Application

    15.13. Romania

        15.13.1. Pricing Analysis

        15.13.2. Market Share Analysis, 2022

            15.13.2.1. By Type

            15.13.2.2. By Application

    15.14. India

        15.14.1. Pricing Analysis

        15.14.2. Market Share Analysis, 2022

            15.14.2.1. By Type

            15.14.2.2. By Application

    15.15. Bangladesh

        15.15.1. Pricing Analysis

        15.15.2. Market Share Analysis, 2022

            15.15.2.1. By Type

            15.15.2.2. By Application

    15.16. Australia

        15.16.1. Pricing Analysis

        15.16.2. Market Share Analysis, 2022

            15.16.2.1. By Type

            15.16.2.2. By Application

    15.17. New Zealand

        15.17.1. Pricing Analysis

        15.17.2. Market Share Analysis, 2022

            15.17.2.1. By Type

            15.17.2.2. By Application

    15.18. China

        15.18.1. Pricing Analysis

        15.18.2. Market Share Analysis, 2022

            15.18.2.1. By Type

            15.18.2.2. By Application

    15.19. Japan

        15.19.1. Pricing Analysis

        15.19.2. Market Share Analysis, 2022

            15.19.2.1. By Type

            15.19.2.2. By Application

    15.20. South Korea

        15.20.1. Pricing Analysis

        15.20.2. Market Share Analysis, 2022

            15.20.2.1. By Type

            15.20.2.2. By Application

    15.21. GCC Countries

        15.21.1. Pricing Analysis

        15.21.2. Market Share Analysis, 2022

            15.21.2.1. By Type

            15.21.2.2. By Application

    15.22. South Africa

        15.22.1. Pricing Analysis

        15.22.2. Market Share Analysis, 2022

            15.22.2.1. By Type

            15.22.2.2. By Application

    15.23. Israel

        15.23.1. Pricing Analysis

        15.23.2. Market Share Analysis, 2022

            15.23.2.1. By Type

            15.23.2.2. By Application

16. Market Structure Analysis

    16.1. Competition Dashboard

    16.2. Competition Benchmarking

    16.3. Market Share Analysis of Top Players

        16.3.1. By Regional

        16.3.2. By Type

        16.3.3. By Application

17. Competition Analysis

    17.1. Competition Deep Dive

        17.1.1. ESPEC

            17.1.1.1. Overview

            17.1.1.2. Product Portfolio

            17.1.1.3. Profitability by Market Segments

            17.1.1.4. Sales Footprint

            17.1.1.5. Strategy Overview

                17.1.1.5.1. Marketing Strategy

                17.1.1.5.2. Product Strategy

                17.1.1.5.3. Channel Strategy

        17.1.2. Thermotron Industries

            17.1.2.1. Overview

            17.1.2.2. Product Portfolio

            17.1.2.3. Profitability by Market Segments

            17.1.2.4. Sales Footprint

            17.1.2.5. Strategy Overview

                17.1.2.5.1. Marketing Strategy

                17.1.2.5.2. Product Strategy

                17.1.2.5.3. Channel Strategy

        17.1.3. Weiss Technik UK

            17.1.3.1. Overview

            17.1.3.2. Product Portfolio

            17.1.3.3. Profitability by Market Segments

            17.1.3.4. Sales Footprint

            17.1.3.5. Strategy Overview

                17.1.3.5.1. Marketing Strategy

                17.1.3.5.2. Product Strategy

                17.1.3.5.3. Channel Strategy

        17.1.4. Binder GmbH

            17.1.4.1. Overview

            17.1.4.2. Product Portfolio

            17.1.4.3. Profitability by Market Segments

            17.1.4.4. Sales Footprint

            17.1.4.5. Strategy Overview

                17.1.4.5.1. Marketing Strategy

                17.1.4.5.2. Product Strategy

                17.1.4.5.3. Channel Strategy

        17.1.5. Cincinnati Sub-Zero Products Inc.

            17.1.5.1. Overview

            17.1.5.2. Product Portfolio

            17.1.5.3. Profitability by Market Segments

            17.1.5.4. Sales Footprint

            17.1.5.5. Strategy Overview

                17.1.5.5.1. Marketing Strategy

                17.1.5.5.2. Product Strategy

                17.1.5.5.3. Channel Strategy

        17.1.6. Angelantoni Test Technologies

            17.1.6.1. Overview

            17.1.6.2. Product Portfolio

            17.1.6.3. Profitability by Market Segments

            17.1.6.4. Sales Footprint

            17.1.6.5. Strategy Overview

                17.1.6.5.1. Marketing Strategy

                17.1.6.5.2. Product Strategy

                17.1.6.5.3. Channel Strategy

        17.1.7. Associated Environmental Systems (AES)

            17.1.7.1. Overview

            17.1.7.2. Product Portfolio

            17.1.7.3. Profitability by Market Segments

            17.1.7.4. Sales Footprint

            17.1.7.5. Strategy Overview

                17.1.7.5.1. Marketing Strategy

                17.1.7.5.2. Product Strategy

                17.1.7.5.3. Channel Strategy

        17.1.8. Vötsch Industrietechnik

            17.1.8.1. Overview

            17.1.8.2. Product Portfolio

            17.1.8.3. Profitability by Market Segments

            17.1.8.4. Sales Footprint

            17.1.8.5. Strategy Overview

                17.1.8.5.1. Marketing Strategy

                17.1.8.5.2. Product Strategy

                17.1.8.5.3. Channel Strategy

        17.1.9. MEMMERT

            17.1.9.1. Overview

            17.1.9.2. Product Portfolio

            17.1.9.3. Profitability by Market Segments

            17.1.9.4. Sales Footprint

            17.1.9.5. Strategy Overview

                17.1.9.5.1. Marketing Strategy

                17.1.9.5.2. Product Strategy

                17.1.9.5.3. Channel Strategy

        17.1.10. Hastest Solutions Inc

            17.1.10.1. Overview

            17.1.10.2. Product Portfolio

            17.1.10.3. Profitability by Market Segments

            17.1.10.4. Sales Footprint

            17.1.10.5. Strategy Overview

                17.1.10.5.1. Marketing Strategy

                17.1.10.5.2. Product Strategy

                17.1.10.5.3. Channel Strategy

18. Assumptions & Acronyms Used

19. Research Methodology

Don't pay for what you don't need

Customize your report by selecting specific countries or regions and save 30%!

List of Tables

Table 1: Global Market Value (US$ Million) Forecast by Region, 2018 to 2033

Table 2: Global Market Volume (Units) Forecast by Region, 2018 to 2033

Table 3: Global Market Value (US$ Million) Forecast by Type, 2018 to 2033

Table 4: Global Market Volume (Units) Forecast by Type, 2018 to 2033

Table 5: Global Market Value (US$ Million) Forecast by Application, 2018 to 2033

Table 6: Global Market Volume (Units) Forecast by Application, 2018 to 2033

Table 7: North America Market Value (US$ Million) Forecast by Country, 2018 to 2033

Table 8: North America Market Volume (Units) Forecast by Country, 2018 to 2033

Table 9: North America Market Value (US$ Million) Forecast by Type, 2018 to 2033

Table 10: North America Market Volume (Units) Forecast by Type, 2018 to 2033

Table 11: North America Market Value (US$ Million) Forecast by Application, 2018 to 2033

Table 12: North America Market Volume (Units) Forecast by Application, 2018 to 2033

Table 13: Latin America Market Value (US$ Million) Forecast by Country, 2018 to 2033

Table 14: Latin America Market Volume (Units) Forecast by Country, 2018 to 2033

Table 15: Latin America Market Value (US$ Million) Forecast by Type, 2018 to 2033

Table 16: Latin America Market Volume (Units) Forecast by Type, 2018 to 2033

Table 17: Latin America Market Value (US$ Million) Forecast by Application, 2018 to 2033

Table 18: Latin America Market Volume (Units) Forecast by Application, 2018 to 2033

Table 19: Western Europe Market Value (US$ Million) Forecast by Country, 2018 to 2033

Table 20: Western Europe Market Volume (Units) Forecast by Country, 2018 to 2033

Table 21: Western Europe Market Value (US$ Million) Forecast by Type, 2018 to 2033

Table 22: Western Europe Market Volume (Units) Forecast by Type, 2018 to 2033

Table 23: Western Europe Market Value (US$ Million) Forecast by Application, 2018 to 2033

Table 24: Western Europe Market Volume (Units) Forecast by Application, 2018 to 2033

Table 25: Eastern Europe Market Value (US$ Million) Forecast by Country, 2018 to 2033

Table 26: Eastern Europe Market Volume (Units) Forecast by Country, 2018 to 2033

Table 27: Eastern Europe Market Value (US$ Million) Forecast by Type, 2018 to 2033

Table 28: Eastern Europe Market Volume (Units) Forecast by Type, 2018 to 2033

Table 29: Eastern Europe Market Value (US$ Million) Forecast by Application, 2018 to 2033

Table 30: Eastern Europe Market Volume (Units) Forecast by Application, 2018 to 2033

Table 31: South Asia and Pacific Market Value (US$ Million) Forecast by Country, 2018 to 2033

Table 32: South Asia and Pacific Market Volume (Units) Forecast by Country, 2018 to 2033

Table 33: South Asia and Pacific Market Value (US$ Million) Forecast by Type, 2018 to 2033

Table 34: South Asia and Pacific Market Volume (Units) Forecast by Type, 2018 to 2033

Table 35: South Asia and Pacific Market Value (US$ Million) Forecast by Application, 2018 to 2033

Table 36: South Asia and Pacific Market Volume (Units) Forecast by Application, 2018 to 2033

Table 37: East Asia Market Value (US$ Million) Forecast by Country, 2018 to 2033

Table 38: East Asia Market Volume (Units) Forecast by Country, 2018 to 2033

Table 39: East Asia Market Value (US$ Million) Forecast by Type, 2018 to 2033

Table 40: East Asia Market Volume (Units) Forecast by Type, 2018 to 2033

Table 41: East Asia Market Value (US$ Million) Forecast by Application, 2018 to 2033

Table 42: East Asia Market Volume (Units) Forecast by Application, 2018 to 2033

Table 43: Middle East and Africa Market Value (US$ Million) Forecast by Country, 2018 to 2033

Table 44: Middle East and Africa Market Volume (Units) Forecast by Country, 2018 to 2033

Table 45: Middle East and Africa Market Value (US$ Million) Forecast by Type, 2018 to 2033

Table 46: Middle East and Africa Market Volume (Units) Forecast by Type, 2018 to 2033

Table 47: Middle East and Africa Market Value (US$ Million) Forecast by Application, 2018 to 2033

Table 48: Middle East and Africa Market Volume (Units) Forecast by Application, 2018 to 2033
Nikhil Kaitwade
Nikhil Kaitwade

Principal Consultant

Talk to Analyst

Find your sweet spots for generating winning opportunities in this market.

List of Charts

Figure 1: Global Market Value (US$ Million) by Type, 2023 to 2033

Figure 2: Global Market Value (US$ Million) by Application, 2023 to 2033

Figure 3: Global Market Value (US$ Million) by Region, 2023 to 2033

Figure 4: Global Market Value (US$ Million) Analysis by Region, 2018 to 2033

Figure 5: Global Market Volume (Units) Analysis by Region, 2018 to 2033

Figure 6: Global Market Value Share (%) and BPS Analysis by Region, 2023 to 2033

Figure 7: Global Market Y-o-Y Growth (%) Projections by Region, 2023 to 2033

Figure 8: Global Market Value (US$ Million) Analysis by Type, 2018 to 2033

Figure 9: Global Market Volume (Units) Analysis by Type, 2018 to 2033

Figure 10: Global Market Value Share (%) and BPS Analysis by Type, 2023 to 2033

Figure 11: Global Market Y-o-Y Growth (%) Projections by Type, 2023 to 2033

Figure 12: Global Market Value (US$ Million) Analysis by Application, 2018 to 2033

Figure 13: Global Market Volume (Units) Analysis by Application, 2018 to 2033

Figure 14: Global Market Value Share (%) and BPS Analysis by Application, 2023 to 2033

Figure 15: Global Market Y-o-Y Growth (%) Projections by Application, 2023 to 2033

Figure 16: Global Market Attractiveness by Type, 2023 to 2033

Figure 17: Global Market Attractiveness by Application, 2023 to 2033

Figure 18: Global Market Attractiveness by Region, 2023 to 2033

Figure 19: North America Market Value (US$ Million) by Type, 2023 to 2033

Figure 20: North America Market Value (US$ Million) by Application, 2023 to 2033

Figure 21: North America Market Value (US$ Million) by Country, 2023 to 2033

Figure 22: North America Market Value (US$ Million) Analysis by Country, 2018 to 2033

Figure 23: North America Market Volume (Units) Analysis by Country, 2018 to 2033

Figure 24: North America Market Value Share (%) and BPS Analysis by Country, 2023 to 2033

Figure 25: North America Market Y-o-Y Growth (%) Projections by Country, 2023 to 2033

Figure 26: North America Market Value (US$ Million) Analysis by Type, 2018 to 2033

Figure 27: North America Market Volume (Units) Analysis by Type, 2018 to 2033

Figure 28: North America Market Value Share (%) and BPS Analysis by Type, 2023 to 2033

Figure 29: North America Market Y-o-Y Growth (%) Projections by Type, 2023 to 2033

Figure 30: North America Market Value (US$ Million) Analysis by Application, 2018 to 2033

Figure 31: North America Market Volume (Units) Analysis by Application, 2018 to 2033

Figure 32: North America Market Value Share (%) and BPS Analysis by Application, 2023 to 2033

Figure 33: North America Market Y-o-Y Growth (%) Projections by Application, 2023 to 2033

Figure 34: North America Market Attractiveness by Type, 2023 to 2033

Figure 35: North America Market Attractiveness by Application, 2023 to 2033

Figure 36: North America Market Attractiveness by Country, 2023 to 2033

Figure 37: Latin America Market Value (US$ Million) by Type, 2023 to 2033

Figure 38: Latin America Market Value (US$ Million) by Application, 2023 to 2033

Figure 39: Latin America Market Value (US$ Million) by Country, 2023 to 2033

Figure 40: Latin America Market Value (US$ Million) Analysis by Country, 2018 to 2033

Figure 41: Latin America Market Volume (Units) Analysis by Country, 2018 to 2033

Figure 42: Latin America Market Value Share (%) and BPS Analysis by Country, 2023 to 2033

Figure 43: Latin America Market Y-o-Y Growth (%) Projections by Country, 2023 to 2033

Figure 44: Latin America Market Value (US$ Million) Analysis by Type, 2018 to 2033

Figure 45: Latin America Market Volume (Units) Analysis by Type, 2018 to 2033

Figure 46: Latin America Market Value Share (%) and BPS Analysis by Type, 2023 to 2033

Figure 47: Latin America Market Y-o-Y Growth (%) Projections by Type, 2023 to 2033

Figure 48: Latin America Market Value (US$ Million) Analysis by Application, 2018 to 2033

Figure 49: Latin America Market Volume (Units) Analysis by Application, 2018 to 2033

Figure 50: Latin America Market Value Share (%) and BPS Analysis by Application, 2023 to 2033

Figure 51: Latin America Market Y-o-Y Growth (%) Projections by Application, 2023 to 2033

Figure 52: Latin America Market Attractiveness by Type, 2023 to 2033

Figure 53: Latin America Market Attractiveness by Application, 2023 to 2033

Figure 54: Latin America Market Attractiveness by Country, 2023 to 2033

Figure 55: Western Europe Market Value (US$ Million) by Type, 2023 to 2033

Figure 56: Western Europe Market Value (US$ Million) by Application, 2023 to 2033

Figure 57: Western Europe Market Value (US$ Million) by Country, 2023 to 2033

Figure 58: Western Europe Market Value (US$ Million) Analysis by Country, 2018 to 2033

Figure 59: Western Europe Market Volume (Units) Analysis by Country, 2018 to 2033

Figure 60: Western Europe Market Value Share (%) and BPS Analysis by Country, 2023 to 2033

Figure 61: Western Europe Market Y-o-Y Growth (%) Projections by Country, 2023 to 2033

Figure 62: Western Europe Market Value (US$ Million) Analysis by Type, 2018 to 2033

Figure 63: Western Europe Market Volume (Units) Analysis by Type, 2018 to 2033

Figure 64: Western Europe Market Value Share (%) and BPS Analysis by Type, 2023 to 2033

Figure 65: Western Europe Market Y-o-Y Growth (%) Projections by Type, 2023 to 2033

Figure 66: Western Europe Market Value (US$ Million) Analysis by Application, 2018 to 2033

Figure 67: Western Europe Market Volume (Units) Analysis by Application, 2018 to 2033

Figure 68: Western Europe Market Value Share (%) and BPS Analysis by Application, 2023 to 2033

Figure 69: Western Europe Market Y-o-Y Growth (%) Projections by Application, 2023 to 2033

Figure 70: Western Europe Market Attractiveness by Type, 2023 to 2033

Figure 71: Western Europe Market Attractiveness by Application, 2023 to 2033

Figure 72: Western Europe Market Attractiveness by Country, 2023 to 2033

Figure 73: Eastern Europe Market Value (US$ Million) by Type, 2023 to 2033

Figure 74: Eastern Europe Market Value (US$ Million) by Application, 2023 to 2033

Figure 75: Eastern Europe Market Value (US$ Million) by Country, 2023 to 2033

Figure 76: Eastern Europe Market Value (US$ Million) Analysis by Country, 2018 to 2033

Figure 77: Eastern Europe Market Volume (Units) Analysis by Country, 2018 to 2033

Figure 78: Eastern Europe Market Value Share (%) and BPS Analysis by Country, 2023 to 2033

Figure 79: Eastern Europe Market Y-o-Y Growth (%) Projections by Country, 2023 to 2033

Figure 80: Eastern Europe Market Value (US$ Million) Analysis by Type, 2018 to 2033

Figure 81: Eastern Europe Market Volume (Units) Analysis by Type, 2018 to 2033

Figure 82: Eastern Europe Market Value Share (%) and BPS Analysis by Type, 2023 to 2033

Figure 83: Eastern Europe Market Y-o-Y Growth (%) Projections by Type, 2023 to 2033

Figure 84: Eastern Europe Market Value (US$ Million) Analysis by Application, 2018 to 2033

Figure 85: Eastern Europe Market Volume (Units) Analysis by Application, 2018 to 2033

Figure 86: Eastern Europe Market Value Share (%) and BPS Analysis by Application, 2023 to 2033

Figure 87: Eastern Europe Market Y-o-Y Growth (%) Projections by Application, 2023 to 2033

Figure 88: Eastern Europe Market Attractiveness by Type, 2023 to 2033

Figure 89: Eastern Europe Market Attractiveness by Application, 2023 to 2033

Figure 90: Eastern Europe Market Attractiveness by Country, 2023 to 2033

Figure 91: South Asia and Pacific Market Value (US$ Million) by Type, 2023 to 2033

Figure 92: South Asia and Pacific Market Value (US$ Million) by Application, 2023 to 2033

Figure 93: South Asia and Pacific Market Value (US$ Million) by Country, 2023 to 2033

Figure 94: South Asia and Pacific Market Value (US$ Million) Analysis by Country, 2018 to 2033

Figure 95: South Asia and Pacific Market Volume (Units) Analysis by Country, 2018 to 2033

Figure 96: South Asia and Pacific Market Value Share (%) and BPS Analysis by Country, 2023 to 2033

Figure 97: South Asia and Pacific Market Y-o-Y Growth (%) Projections by Country, 2023 to 2033

Figure 98: South Asia and Pacific Market Value (US$ Million) Analysis by Type, 2018 to 2033

Figure 99: South Asia and Pacific Market Volume (Units) Analysis by Type, 2018 to 2033

Figure 100: South Asia and Pacific Market Value Share (%) and BPS Analysis by Type, 2023 to 2033

Figure 101: South Asia and Pacific Market Y-o-Y Growth (%) Projections by Type, 2023 to 2033

Figure 102: South Asia and Pacific Market Value (US$ Million) Analysis by Application, 2018 to 2033

Figure 103: South Asia and Pacific Market Volume (Units) Analysis by Application, 2018 to 2033

Figure 104: South Asia and Pacific Market Value Share (%) and BPS Analysis by Application, 2023 to 2033

Figure 105: South Asia and Pacific Market Y-o-Y Growth (%) Projections by Application, 2023 to 2033

Figure 106: South Asia and Pacific Market Attractiveness by Type, 2023 to 2033

Figure 107: South Asia and Pacific Market Attractiveness by Application, 2023 to 2033

Figure 108: South Asia and Pacific Market Attractiveness by Country, 2023 to 2033

Figure 109: East Asia Market Value (US$ Million) by Type, 2023 to 2033

Figure 110: East Asia Market Value (US$ Million) by Application, 2023 to 2033

Figure 111: East Asia Market Value (US$ Million) by Country, 2023 to 2033

Figure 112: East Asia Market Value (US$ Million) Analysis by Country, 2018 to 2033

Figure 113: East Asia Market Volume (Units) Analysis by Country, 2018 to 2033

Figure 114: East Asia Market Value Share (%) and BPS Analysis by Country, 2023 to 2033

Figure 115: East Asia Market Y-o-Y Growth (%) Projections by Country, 2023 to 2033

Figure 116: East Asia Market Value (US$ Million) Analysis by Type, 2018 to 2033

Figure 117: East Asia Market Volume (Units) Analysis by Type, 2018 to 2033

Figure 118: East Asia Market Value Share (%) and BPS Analysis by Type, 2023 to 2033

Figure 119: East Asia Market Y-o-Y Growth (%) Projections by Type, 2023 to 2033

Figure 120: East Asia Market Value (US$ Million) Analysis by Application, 2018 to 2033

Figure 121: East Asia Market Volume (Units) Analysis by Application, 2018 to 2033

Figure 122: East Asia Market Value Share (%) and BPS Analysis by Application, 2023 to 2033

Figure 123: East Asia Market Y-o-Y Growth (%) Projections by Application, 2023 to 2033

Figure 124: East Asia Market Attractiveness by Type, 2023 to 2033

Figure 125: East Asia Market Attractiveness by Application, 2023 to 2033

Figure 126: East Asia Market Attractiveness by Country, 2023 to 2033

Figure 127: Middle East and Africa Market Value (US$ Million) by Type, 2023 to 2033

Figure 128: Middle East and Africa Market Value (US$ Million) by Application, 2023 to 2033

Figure 129: Middle East and Africa Market Value (US$ Million) by Country, 2023 to 2033

Figure 130: Middle East and Africa Market Value (US$ Million) Analysis by Country, 2018 to 2033

Figure 131: Middle East and Africa Market Volume (Units) Analysis by Country, 2018 to 2033

Figure 132: Middle East and Africa Market Value Share (%) and BPS Analysis by Country, 2023 to 2033

Figure 133: Middle East and Africa Market Y-o-Y Growth (%) Projections by Country, 2023 to 2033

Figure 134: Middle East and Africa Market Value (US$ Million) Analysis by Type, 2018 to 2033

Figure 135: Middle East and Africa Market Volume (Units) Analysis by Type, 2018 to 2033

Figure 136: Middle East and Africa Market Value Share (%) and BPS Analysis by Type, 2023 to 2033

Figure 137: Middle East and Africa Market Y-o-Y Growth (%) Projections by Type, 2023 to 2033

Figure 138: Middle East and Africa Market Value (US$ Million) Analysis by Application, 2018 to 2033

Figure 139: Middle East and Africa Market Volume (Units) Analysis by Application, 2018 to 2033

Figure 140: Middle East and Africa Market Value Share (%) and BPS Analysis by Application, 2023 to 2033

Figure 141: Middle East and Africa Market Y-o-Y Growth (%) Projections by Application, 2023 to 2033

Figure 142: Middle East and Africa Market Attractiveness by Type, 2023 to 2033

Figure 143: Middle East and Africa Market Attractiveness by Application, 2023 to 2033

Figure 144: Middle East and Africa Market Attractiveness by Country, 2023 to 2033

Recommendations

Testing Equipment

Fiber Optic Test Equipment Market

Published : March 2023

Testing Equipment

Environmental Test Equipment Market

Published : February 2023

Explore Testing Equipment Insights

View Reports

Environmental Test Chambers Market