Reports

- Global Locations -

Headquarters

Future Market Insights, Inc.

Christiana Corporate, 200
Continental Drive, Suite 401,
Newark, Delaware - 19713,
United States

T: +1-845-579-5705

Americas

Future Market Insights, Inc.

616 Corporate Way, Suite 2-9018,
Valley Cottage, NY 10989, United States

T: +1-347-918-3531

MEA

Future Market Insights

1602-6 Jumeirah Bay X2 Tower, Plot No: JLT-PH2-X2A,
Jumeirah Lakes Towers, Dubai,
United Arab Emirates

Europe

Future Market Insights

3rd Floor, 207 Regent Street,
W1B 3HH London
United Kingdom

T: + 44 (0) 20 8123 9659
D: +44 (0) 20 3287 4268

Asia Pacific

Future Market Insights

IndiaLand Global Tech Park, Unit UG-1, Behind Grand HighStreet, Phase 1, Hinjawadi, MH, Pune – 411057, India

Ironing Table Market Outlook (2022-2032)

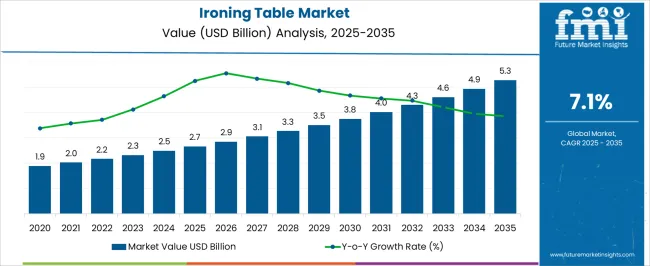
[300 Pages Report] The ironing table market size is projected to reach US$ 2,168.4 million in 2022 and, with a 7.1% CAGR from 2022 to 2032, to reach US$ 4,305.6 million.

Growth is attributed to the following:

  • The use of the ironing board makes ironing garments simpler and more pleasant. Ironing boards are available for purchase from retailers, outlets, and internet marketplaces.
  • To satisfy customer demands for comfort and convenience, ironing boards have become an essential item of home furnishings. To prevent bed sheets or other goods from accidentally burning while being ironed, ironing boards are a risk-free and safe method.
  • The market for ironing boards has increased as every household has become more contemporary, especially in developing nations.
  • Improvements to size, shape, and durability appear to be of utmost importance because customers seem to be seeking more comfort and convenience in a small package.
Data Points Key Statistics
Growth Rate (2016 to 2021) 5.9% CAGR
Projected Growth Rate (2022 to 2032) 7.1% CAGR
Expected Market Value (2022) US$ 2,168.4 Million
Anticipated Forecast Value (2032) US$ 4,305.6 Million

Don't pay for what you don't need

Customize your report by selecting specific countries or regions and save 30%!

What is the Regional Analysis of the Ironing Table Market?

Ironing boards are a common household item in developed regions like North America and Europe, where almost every home either has one or needs one. As a result, demand is high, and the forecast confirms this.

In addition to ironing boards, which are in high demand due to wear and tear, there is also a high demand for ironing board covers. Due to urbanization and development, there is also an increase in demand from regions like the Middle East, South East Asia, the Middle East, Oceania, Latin America, and Africa.

Latest Trends and Opportunities in the Ironing Table Market

The current trends are for high-end, innovative technology to be available at affordable prices. Compact folding ironing boards that save space are in high demand and are being adopted by several rivals in the ironing table market.

A tabletop folding ironing board made by one of the competitors, Honey-can-do, is incredibly small and portable and fits nicely inside a suitcase. Companies are developing ironing boards and folding shelves because these inventions boost sales and market share.

There is a sizable opportunity in this market in developed countries, particularly in emerging countries, due to increasing modernization and urbanization coupled with increased consumer buying power due to the modernity and essentiality of the product in the modern way of life and homes. The ironing board's cover quality, longevity, and ability to withstand high heat all contribute to the item's appeal.

Sneha Verghese
Sneha Verghese

Principal Consultant

Talk to Analyst

Find your sweet spots for generating winning opportunities in this market.

Introduction of Innovative Ironing Tables to Aid in the Ironing Table Market Growth

Due to technical developments made by market participants, boards that can be changed between three different positions were introduced as steamers grew in popularity. The market, which is controlled by millennials, will benefit from the design of a new device that revolutionizes ironing duties.

Rowenta, a producer of strong irons and ironing boards, recently unveiled a machine on wheels that collapses into a space-saving package that can be kept in a closet. The majority of manufacturers offer ironing boards on their websites or on other online platforms to increase the size of their customer base.

These sites are drawing users in by providing big discounts. Sales of ironing accessories, including regular irons, steam irons, and steamers, have a direct impact on the sales of ironing boards.

Extremely broad, ergonomic, and adjustable at four different heights are the features of Oumffy's self-standing and folding ironing boards. The T-leg ironing board from Homz features a 100% cotton cover and a polyurethane foam cushion that can withstand an iron temperature of 450 degrees.

The business has also introduced a robust Durabuilt ironing board with a mesh-improved steam flow steel top with scorch protection and stain-resistant cotton coverings.

The ironing board simplifies the process of ironing clothes, allowing the user to do it more comfortably. Ironing boards are available to consumers via a store, outlets, and online platforms. Ironing Boards have become one of the essential household equipment to cater to the needs of convenience and comfort of the consumer. Ironing boards are a safe and risk-free way to iron clothes so as to not burn the bedsheets or other things due to negligence.

While millennials are known for dumping traditional household products, ironing boards are still staples in the majority of households. Consumers, while buying ironing boards primarily look for foldability, frame design, measurements, iron rest, and durability.

Which are Some Prominent Drivers Spearheading Ironing Table Market Growth?

Increasing need for safe household ironing to drive the growth of the market

The demand for Ironing boards is increasing with the modernization of every household, especially in developing countries the market for ironing tables has seen a tremendous increase.

The increases in demand for compact foldable space-saving ironing boards also boost the growth of the market. For instance, Honey-can-do one of the players has created a tabletop foldable ironing board that is extremely compact and easily portable as it can easily fit inside a suitcase.

The increasing need for a safe way to iron clothes without taking much risk is the main driver of the sales of the ironing table market. Also, innovativeness, quality, and competitive prices can create huge opportunities for players in this field. The quality of the cover of the ironing board and the ability to long last and withstand high temperatures also contributes to the demand of the product.

Get the data you need at a Fraction of the cost

Personalize your report by choosing insights you need
and save 40%!

What are the Challenges Faced by the Ironing Table Industry?

Growing Popularity of Steamers May Hinder the Growth of the Ironing Table Market

Although the ironing table market has numerous end-uses, there are numerous obstacles that likely pose a challenge to market growth. Millennials' preference for other ironing variants such as steamer or the wrinkle remover setting on their dryers can hamper the sales of ironing boards. The height and sturdiness of these boards matter a lot while using them, many users complain of no adjustable height and poor quality.

Additionally, ironing boards require proper maintenance as they could break if extra force is applied. Furthermore, ironing boards are quite expensive which can impact sales negatively during the forecast period.

The availability of alternatives that are available in every household like beds, kitchen tops, ironing blankets, etc. can cause hindrance in the sales of the ironing table market.

Will North America Continue Dominance in the Global Ironing Table Market?

Growing Demand from The Residential Sector to Favor the Sales in The Region

The North America ironing table market is expected to accumulate a market share of 26.3% in 2022. On a geographic basis, North America is anticipated to be the largest ironing table market due to the booming retail and hospitality sector and the demand from the residential sector showed a marginal increase.

Key manufacturers are capitalizing on this existing trend and introducing sustainable and user-friendly laundry products. Apart from this, key players in the country are also focusing on attractive and sustainable packaging targeting high audiences to establish their brand presence. Such factors are expected to spur the sales of ironing tables in the U.S. over the forthcoming decade.

How Will Growth of the European Ironing Table Market unfold?

Growth of Retail Sector in Europe Contribute to Market Sales

Europe is expected to accumulate a market share value of 21.4% in 2022 in the ironing table market. Europe also offers potential growth opportunities in the ironing table market due to the rise in the retail and hospitality sector. Increase in Sale of Electric Irons in Europe to boost the growth of the ironing table market

The emergence of e-commerce platforms in the region is expected to increase sales as vendors are collaborating with online retail stores to increase their revenue generation. Hence, demand for ironing tables is expected to witness incremental opportunity. Some of the few reasons for this include rising urbanization, higher disposable income per capita, increasing consumer spending on household products, and other factors.

Will the Asia Pacific emerge as an Attractive Ironing Board Market?

Increase in Essentiality of the Product to Provide Opportunity for Growth of the Market

The ironing table market in the Asia Pacific is projected to expand at a rapid pace during the forecast period. The market is driven by continuous product innovation and & features that make products suitable for different consumers, due to technological innovation demand for time-saving and convenient products has increased Also the changing lifestyle trend of consumers drives the ironing board market.

Manufacturers from Japan and China have been making efficient products with the least expense. Their strong distribution channels have made the product available for the common mass at low prices. This boost the growth of the ironing table market in the Asia Pacific.

Start-up Scenario

New entrants in the ironing table market are continually indulging in several collaborations and highly investing in research and development activities to provide more convenient solutions to industry verticals. Some of the major start-ups that are leading the development of the market are- BoardMann, Hoover, Magna, PAffy, Solimo, Galoppia, Magna Homewares and Oumffy.

  • Magna-Established in 016, is the leading manufacturer, importer, exporter and wholesaler of Cloth Drying Stand, Ironing Board, and other household products

Market Competition

Some of the key participants present in the global ironing table market include Whitmor, Leifheit, Brabantia, HOYO, Ybm home, Forever Holdings, Honey-Can-Do, Household Essentials, Homz, Widemex, Casa, Parker, Hafele America, Westex, Minky among others.

Attributed to the presence of such a high number of participants, the market is highly competitive. While global players such as Whitmor, Leifheit, Brabantia, HOYO, Ybm home, Forever Holdings, Honey-Can-Do account for considerable market size, several regional-level players are also operating across key growth regions, particularly in the Asia Pacific.

  • Bathla introduced X ?res ??e, a large foldable ironing b??rd m?de with the highest quality material in st?te-?f-the-?rt f??ilities. It is built from premium quality durable steel and designed with innovative features.
  • Leading homeware brand Brabantia introduced a great little Brabantia board to its extended range of high-quality ironing boards: the 37 x 12 in (95 x 30 cm) TableTop ironing board. This tip-top TableTop ironing board is part of the Linn collection and is made for quick, in-between ironing jobs. Non-slip caps keep it in place and protect your table or worktop.

Report Scope

Report Attribute Details
Growth Rate CAGR of 7.1% from 2022 to 2032
Expected Market Value (2022) US$ 2,168.4 Million
Anticipated Forecast Value (2032) US$ 4,305.6 Million
Base Year for Estimation 2021
Historical Data 2016 to 2021
Forecast Period 2022 to 2032
Quantitative Units Revenue in US$ Million and CAGR from 2022 to 2032
Report Coverage Revenue Forecast, Volume Forecast, Company Ranking, Competitive Landscape, Growth Factors, Trends and Pricing Analysis
Segments Covered
  • Application
  • Classification
  • Type
  • Region
Regions Covered
  • North America
  • Latin America
  • Europe
  • Asia Pacific
  • Middle East and Africa
Key Countries Profiled
  • USA
  • Canada
  • Mexico
  • Brazil
  • Germany
  • Italy
  • France
  • UK
  • Spain
  • China
  • Japan
  • South Korea
  • Malaysia
  • Singapore
  • Australia
  • GCC
  • South Africa
  • Israel
Key Companies Profiled
  • Flipzone
  • Magna Homewares
  • Orril
  • Oppsme
  • Bathla
  • Whitmor
  • Leifheit
  • Brabantia
  • Ybm Home
  • Widemex
Customization Available Upon Request

Key Segments Profiled in the Ironing Table Industry Survey

Ironing Table Market by Classifications:

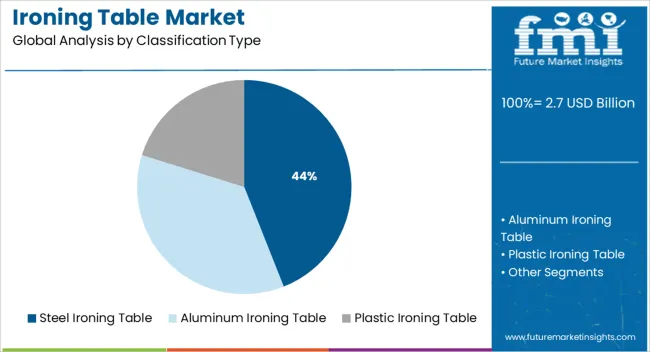
  • Steel Ironing Table
  • Aluminum Ironing Table
  • Plastic Ironing Table

Ironing Table Market by Applications:

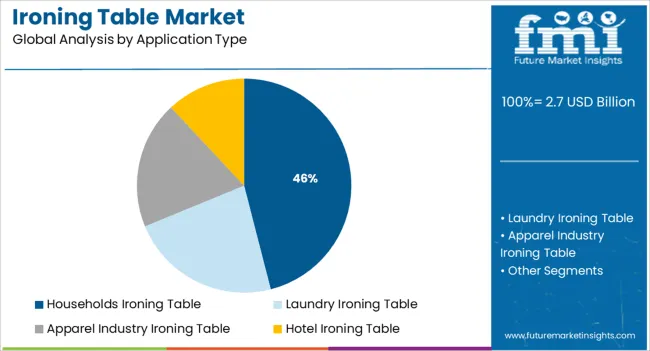
  • Households Ironing Table
  • Laundry Ironing Table
  • Apparel Industry Ironing Table
  • Hotel Ironing Table

Ironing Table Market by Types:

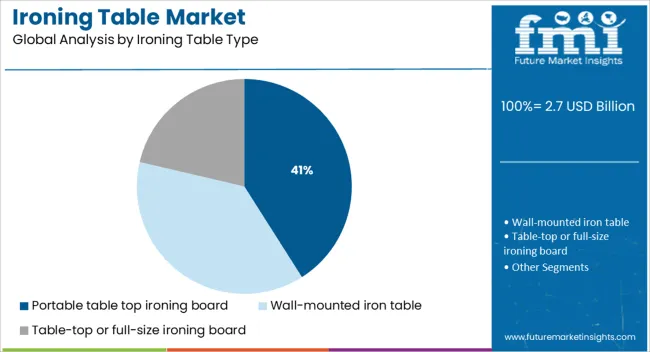
  • Portable table top ironing board
  • Wall-mounted iron table
  • Table-top or full-size ironing board

Ironing Table Market Region:

  • North America Ironing Table Market
  • Latin America Ironing Table Market
  • Europe Ironing Table Market
  • Asia Pacific Ironing Table Market
  • Middle East and Africa Ironing Table Market

Frequently Asked Questions

What is the anticipated growth of the ironing table market until 2032?

FMI projects the global ironing table market to expand at a 7.1% value CAGR by 2032

Which region is forecast to be the most lucrative for ironing table market growth?

North America is expected to be the most opportunistic with a 26.3% share of the total c market

Which are some prominent dialysis ironing table market manufacturers?

Whitmor, Leifheit, Brabantia, HOYO, Ybm home, Forever Holdings, Honey-Can-Do are some prominent ironing table, market manufacturers.

Table of Content

1. Executive Summary

    1.1. Global Market Outlook

    1.2. Demand-side Trends

    1.3. Supply-side Trends

    1.4. Technology Roadmap Analysis

    1.5. Analysis and Recommendations

2. Market Overview

    2.1. Market Coverage / Taxonomy

    2.2. Market Definition / Scope / Limitations

3. Market Background

    3.1. Market Dynamics

        3.1.1. Drivers

        3.1.2. Restraints

        3.1.3. Opportunity

        3.1.4. Trends

    3.2. Scenario Forecast

        3.2.1. Demand in Optimistic Scenario

        3.2.2. Demand in Likely Scenario

        3.2.3. Demand in Conservative Scenario

    3.3. Opportunity Map Analysis

    3.4. Product Life Cycle Analysis

    3.5. Supply Chain Analysis

        3.5.1. Supply Side Participants and their Roles

            3.5.1.1. Producers

            3.5.1.2. Mid-Level Participants (Traders/ Agents/ Brokers)

            3.5.1.3. Wholesalers and Distributors

        3.5.2. Value Added and Value Created at Node in the Supply Chain

        3.5.3. List of Raw Material Suppliers

        3.5.4. List of Existing and Potential Buyer’s

    3.6. Investment Feasibility Matrix

    3.7. Value Chain Analysis

        3.7.1. Profit Margin Analysis

        3.7.2. Wholesalers and Distributors

        3.7.3. Retailers

    3.8. PESTLE and Porter’s Analysis

    3.9. Regulatory Landscape

        3.9.1. By Key Regions

        3.9.2. By Key Countries

    3.10. Regional Parent Market Outlook

    3.11. Production and Consumption Statistics

    3.12. Import and Export Statistics

4. Global Ironing Table Market Analysis 2016-2021 and Forecast, 2022-2032

    4.1. Historical Market Size Value (US$ Mn) & Volume (Units) Analysis, 2016-2021

    4.2. Current and Future Market Size Value (US$ Mn) & Volume (Units) Projections, 2022-2032

        4.2.1. Y-o-Y Growth Trend Analysis

        4.2.2. Absolute $ Opportunity Analysis

5. Global Ironing Table Market Analysis 2016-2021 and Forecast 2022-2032, By Classifications

    5.1. Introduction / Key Findings

    5.2. Historical Market Size Value (US$ Mn) & Volume (Units) Analysis By Classifications, 2016-2021

    5.3. Current and Future Market Size Value (US$ Mn) & Volume (Units) Analysis and Forecast By Classifications, 2022-2032

        5.3.1. Steel

        5.3.2. Aluminum

        5.3.3. Plastic

    5.4. Y-o-Y Growth Trend Analysis By Classifications, 2016-2021

    5.5. Absolute $ Opportunity Analysis By Classifications, 2022-2032

6. Global Ironing Table Market Analysis 2016-2021 and Forecast 2022-2032, By Applications

    6.1. Introduction / Key Findings

    6.2. Historical Market Size Value (US$ Mn) & Volume (Units) Analysis By Applications, 2016-2021

    6.3. Current and Future Market Size Value (US$ Mn) & Volume (Units) Analysis and Forecast By Applications, 2022-2032

        6.3.1. Applications

        6.3.2. Laundry

        6.3.3. Apparel Industry

        6.3.4. Hotel

    6.4. Y-o-Y Growth Trend Analysis By Applications, 2016-2021

    6.5. Absolute $ Opportunity Analysis By Applications, 2022-2032

7. Global Ironing Table Market Analysis 2016-2021 and Forecast 2022-2032, By Types

    7.1. Introduction / Key Findings

    7.2. Historical Market Size Value (US$ Mn) & Volume (Units) Analysis By Types, 2016-2021

    7.3. Current and Future Market Size Value (US$ Mn) & Volume (Units) Analysis and Forecast By Types, 2022-2032

        7.3.1. Portable Table Top Ironing Board

        7.3.2. Wall-mounted Iron Table

        7.3.3. Table-top or Full-size Ironing Board

    7.4. Y-o-Y Growth Trend Analysis By Types, 2016-2021

    7.5. Absolute $ Opportunity Analysis By Types, 2022-2032

8. Global Ironing Table Market Analysis 2016-2021 and Forecast 2022-2032, By Region

    8.1. Introduction

    8.2. Historical Market Size Value (US$ Mn) & Volume (Units) Analysis By Region, 2016-2021

    8.3. Current Market Size Value (US$ Mn) & Volume (Units) Analysis and Forecast By Region, 2022-2032

        8.3.1. North America

        8.3.2. Latin America

        8.3.3. Europe

        8.3.4. Asia Pacific

        8.3.5. MEA

    8.4. Market Attractiveness Analysis By Region

9. North America Ironing Table Market Analysis 2016-2021 and Forecast 2022-2032, By Country

    9.1. Historical Market Size Value (US$ Mn) & Volume (Units) Trend Analysis By Market Taxonomy, 2016-2021

    9.2. Market Size Value (US$ Mn) & Volume (Units) Forecast By Market Taxonomy, 2022-2032

        9.2.1. By Country

            9.2.1.1. U.S.

            9.2.1.2. Canada

        9.2.2. By Classifications

        9.2.3. By Applications

        9.2.4. By Types

    9.3. Market Attractiveness Analysis

        9.3.1. By Country

        9.3.2. By Classifications

        9.3.3. By Applications

        9.3.4. By Types

    9.4. Key Takeaways

10. Latin America Ironing Table Market Analysis 2016-2021 and Forecast 2022-2032, By Country

    10.1. Historical Market Size Value (US$ Mn) & Volume (Units) Trend Analysis By Market Taxonomy, 2016-2021

    10.2. Market Size Value (US$ Mn) & Volume (Units) Forecast By Market Taxonomy, 2022-2032

        10.2.1. By Country

            10.2.1.1. Brazil

            10.2.1.2. Mexico

            10.2.1.3. Rest of Latin America

        10.2.2. By Classifications

        10.2.3. By Applications

        10.2.4. By Types

    10.3. Market Attractiveness Analysis

        10.3.1. By Country

        10.3.2. By Classifications

        10.3.3. By Applications

        10.3.4. By Types

    10.4. Key Takeaways

11. Europe Ironing Table Market Analysis 2016-2021 and Forecast 2022-2032, By Country

    11.1. Historical Market Size Value (US$ Mn) & Volume (Units) Trend Analysis By Market Taxonomy, 2016-2021

    11.2. Market Size Value (US$ Mn) & Volume (Units) Forecast By Market Taxonomy, 2022-2032

        11.2.1. By Country

            11.2.1.1. Germany

            11.2.1.2. U.K.

            11.2.1.3. France

            11.2.1.4. Spain

            11.2.1.5. Italy

            11.2.1.6. Rest of Europe

        11.2.2. By Classifications

        11.2.3. By Applications

        11.2.4. By Types

    11.3. Market Attractiveness Analysis

        11.3.1. By Country

        11.3.2. By Classifications

        11.3.3. By Applications

        11.3.4. By Types

    11.4. Key Takeaways

12. Asia Pacific Ironing Table Market Analysis 2016-2021 and Forecast 2022-2032, By Country

    12.1. Historical Market Size Value (US$ Mn) & Volume (Units) Trend Analysis By Market Taxonomy, 2016-2021

    12.2. Market Size Value (US$ Mn) & Volume (Units) Forecast By Market Taxonomy, 2022-2032

        12.2.1. By Country

            12.2.1.1. China

            12.2.1.2. Japan

            12.2.1.3. South Korea

            12.2.1.4. Malaysia

            12.2.1.5. Singapore

            12.2.1.6. Australia

            12.2.1.7. New Zealand

            12.2.1.8. Rest of APAC

        12.2.2. By Classifications

        12.2.3. By Applications

        12.2.4. By Types

    12.3. Market Attractiveness Analysis

        12.3.1. By Country

        12.3.2. By Classifications

        12.3.3. By Applications

        12.3.4. By Types

    12.4. Key Takeaways

13. MEA Ironing Table Market Analysis 2016-2021 and Forecast 2022-2032, By Country

    13.1. Historical Market Size Value (US$ Mn) & Volume (Units) Trend Analysis By Market Taxonomy, 2016-2021

    13.2. Market Size Value (US$ Mn) & Volume (Units) Forecast By Market Taxonomy, 2022-2032

        13.2.1. By Country

            13.2.1.1. GCC Countries

            13.2.1.2. South Africa

            13.2.1.3. Israel

            13.2.1.4. Rest of MEA

        13.2.2. By Classifications

        13.2.3. By Applications

        13.2.4. By Types

    13.3. Market Attractiveness Analysis

        13.3.1. By Country

        13.3.2. By Classifications

        13.3.3. By Applications

        13.3.4. By Types

    13.4. Key Takeaways

14. Key Countries Ironing Table Market Analysis

    14.1. U.S.

        14.1.1. Pricing Analysis

        14.1.2. Market Share Analysis, 2021

            14.1.2.1. By Classifications

            14.1.2.2. By Applications

            14.1.2.3. By Types

    14.2. Canada

        14.2.1. Pricing Analysis

        14.2.2. Market Share Analysis, 2021

            14.2.2.1. By Classifications

            14.2.2.2. By Applications

            14.2.2.3. By Types

    14.3. Brazil

        14.3.1. Pricing Analysis

        14.3.2. Market Share Analysis, 2021

            14.3.2.1. By Classifications

            14.3.2.2. By Applications

            14.3.2.3. By Types

    14.4. Mexico

        14.4.1. Pricing Analysis

        14.4.2. Market Share Analysis, 2021

            14.4.2.1. By Classifications

            14.4.2.2. By Applications

            14.4.2.3. By Types

    14.5. Germany

        14.5.1. Pricing Analysis

        14.5.2. Market Share Analysis, 2021

            14.5.2.1. By Classifications

            14.5.2.2. By Applications

            14.5.2.3. By Types

    14.6. U.K.

        14.6.1. Pricing Analysis

        14.6.2. Market Share Analysis, 2021

            14.6.2.1. By Classifications

            14.6.2.2. By Applications

            14.6.2.3. By Types

    14.7. France

        14.7.1. Pricing Analysis

        14.7.2. Market Share Analysis, 2021

            14.7.2.1. By Classifications

            14.7.2.2. By Applications

            14.7.2.3. By Types

    14.8. Spain

        14.8.1. Pricing Analysis

        14.8.2. Market Share Analysis, 2021

            14.8.2.1. By Classifications

            14.8.2.2. By Applications

            14.8.2.3. By Types

    14.9. Italy

        14.9.1. Pricing Analysis

        14.9.2. Market Share Analysis, 2021

            14.9.2.1. By Classifications

            14.9.2.2. By Applications

            14.9.2.3. By Types

    14.10. China

        14.10.1. Pricing Analysis

        14.10.2. Market Share Analysis, 2021

            14.10.2.1. By Classifications

            14.10.2.2. By Applications

            14.10.2.3. By Types

    14.11. Japan

        14.11.1. Pricing Analysis

        14.11.2. Market Share Analysis, 2021

            14.11.2.1. By Classifications

            14.11.2.2. By Applications

            14.11.2.3. By Types

    14.12. South Korea

        14.12.1. Pricing Analysis

        14.12.2. Market Share Analysis, 2021

            14.12.2.1. By Classifications

            14.12.2.2. By Applications

            14.12.2.3. By Types

    14.13. Malaysia

        14.13.1. Pricing Analysis

        14.13.2. Market Share Analysis, 2021

            14.13.2.1. By Classifications

            14.13.2.2. By Applications

            14.13.2.3. By Types

    14.14. Singapore

        14.14.1. Pricing Analysis

        14.14.2. Market Share Analysis, 2021

            14.14.2.1. By Classifications

            14.14.2.2. By Applications

            14.14.2.3. By Types

    14.15. Australia

        14.15.1. Pricing Analysis

        14.15.2. Market Share Analysis, 2021

            14.15.2.1. By Classifications

            14.15.2.2. By Applications

            14.15.2.3. By Types

    14.16. New Zealand

        14.16.1. Pricing Analysis

        14.16.2. Market Share Analysis, 2021

            14.16.2.1. By Classifications

            14.16.2.2. By Applications

            14.16.2.3. By Types

    14.17. GCC Countries

        14.17.1. Pricing Analysis

        14.17.2. Market Share Analysis, 2021

            14.17.2.1. By Classifications

            14.17.2.2. By Applications

            14.17.2.3. By Types

    14.18. South Africa

        14.18.1. Pricing Analysis

        14.18.2. Market Share Analysis, 2021

            14.18.2.1. By Classifications

            14.18.2.2. By Applications

            14.18.2.3. By Types

    14.19. Israel

        14.19.1. Pricing Analysis

        14.19.2. Market Share Analysis, 2021

            14.19.2.1. By Classifications

            14.19.2.2. By Applications

            14.19.2.3. By Types

15. Market Structure Analysis

    15.1. Competition Dashboard

    15.2. Competition Benchmarking

    15.3. Market Share Analysis of Top Players

        15.3.1. By Regional

        15.3.2. By Classifications

        15.3.3. By Applications

        15.3.4. By Types

16. Competition Analysis

    16.1. Competition Deep Dive

        16.1.1. Flipzone

            16.1.1.1. Overview

            16.1.1.2. Product Portfolio

            16.1.1.3. Profitability by Market Segments

            16.1.1.4. Sales Footprint

            16.1.1.5. Strategy Overview

                16.1.1.5.1. Marketing Strategy

                16.1.1.5.2. Product Strategy

                16.1.1.5.3. Channel Strategy

        16.1.2. Magna Homewares

            16.1.2.1. Overview

            16.1.2.2. Product Portfolio

            16.1.2.3. Profitability by Market Segments

            16.1.2.4. Sales Footprint

            16.1.2.5. Strategy Overview

                16.1.2.5.1. Marketing Strategy

                16.1.2.5.2. Product Strategy

                16.1.2.5.3. Channel Strategy

        16.1.3. Orril

            16.1.3.1. Overview

            16.1.3.2. Product Portfolio

            16.1.3.3. Profitability by Market Segments

            16.1.3.4. Sales Footprint

            16.1.3.5. Strategy Overview

                16.1.3.5.1. Marketing Strategy

                16.1.3.5.2. Product Strategy

                16.1.3.5.3. Channel Strategy

        16.1.4. Oppsme

            16.1.4.1. Overview

            16.1.4.2. Product Portfolio

            16.1.4.3. Profitability by Market Segments

            16.1.4.4. Sales Footprint

            16.1.4.5. Strategy Overview

                16.1.4.5.1. Marketing Strategy

                16.1.4.5.2. Product Strategy

                16.1.4.5.3. Channel Strategy

        16.1.5. Bathla

            16.1.5.1. Overview

            16.1.5.2. Product Portfolio

            16.1.5.3. Profitability by Market Segments

            16.1.5.4. Sales Footprint

            16.1.5.5. Strategy Overview

                16.1.5.5.1. Marketing Strategy

                16.1.5.5.2. Product Strategy

                16.1.5.5.3. Channel Strategy

        16.1.6. Whitmor

            16.1.6.1. Overview

            16.1.6.2. Product Portfolio

            16.1.6.3. Profitability by Market Segments

            16.1.6.4. Sales Footprint

            16.1.6.5. Strategy Overview

                16.1.6.5.1. Marketing Strategy

                16.1.6.5.2. Product Strategy

                16.1.6.5.3. Channel Strategy

        16.1.7. Leifheit

            16.1.7.1. Overview

            16.1.7.2. Product Portfolio

            16.1.7.3. Profitability by Market Segments

            16.1.7.4. Sales Footprint

            16.1.7.5. Strategy Overview

                16.1.7.5.1. Marketing Strategy

                16.1.7.5.2. Product Strategy

                16.1.7.5.3. Channel Strategy

        16.1.8. Brabantia

            16.1.8.1. Overview

            16.1.8.2. Product Portfolio

            16.1.8.3. Profitability by Market Segments

            16.1.8.4. Sales Footprint

            16.1.8.5. Strategy Overview

                16.1.8.5.1. Marketing Strategy

                16.1.8.5.2. Product Strategy

                16.1.8.5.3. Channel Strategy

        16.1.9. Ybm home

            16.1.9.1. Overview

            16.1.9.2. Product Portfolio

            16.1.9.3. Profitability by Market Segments

            16.1.9.4. Sales Footprint

            16.1.9.5. Strategy Overview

                16.1.9.5.1. Marketing Strategy

                16.1.9.5.2. Product Strategy

                16.1.9.5.3. Channel Strategy

        16.1.10. Widemex

            16.1.10.1. Overview

            16.1.10.2. Product Portfolio

            16.1.10.3. Profitability by Market Segments

            16.1.10.4. Sales Footprint

            16.1.10.5. Strategy Overview

                16.1.10.5.1. Marketing Strategy

                16.1.10.5.2. Product Strategy

                16.1.10.5.3. Channel Strategy

17. Assumptions & Acronyms Used

18. Research Methodology

Don't pay for what you don't need

Customize your report by selecting specific countries or regions and save 30%!

List of Tables

Table 1: Global Ironing Table Market Value (US$ Mn) Forecast by Region, 2016-2032

Table 2: Global Ironing Table Market Volume (Units) Forecast by Region, 2016-2032

Table 3: Global Ironing Table Market Value (US$ Mn) Forecast by Classifications, 2016-2032

Table 4: Global Ironing Table Market Volume (Units) Forecast by Classifications, 2016-2032

Table 5: Global Ironing Table Market Value (US$ Mn) Forecast by Applications, 2016-2032

Table 6: Global Ironing Table Market Volume (Units) Forecast by Applications, 2016-2032

Table 7: Global Ironing Table Market Value (US$ Mn) Forecast by Types, 2016-2032

Table 8: Global Ironing Table Market Volume (Units) Forecast by Types, 2016-2032

Table 9: North America Ironing Table Market Value (US$ Mn) Forecast by Country, 2016-2032

Table 10: North America Ironing Table Market Volume (Units) Forecast by Country, 2016-2032

Table 11: North America Ironing Table Market Value (US$ Mn) Forecast by Classifications, 2016-2032

Table 12: North America Ironing Table Market Volume (Units) Forecast by Classifications, 2016-2032

Table 13: North America Ironing Table Market Value (US$ Mn) Forecast by Applications, 2016-2032

Table 14: North America Ironing Table Market Volume (Units) Forecast by Applications, 2016-2032

Table 15: North America Ironing Table Market Value (US$ Mn) Forecast by Types, 2016-2032

Table 16: North America Ironing Table Market Volume (Units) Forecast by Types, 2016-2032

Table 17: Latin America Ironing Table Market Value (US$ Mn) Forecast by Country, 2016-2032

Table 18: Latin America Ironing Table Market Volume (Units) Forecast by Country, 2016-2032

Table 19: Latin America Ironing Table Market Value (US$ Mn) Forecast by Classifications, 2016-2032

Table 20: Latin America Ironing Table Market Volume (Units) Forecast by Classifications, 2016-2032

Table 21: Latin America Ironing Table Market Value (US$ Mn) Forecast by Applications, 2016-2032

Table 22: Latin America Ironing Table Market Volume (Units) Forecast by Applications, 2016-2032

Table 23: Latin America Ironing Table Market Value (US$ Mn) Forecast by Types, 2016-2032

Table 24: Latin America Ironing Table Market Volume (Units) Forecast by Types, 2016-2032

Table 25: Europe Ironing Table Market Value (US$ Mn) Forecast by Country, 2016-2032

Table 26: Europe Ironing Table Market Volume (Units) Forecast by Country, 2016-2032

Table 27: Europe Ironing Table Market Value (US$ Mn) Forecast by Classifications, 2016-2032

Table 28: Europe Ironing Table Market Volume (Units) Forecast by Classifications, 2016-2032

Table 29: Europe Ironing Table Market Value (US$ Mn) Forecast by Applications, 2016-2032

Table 30: Europe Ironing Table Market Volume (Units) Forecast by Applications, 2016-2032

Table 31: Europe Ironing Table Market Value (US$ Mn) Forecast by Types, 2016-2032

Table 32: Europe Ironing Table Market Volume (Units) Forecast by Types, 2016-2032

Table 33: Asia Pacific Ironing Table Market Value (US$ Mn) Forecast by Country, 2016-2032

Table 34: Asia Pacific Ironing Table Market Volume (Units) Forecast by Country, 2016-2032

Table 35: Asia Pacific Ironing Table Market Value (US$ Mn) Forecast by Classifications, 2016-2032

Table 36: Asia Pacific Ironing Table Market Volume (Units) Forecast by Classifications, 2016-2032

Table 37: Asia Pacific Ironing Table Market Value (US$ Mn) Forecast by Applications, 2016-2032

Table 38: Asia Pacific Ironing Table Market Volume (Units) Forecast by Applications, 2016-2032

Table 39: Asia Pacific Ironing Table Market Value (US$ Mn) Forecast by Types, 2016-2032

Table 40: Asia Pacific Ironing Table Market Volume (Units) Forecast by Types, 2016-2032

Table 41: MEA Ironing Table Market Value (US$ Mn) Forecast by Country, 2016-2032

Table 42: MEA Ironing Table Market Volume (Units) Forecast by Country, 2016-2032

Table 43: MEA Ironing Table Market Value (US$ Mn) Forecast by Classifications, 2016-2032

Table 44: MEA Ironing Table Market Volume (Units) Forecast by Classifications, 2016-2032

Table 45: MEA Ironing Table Market Value (US$ Mn) Forecast by Applications, 2016-2032

Table 46: MEA Ironing Table Market Volume (Units) Forecast by Applications, 2016-2032

Table 47: MEA Ironing Table Market Value (US$ Mn) Forecast by Types, 2016-2032

Table 48: MEA Ironing Table Market Volume (Units) Forecast by Types, 2016-2032
Sneha Verghese
Sneha Verghese

Principal Consultant

Talk to Analyst

Find your sweet spots for generating winning opportunities in this market.

List of Charts

Figure 1: Global Ironing Table Market Value (US$ Mn) by Classifications, 2022-2032

Figure 2: Global Ironing Table Market Value (US$ Mn) by Applications, 2022-2032

Figure 3: Global Ironing Table Market Value (US$ Mn) by Types, 2022-2032

Figure 4: Global Ironing Table Market Value (US$ Mn) by Region, 2022-2032

Figure 5: Global Ironing Table Market Value (US$ Mn) Analysis by Region, 2016-2032

Figure 6: Global Ironing Table Market Volume (Units) Analysis by Region, 2016-2032

Figure 7: Global Ironing Table Market Value Share (%) and BPS Analysis by Region, 2022-2032

Figure 8: Global Ironing Table Market Y-o-Y Growth (%) Projections by Region, 2022-2032

Figure 9: Global Ironing Table Market Value (US$ Mn) Analysis by Classifications, 2016-2032

Figure 10: Global Ironing Table Market Volume (Units) Analysis by Classifications, 2016-2032

Figure 11: Global Ironing Table Market Value Share (%) and BPS Analysis by Classifications, 2022-2032

Figure 12: Global Ironing Table Market Y-o-Y Growth (%) Projections by Classifications, 2022-2032

Figure 13: Global Ironing Table Market Value (US$ Mn) Analysis by Applications, 2016-2032

Figure 14: Global Ironing Table Market Volume (Units) Analysis by Applications, 2016-2032

Figure 15: Global Ironing Table Market Value Share (%) and BPS Analysis by Applications, 2022-2032

Figure 16: Global Ironing Table Market Y-o-Y Growth (%) Projections by Applications, 2022-2032

Figure 17: Global Ironing Table Market Value (US$ Mn) Analysis by Types, 2016-2032

Figure 18: Global Ironing Table Market Volume (Units) Analysis by Types, 2016-2032

Figure 19: Global Ironing Table Market Value Share (%) and BPS Analysis by Types, 2022-2032

Figure 20: Global Ironing Table Market Y-o-Y Growth (%) Projections by Types, 2022-2032

Figure 21: Global Ironing Table Market Attractiveness by Classifications, 2022-2032

Figure 22: Global Ironing Table Market Attractiveness by Applications, 2022-2032

Figure 23: Global Ironing Table Market Attractiveness by Types, 2022-2032

Figure 24: Global Ironing Table Market Attractiveness by Region, 2022-2032

Figure 25: North America Ironing Table Market Value (US$ Mn) by Classifications, 2022-2032

Figure 26: North America Ironing Table Market Value (US$ Mn) by Applications, 2022-2032

Figure 27: North America Ironing Table Market Value (US$ Mn) by Types, 2022-2032

Figure 28: North America Ironing Table Market Value (US$ Mn) by Country, 2022-2032

Figure 29: North America Ironing Table Market Value (US$ Mn) Analysis by Country, 2016-2032

Figure 30: North America Ironing Table Market Volume (Units) Analysis by Country, 2016-2032

Figure 31: North America Ironing Table Market Value Share (%) and BPS Analysis by Country, 2022-2032

Figure 32: North America Ironing Table Market Y-o-Y Growth (%) Projections by Country, 2022-2032

Figure 33: North America Ironing Table Market Value (US$ Mn) Analysis by Classifications, 2016-2032

Figure 34: North America Ironing Table Market Volume (Units) Analysis by Classifications, 2016-2032

Figure 35: North America Ironing Table Market Value Share (%) and BPS Analysis by Classifications, 2022-2032

Figure 36: North America Ironing Table Market Y-o-Y Growth (%) Projections by Classifications, 2022-2032

Figure 37: North America Ironing Table Market Value (US$ Mn) Analysis by Applications, 2016-2032

Figure 38: North America Ironing Table Market Volume (Units) Analysis by Applications, 2016-2032

Figure 39: North America Ironing Table Market Value Share (%) and BPS Analysis by Applications, 2022-2032

Figure 40: North America Ironing Table Market Y-o-Y Growth (%) Projections by Applications, 2022-2032

Figure 41: North America Ironing Table Market Value (US$ Mn) Analysis by Types, 2016-2032

Figure 42: North America Ironing Table Market Volume (Units) Analysis by Types, 2016-2032

Figure 43: North America Ironing Table Market Value Share (%) and BPS Analysis by Types, 2022-2032

Figure 44: North America Ironing Table Market Y-o-Y Growth (%) Projections by Types, 2022-2032

Figure 45: North America Ironing Table Market Attractiveness by Classifications, 2022-2032

Figure 46: North America Ironing Table Market Attractiveness by Applications, 2022-2032

Figure 47: North America Ironing Table Market Attractiveness by Types, 2022-2032

Figure 48: North America Ironing Table Market Attractiveness by Country, 2022-2032

Figure 49: Latin America Ironing Table Market Value (US$ Mn) by Classifications, 2022-2032

Figure 50: Latin America Ironing Table Market Value (US$ Mn) by Applications, 2022-2032

Figure 51: Latin America Ironing Table Market Value (US$ Mn) by Types, 2022-2032

Figure 52: Latin America Ironing Table Market Value (US$ Mn) by Country, 2022-2032

Figure 53: Latin America Ironing Table Market Value (US$ Mn) Analysis by Country, 2016-2032

Figure 54: Latin America Ironing Table Market Volume (Units) Analysis by Country, 2016-2032

Figure 55: Latin America Ironing Table Market Value Share (%) and BPS Analysis by Country, 2022-2032

Figure 56: Latin America Ironing Table Market Y-o-Y Growth (%) Projections by Country, 2022-2032

Figure 57: Latin America Ironing Table Market Value (US$ Mn) Analysis by Classifications, 2016-2032

Figure 58: Latin America Ironing Table Market Volume (Units) Analysis by Classifications, 2016-2032

Figure 59: Latin America Ironing Table Market Value Share (%) and BPS Analysis by Classifications, 2022-2032

Figure 60: Latin America Ironing Table Market Y-o-Y Growth (%) Projections by Classifications, 2022-2032

Figure 61: Latin America Ironing Table Market Value (US$ Mn) Analysis by Applications, 2016-2032

Figure 62: Latin America Ironing Table Market Volume (Units) Analysis by Applications, 2016-2032

Figure 63: Latin America Ironing Table Market Value Share (%) and BPS Analysis by Applications, 2022-2032

Figure 64: Latin America Ironing Table Market Y-o-Y Growth (%) Projections by Applications, 2022-2032

Figure 65: Latin America Ironing Table Market Value (US$ Mn) Analysis by Types, 2016-2032

Figure 66: Latin America Ironing Table Market Volume (Units) Analysis by Types, 2016-2032

Figure 67: Latin America Ironing Table Market Value Share (%) and BPS Analysis by Types, 2022-2032

Figure 68: Latin America Ironing Table Market Y-o-Y Growth (%) Projections by Types, 2022-2032

Figure 69: Latin America Ironing Table Market Attractiveness by Classifications, 2022-2032

Figure 70: Latin America Ironing Table Market Attractiveness by Applications, 2022-2032

Figure 71: Latin America Ironing Table Market Attractiveness by Types, 2022-2032

Figure 72: Latin America Ironing Table Market Attractiveness by Country, 2022-2032

Figure 73: Europe Ironing Table Market Value (US$ Mn) by Classifications, 2022-2032

Figure 74: Europe Ironing Table Market Value (US$ Mn) by Applications, 2022-2032

Figure 75: Europe Ironing Table Market Value (US$ Mn) by Types, 2022-2032

Figure 76: Europe Ironing Table Market Value (US$ Mn) by Country, 2022-2032

Figure 77: Europe Ironing Table Market Value (US$ Mn) Analysis by Country, 2016-2032

Figure 78: Europe Ironing Table Market Volume (Units) Analysis by Country, 2016-2032

Figure 79: Europe Ironing Table Market Value Share (%) and BPS Analysis by Country, 2022-2032

Figure 80: Europe Ironing Table Market Y-o-Y Growth (%) Projections by Country, 2022-2032

Figure 81: Europe Ironing Table Market Value (US$ Mn) Analysis by Classifications, 2016-2032

Figure 82: Europe Ironing Table Market Volume (Units) Analysis by Classifications, 2016-2032

Figure 83: Europe Ironing Table Market Value Share (%) and BPS Analysis by Classifications, 2022-2032

Figure 84: Europe Ironing Table Market Y-o-Y Growth (%) Projections by Classifications, 2022-2032

Figure 85: Europe Ironing Table Market Value (US$ Mn) Analysis by Applications, 2016-2032

Figure 86: Europe Ironing Table Market Volume (Units) Analysis by Applications, 2016-2032

Figure 87: Europe Ironing Table Market Value Share (%) and BPS Analysis by Applications, 2022-2032

Figure 88: Europe Ironing Table Market Y-o-Y Growth (%) Projections by Applications, 2022-2032

Figure 89: Europe Ironing Table Market Value (US$ Mn) Analysis by Types, 2016-2032

Figure 90: Europe Ironing Table Market Volume (Units) Analysis by Types, 2016-2032

Figure 91: Europe Ironing Table Market Value Share (%) and BPS Analysis by Types, 2022-2032

Figure 92: Europe Ironing Table Market Y-o-Y Growth (%) Projections by Types, 2022-2032

Figure 93: Europe Ironing Table Market Attractiveness by Classifications, 2022-2032

Figure 94: Europe Ironing Table Market Attractiveness by Applications, 2022-2032

Figure 95: Europe Ironing Table Market Attractiveness by Types, 2022-2032

Figure 96: Europe Ironing Table Market Attractiveness by Country, 2022-2032

Figure 97: Asia Pacific Ironing Table Market Value (US$ Mn) by Classifications, 2022-2032

Figure 98: Asia Pacific Ironing Table Market Value (US$ Mn) by Applications, 2022-2032

Figure 99: Asia Pacific Ironing Table Market Value (US$ Mn) by Types, 2022-2032

Figure 100: Asia Pacific Ironing Table Market Value (US$ Mn) by Country, 2022-2032

Figure 101: Asia Pacific Ironing Table Market Value (US$ Mn) Analysis by Country, 2016-2032

Figure 102: Asia Pacific Ironing Table Market Volume (Units) Analysis by Country, 2016-2032

Figure 103: Asia Pacific Ironing Table Market Value Share (%) and BPS Analysis by Country, 2022-2032

Figure 104: Asia Pacific Ironing Table Market Y-o-Y Growth (%) Projections by Country, 2022-2032

Figure 105: Asia Pacific Ironing Table Market Value (US$ Mn) Analysis by Classifications, 2016-2032

Figure 106: Asia Pacific Ironing Table Market Volume (Units) Analysis by Classifications, 2016-2032

Figure 107: Asia Pacific Ironing Table Market Value Share (%) and BPS Analysis by Classifications, 2022-2032

Figure 108: Asia Pacific Ironing Table Market Y-o-Y Growth (%) Projections by Classifications, 2022-2032

Figure 109: Asia Pacific Ironing Table Market Value (US$ Mn) Analysis by Applications, 2016-2032

Figure 110: Asia Pacific Ironing Table Market Volume (Units) Analysis by Applications, 2016-2032

Figure 111: Asia Pacific Ironing Table Market Value Share (%) and BPS Analysis by Applications, 2022-2032

Figure 112: Asia Pacific Ironing Table Market Y-o-Y Growth (%) Projections by Applications, 2022-2032

Figure 113: Asia Pacific Ironing Table Market Value (US$ Mn) Analysis by Types, 2016-2032

Figure 114: Asia Pacific Ironing Table Market Volume (Units) Analysis by Types, 2016-2032

Figure 115: Asia Pacific Ironing Table Market Value Share (%) and BPS Analysis by Types, 2022-2032

Figure 116: Asia Pacific Ironing Table Market Y-o-Y Growth (%) Projections by Types, 2022-2032

Figure 117: Asia Pacific Ironing Table Market Attractiveness by Classifications, 2022-2032

Figure 118: Asia Pacific Ironing Table Market Attractiveness by Applications, 2022-2032

Figure 119: Asia Pacific Ironing Table Market Attractiveness by Types, 2022-2032

Figure 120: Asia Pacific Ironing Table Market Attractiveness by Country, 2022-2032

Figure 121: MEA Ironing Table Market Value (US$ Mn) by Classifications, 2022-2032

Figure 122: MEA Ironing Table Market Value (US$ Mn) by Applications, 2022-2032

Figure 123: MEA Ironing Table Market Value (US$ Mn) by Types, 2022-2032

Figure 124: MEA Ironing Table Market Value (US$ Mn) by Country, 2022-2032

Figure 125: MEA Ironing Table Market Value (US$ Mn) Analysis by Country, 2016-2032

Figure 126: MEA Ironing Table Market Volume (Units) Analysis by Country, 2016-2032

Figure 127: MEA Ironing Table Market Value Share (%) and BPS Analysis by Country, 2022-2032

Figure 128: MEA Ironing Table Market Y-o-Y Growth (%) Projections by Country, 2022-2032

Figure 129: MEA Ironing Table Market Value (US$ Mn) Analysis by Classifications, 2016-2032

Figure 130: MEA Ironing Table Market Volume (Units) Analysis by Classifications, 2016-2032

Figure 131: MEA Ironing Table Market Value Share (%) and BPS Analysis by Classifications, 2022-2032

Figure 132: MEA Ironing Table Market Y-o-Y Growth (%) Projections by Classifications, 2022-2032

Figure 133: MEA Ironing Table Market Value (US$ Mn) Analysis by Applications, 2016-2032

Figure 134: MEA Ironing Table Market Volume (Units) Analysis by Applications, 2016-2032

Figure 135: MEA Ironing Table Market Value Share (%) and BPS Analysis by Applications, 2022-2032

Figure 136: MEA Ironing Table Market Y-o-Y Growth (%) Projections by Applications, 2022-2032

Figure 137: MEA Ironing Table Market Value (US$ Mn) Analysis by Types, 2016-2032

Figure 138: MEA Ironing Table Market Volume (Units) Analysis by Types, 2016-2032

Figure 139: MEA Ironing Table Market Value Share (%) and BPS Analysis by Types, 2022-2032

Figure 140: MEA Ironing Table Market Y-o-Y Growth (%) Projections by Types, 2022-2032

Figure 141: MEA Ironing Table Market Attractiveness by Classifications, 2022-2032

Figure 142: MEA Ironing Table Market Attractiveness by Applications, 2022-2032

Figure 143: MEA Ironing Table Market Attractiveness by Types, 2022-2032

Figure 144: MEA Ironing Table Market Attractiveness by Country, 2022-2032

Recommendations

Consumer Product

Laundry Care Market

Published : June 2023

Consumer Product

Bulletin Boards Market

Published : January 2023

Consumer Product

Apparel Re-commerce Market

Published : October 2022

Consumer Product

Cutting Boards Market

Published : September 2022

Explore Consumer Product Insights

View Reports