Tablets for Oral Suspension Market Size and Share Forecast Outlook 2025 to 2035

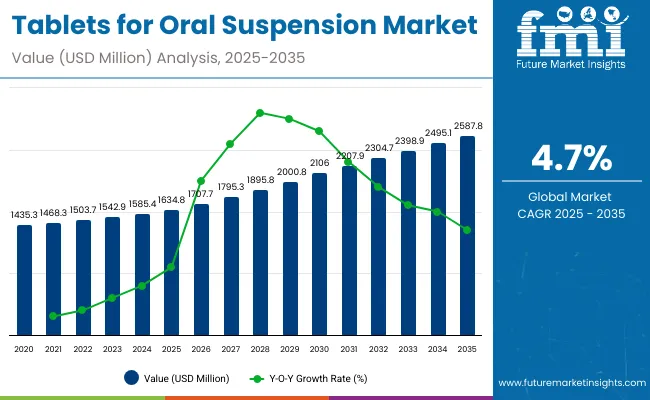
The global Tablets for Oral Suspension (ToOS) Market is projected to reach a valuation of USD 1,634.8 million by 2025 and USD 2,587.8 million by 2035. This indicates a decade-long increase of USD 953.0 million between 2025 and 2035. The market is expected to expand at a compound annual growth rate (CAGR) of 4.7%, representing a 1.58X increase over the ten-year period.

During the first five-year period from 2025 to 2030, the total market value is projected to expand from USD 1,634.8 million to USD 2,056.8 million, adding USD 471.2 million which contributes to 49.4% of the total decade growth. The Immediate-Release ToOS segment will remain dominant, holding around 51.7% share of the category by 2030 due to its widespread use in pediatric and infectious disease treatments. Flavored/Pediatric ToOS will strengthen to above 23.9% share, reflecting global efforts by UNICEF and national health programs to improve pediatric adherence, while Extended-Release ToOS maintains stable demand at approximately 18%.

The second half from 2030 to 2035 contributes USD 481.8 million, equal to 50.6% of the total growth, as the market jumps from USD 2,056.8 million to USD 2,587.8 million. This acceleration is powered by the rising adoption of ToOS formulations across Asia and emerging economies where cold-chain challenges favor solid dispersible formats. Anti-Infectives/Antibiotics and Gastrointestinal disorder treatments together capture nearly 65.0% of therapeutic share by the end of the decade, while Pain & Fever Management grows its share to 14.6%. Distribution remains led by institutional channels, which consistently account for over 58.0% of global demand, followed by retail pharmacies and a gradually expanding online pharmacy presence.
Quick Stats for Tablets for Oral Suspension (ToOS) Market

  • Industry Value (2025): USD 1,634.8 million
  • Forecast Value (2035): USD 2,587.8 million
  • Forecast CAGR: 4.7%
  • Leading Segment in 2025: Immediate-Release ToOS (53.3% share)
  • Key Growth Region: Asia (China, India), Europe (France, UK)
  • Top Key Players: Pfizer Inc., Merck & Co., Novartis AG, AstraZeneca plc, Johnson & Johnson, Lupin Limited, Amneal Pharmaceuticals

Tablets For Oral Suspension Market Value Analysis

Metric Value
Industry Size (2025E) USD 1,634.8 million
Industry Value (2035F) USD 2,587.8 million
CAGR (2025 to 2035) 4.7%

From 2020 to 2024, the overall Tablets for Oral Suspension (ToOS) Market expanded from USD 1,435.3 million to USD 1,585.4 million, registering a historical CAGR of 3.6%. Growth was largely supported by leading pharmaceutical manufacturers such as Pfizer Inc., Merck & Co., Novartis AG, AstraZeneca plc, and Johnson & Johnson, which collectively account for a significant share of the market through their pediatric anti-infective and gastrointestinal portfolios. Key strategies deployed by these players include expanding dispersible and flavored pediatric formulations, integrating taste-masking technologies, and aligning with global health procurement programs such as UNICEF and WHO essential medicine lists.

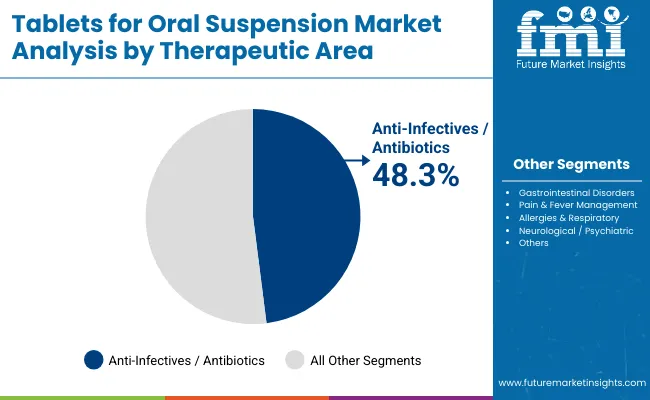
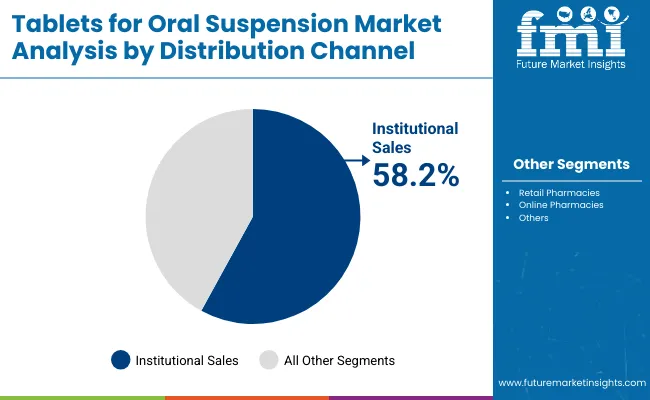
In 2025, the Tablets for Oral Suspension market is expected to reach a value of approximately USD 1,634.8 million, driven by the continued shift from liquid suspensions and powders toward solid dispersible formats that improve dosing accuracy, portability, and shelf stability. Market growth is reinforced by large-scale institutional demand, as institutional sales are projected to account for 58.2% of distribution in 2025, reflecting adoption in national immunization, deworming, and infectious disease programs. Therapeutically, anti-infectives/antibiotics will remain the leading segment with 48.3% share, while flavored/pediatric ToOS captures over 21.0% of the product mix, signaling global prioritization of child-friendly formulations. The category’s resilience is also supported by regional dynamics China and India are expected to record the highest growth rates at 5.7% and 5.3% CAGR respectively, while mature markets such as the USA and Europe will expand more modestly.

Why Is This Market Growing?

The Tablets for Oral Suspension (ToOS) Market is witnessing strong growth as global healthcare systems prioritize child-friendly and accessible dosage forms that ensure accurate administration, stability, and portability. Major drivers include the WHO and UNICEF push for dispersible formulations on essential medicine lists, rising prevalence of pediatric infectious diseases, and the need for alternatives to liquid suspensions that often require cold chain and reconstitution.

Innovations such as taste-masked flavored tablets, effervescent dispersible formats, and extended-release profiles are reducing compliance challenges, particularly among children and elderly patients with swallowing difficulties. Public health programs, including school-based deworming campaigns and antibiotic distribution, are generating sustained institutional demand, while retail pharmacies and e-pharmacies expand availability for home care.

The pandemic further amplified the importance of convenient solid-dosage therapies, accelerating adoption in low-resource settings where liquid storage is limited. With governments and procurement agencies emphasizing cost efficiency, stability, and dosing safety, manufacturers delivering robust dispersibility, palatability, and WHO prequalification are achieving accelerated growth. In high-growth regions such as Asia and Africa, expanding pediatric healthcare infrastructure and mass-drug-administration initiatives are further propelling demand.

Segmental Analysis

The market is segmented by product type, therapeutic area, distribution channel, and region. Product categories include Immediate-Release ToOS, Extended-Release ToOS, Flavored/Pediatric ToOS, Buffered ToOS, and Effervescent ToOS, highlighting the key dosage innovations driving adoption. Therapeutic segmentation covers Anti-Infectives/Antibiotics, Gastrointestinal Disorders, Pain & Fever Management, Allergies & Respiratory, Neurological/Psychiatric, and Others, reflecting the broad clinical application base. Based on distribution channel, the market is classified into Institutional Sales, Retail Pharmacy, Online Pharmacies, and Others. Regionally, the scope spans North America, Latin America, Western and Eastern Europe, East Asia, South Asia & Pacific, and the Middle East and Africa.
Insights into the Product Segment with Immediate-Release ToOS Leading in Market Share

Tablets For Oral Suspension Market By Product

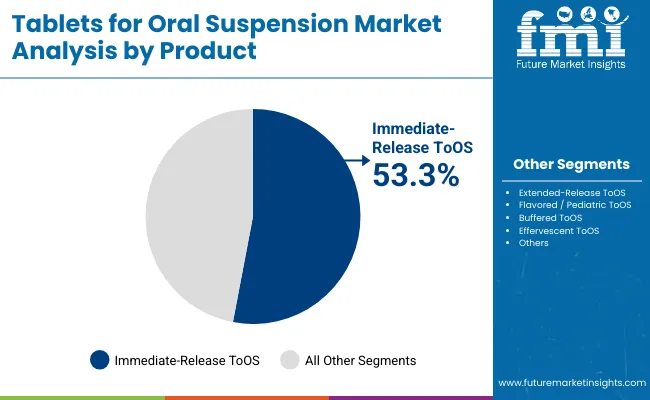
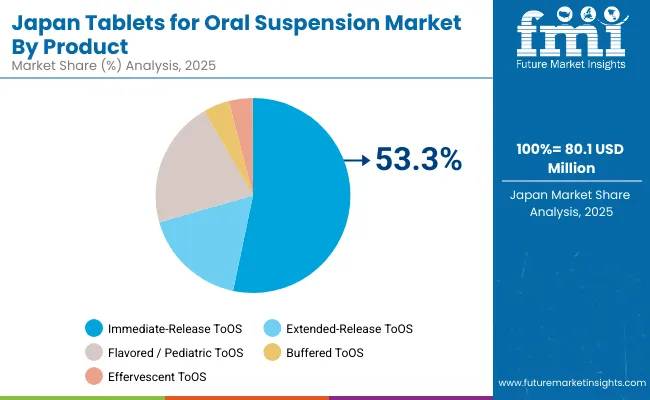
Immediate-Release Tablets for Oral Suspension are expected to retain a dominant position, contributing 53.3% in 2025, driven by their widespread use in pediatric and infectious disease treatments where rapid dispersion and reliable dosing are critical. Their adoption has been accelerated by global health initiatives, particularly UNICEF and WHO programs, which prioritize dispersible antibiotics and antiparasitics for child-friendly administration. These formulations are preferred for their ease of use, fast disintegration in water, and ability to deliver immediate therapeutic effect without complex dosing schedules. Growing procurement by institutional buyers, coupled with rising caregiver preference for simple and effective pediatric formats, has ensured sustained demand for Immediate-Release ToOS over other product types.

Product Market Share (%)
Immediate-Release ToOS 53.3%
Extended-Release ToOS 17.3%
Flavored / Pediatric ToOS 21.1%
Buffered ToOS 4.3%
Effervescent ToOS 4.0%

Insights into the Therapeutic Area Segment with Anti-Infectives/Antibiotics Dominating the Demand

Tablets For Oral Suspension Market By Therapeutic Area

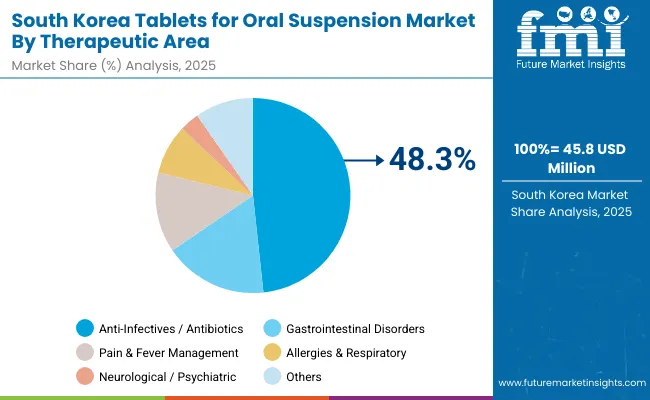
Anti-Infectives and Antibiotics have emerged as the leading therapeutic application, projected to account for 48.3% of demand in 2025. Their dominance is driven by the high global burden of pediatric and community-acquired infections, alongside large-scale public health initiatives such as school-based deworming and UNICEF-supported antibiotic programs.

Tablets for Oral Suspension in this category are favored due to their ease of administration, stable shelf-life compared to liquid suspensions, and suitability for mass drug administration in low-resource settings. With increasing antimicrobial stewardship and a focus on child-friendly formulations, dispersible antibiotics continue to anchor institutional procurement, making this segment the backbone of the market compared to other therapeutic areas.

By Therapeutic Area Market Share (%)
Anti-Infectives / Antibiotics 48.30%
Gastrointestinal Disorders 17.20%
Pain & Fever Management 13.32%
Allergies & Respiratory 8.20%
Neurological / Psychiatric 3.30%
Others 9.7%

Insights into the Distribution Channel Segment with Institutional Sales Leading the Demand

Tablets For Oral Suspension Market By Distribution Channel

Institutional Sales are expected to remain the largest distribution channel, contributing around 58.2% in 2025, owing to large-scale government procurement programs and public health initiatives. National immunization drives, school-based deworming campaigns, and UNICEF-supported antibiotic distribution have reinforced the dominance of institutional supply over other channels. Hospitals and public healthcare networks prefer Tablets for Oral Suspension due to their cost efficiency, stability, and ease of administration in high-volume settings.

While Retail Pharmacies account for 32.3% and remain significant for household purchases, Online Pharmacies at 6.4% are steadily growing as digital platforms gain traction. The “Others” category, at 3.0%, covers distribution through NGOs and community-based health programs, adding incremental but vital demand.

Distribution Channel Market Share (%)
Institutional Sales 58.2%
Retail Pharmacies 32.3%
Online Pharmacies 6.4%
Others 3.0%

Expansion of Pediatric-Friendly Formulations Driving Market Growth

A major growth driver in the Tablets for Oral Suspension (ToOS) market is the global prioritization of pediatric-friendly formulations endorsed by WHO and UNICEF. Programs promoting dispersible antibiotics, antimalarials, and antiparasitics have accelerated demand for ToOS, particularly in low- and middle-income countries where liquid suspensions are difficult to transport and store. Immediate-release and flavored/pediatric tablets are being procured in bulk for school-based deworming and infectious disease control programs, accounting for over 50% share of product use.

In addition, regulatory bodies increasingly require child-appropriate dosage forms in national formularies, compelling manufacturers to innovate with taste-masking, effervescent, and buffered technologies. This regulatory and public health push ensures a long-term anchor for ToOS adoption across institutional supply chains.

Price Pressure and Tender-Driven Procurement as Key Barrier

A critical restraint for the ToOS market is the price sensitivity of institutional tenders that dominate global demand. Large-scale procurement by UNICEF, GAVI, and national health ministries focuses heavily on cost efficiency, often awarding contracts to suppliers offering the lowest bids. This dynamic places immense pressure on pharmaceutical companies to sustain margins while investing in quality improvements such as taste-masking or stability enhancement.

Furthermore, stringent WHO prequalification standards increase compliance costs, which many small or mid-tier manufacturers struggle to meet. As a result, innovation in premium segments like extended-release or effervescent ToOS is often deprioritized, limiting broader portfolio diversification.

Rising Role of Digital Pharmacies and E-Health Platforms

A defining trend in the ToOS market is the growing integration with digital pharmacies and e-health platforms, especially in Asia-Pacific and urban regions of Europe. Online channels are projected to rise from 6.4% in 2025 to 7.3% by 2035, supported by expanding telehealth consultations and home delivery of pediatric and geriatric medicines.

Parents increasingly prefer online purchases of flavored and pediatric dispersible tablets due to convenience, while subscription-based e-pharmacy models offer recurring delivery of chronic-use formulations. This shift is also encouraging global manufacturers like Pfizer and Novartis to expand distribution partnerships with e-commerce leaders and regional pharmacy apps. The trend signals a gradual but strategic transition where digital platforms become a recognized procurement pathway for child-appropriate oral formulations, complementing traditional retail and institutional sales.
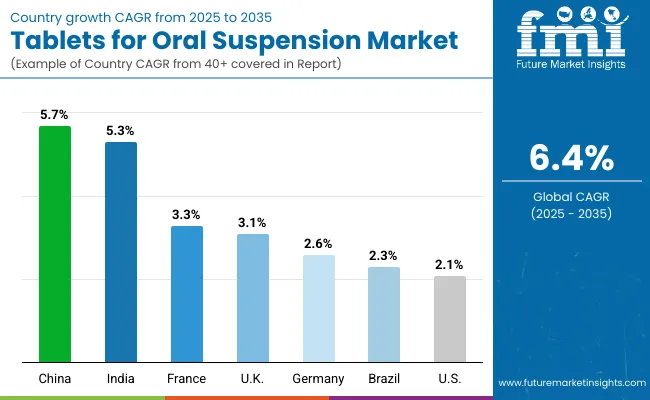
Analysis of Tablets for Oral Suspension Market By Key Countries

Country Wise Analysis Of Tablets For Oral Suspension Market

Country CAGR
USA 2.1%
Brazil 2.3%
China 5.7%
India 5.3%
Europe 2.8%
Germany 2.6%
France 3.3%
UK 3.1%

Asia Pacific is set to emerge as the fastest-growing region in the Tablets for Oral Suspension (ToOS) market, projected to expand at a CAGR of 5.7% in China and 5.3% in India between 2025 and 2035. China’s growth is supported by large-scale government procurement of dispersible antibiotics and antiparasitics, while India’s expansion is driven by school-based deworming programs and inclusion of dispersible pediatric formulations in national health initiatives. Both markets benefit from the high pediatric population base, cost-sensitive procurement policies, and growing alignment with WHO/UNICEF essential medicines programs. Mass drug administration campaigns across Southeast Asia are further amplifying regional demand.

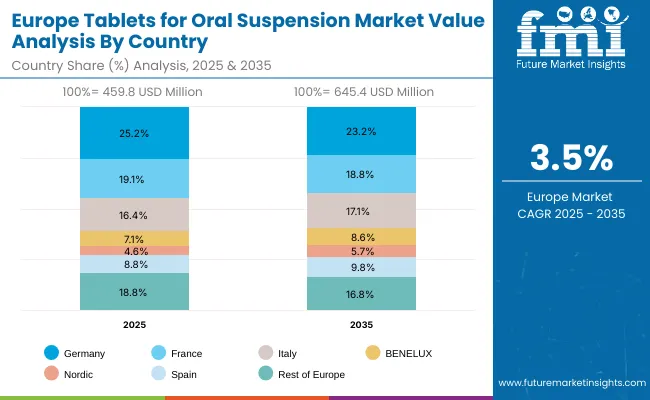
Europe is expected to grow steadily at a 2.8% CAGR through 2035, with Germany is expected to grow at 2.6% CAGR and with 3.1% CAGR for the UK due to expanded pediatric healthcare infrastructure and adoption of flavored dispersible tablets to improve compliance. France is projected to grow at 3.3% CAGR, supported by public hospital procurement reforms. The European market benefits from harmonized EMA guidelines promoting child-appropriate dosage forms, and manufacturers are increasingly targeting flavored and buffered ToOS for better patient adherence.

North America remains a mature but stable market, with the USA projected to grow at a 2.1% CAGR between 2025 to 2035. Growth is anchored by replacement of legacy pediatric liquid formulations with solid dispersible formats that ensure accurate dosing and improved stability. Institutional procurement continues to dominate, but retail and online pharmacy channels are steadily expanding, reflecting caregiver preference for flavored pediatric ToOS. Federal pediatric health initiatives and rising chronic disease management in geriatric populations are expected to sustain long-term demand.

Sales Outlook for Tablets for Oral Suspension in the United States

The USA ToOS market is forecasted to grow at a 2.1% CAGR, driven by rising pediatric demand for dispersible antibiotics and antipyretics. Hospitals and pediatric clinics are gradually replacing conventional syrups with flavored and immediate-release dispersible formats, supported by FDA encouragement of child-appropriate dosage forms. Institutional procurement remains dominant, but retail and e-pharmacy distribution are expanding as caregivers prefer portable, spill-free alternatives.

  • Hospitals and pediatric departments are adopting dispersible antibiotics for accurate dosing and stability.
  • Retail pharmacies continue to support demand for flavored ToOS in fever and GI management.
  • E-pharmacies are increasingly delivering flavored/pediatric dispersible directly to households.

Growth and Expansion Outlook for Tablets for Oral Suspension in the United Kingdom

The ToOS market in the United Kingdom is projected to grow at a 3.1% CAGR through 2035, supported by NHS programs prioritizing child-friendly formulations in essential medicine lists. Public procurement under NHS England’s modernization programs is boosting adoption of dispersible antibiotics and antiparasitics in pediatric care. Compliance initiatives to reduce dosing errors and improve treatment adherence are reinforcing demand.

  • NHS Trust hospitals are adopting dispersible formulations for pediatric infectious diseases.
  • Community pharmacies are expanding access to flavored ToOS for home-based care.
  • E-health initiatives are integrating ToOS supply into digital prescription models.

In-depth Analysis of Tablets for Oral Suspension in Germany

The German ToOS market is expected to grow at a 2.6% CAGR, underpinned by inclusion of dispersible pediatric medicines in statutory health insurance coverage. Germany’s strong pediatric and primary care infrastructure supports consistent procurement of immediate-release and flavored ToOS. Regulatory pressure for child-appropriate medicines under EMA guidelines is pushing pharmaceutical manufacturers to expand dispersible product lines.
  • University hospitals are procuring dispersibles for infectious disease and fever management.
  • Community pharmacies are seeing steady sales of flavored/pediatric ToOS.
  • Public insurance coverage is ensuring affordable access to ToOS for broad patient groups.

Europe Tablets for Oral Suspension Market Value Analysis By Country

Europe Tablets For Oral Suspension Market

Market Expansion Outlook for Tablets for Oral Suspension Market in India

The Tablets for Oral Suspension (ToOS) market in India is projected to grow steadily at a CAGR of 5.3% through 2035, supported by large-scale public health programs, expanding pediatric care, and rising private hospital adoption. A shift away from liquid syrups toward dispersible tablets is reshaping the prescribing landscape, driven by their portability, stability, and ease of administration.

Domestic manufacturers are innovating with flavored and taste-masked dispersibles, while e-pharmacies and retail chains expand reach to Tier 2 and Tier 3 cities. Multinational firms are also entering via partnerships, introducing advanced immediate-release technologies.

  • Private multi-specialty hospitals are stocking ToOS for pediatric antibiotics and antiparasitics.
  • Teaching hospitals are standardizing flavored dispersibles in pediatric protocols.
  • Pharmacy chains in Tier 2 cities are expanding affordable ToOS access.

Sales Outlook for Tablets for Oral Suspension Market in China

The ToOS market in China is projected to grow at a CAGR of 5.7% through 2035, supported by Healthy China 2030 priorities for pediatric adherence and primary-care access. Class-A urban hospital is leading bulk procurement of flavored and effervescent dispersibles to improve compliance, while county hospitals deploy immediate-release ToOS for high-volume antibiotic regimens. Longer shelf-life and easier storage versus liquids are key advantages for centralized pharmacy operations. Domestic manufacturers are scaling localized production and integrating digital prescribing and e-pharmacy fulfillment to meet provincial tender requirements.
  • Urban tertiary hospitals prioritize flavored ToOS for pediatric infectious diseases.
  • County hospitals standardize immediate-release dispersibles for mass regimens.
  • Domestic producers scale cost-efficient ToOS aligned to provincial tenders.

Growth Outlook of Tablets for Oral Suspension Market in Japan

Japan Tablets For Oral Suspension Market

The ToOS market in Japan is projected to reach USD 80.1 million in 2025 and grow at a 3.3% CAGR to USD 110.8 million by 2035, reflecting Japan’s focus on patient-friendly dosing for pediatrics and geriatrics. Flavored and buffered tablets are increasingly prescribed to mitigate swallowing difficulties and dosing errors in care homes and pediatric wards. MHLW emphasis on adherence, combined with high quality standards, is prompting local manufacturers to prioritize taste-masking and rapid dispersion performance.

Government insurance coverage and universal healthcare ensure widespread reimbursement, while pharmaceutical companies invest in flavor-masked and rapidly dispersing formulations for oncology, cardiovascular, and infectious disease therapies.
  • Market in Japan is USD 80.1 million in 2025.
  • Market in Japan holds 4.9% revenue share of the global market in 2025
  • Flavored/buffered ToOS gain traction for pediatrics and elderly care.

Opportunity Analysis of Tablets for Oral Suspension Market in South Korea

South Korea Tablets For Oral Suspension Market

The ToOS market in South Korea is estimated at USD 45.8 million in 2025, with growth projected at a 4.6% CAGR through 2035. MOHW programs to improve pediatric adherence and broaden community access are pushing hospitals to procure immediate-release and flavored dispersible for antibiotics, fever, and GI therapies. Retail and online pharmacies are widening availability in urban centers, while specialty clinics evaluate extended-release options for chronic care. Stable storage, accurate dosing, and caregiver preference are reinforcing uptake across channels. The country’s strong digital hospital infrastructure and early adoption of patient-centric drug delivery formats make dispersible a natural fit for compliance improvement.

Leading local firms and multinationals are introducing flavored dispersible for pediatrics and chronic disease management, while government reimbursement policies support wider access.
  • Market size for South Korea in 2025 is USD 17.6 million.
  • South Korea holds 2.8% of the Global Market.
  • Online and retail pharmacies expand access to flavored/effervescent ToOS.

Competition Landscape

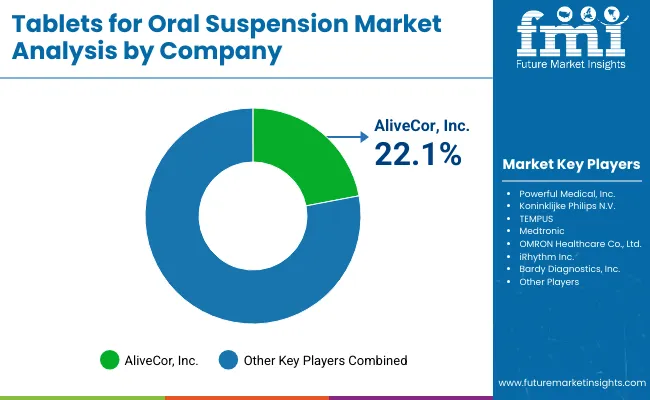
Tablets For Oral Suspension Market By Company

The Tablets for Oral Suspension (ToOS) market is moderately fragmented, with global pharmaceutical leaders, established innovators, and diversified healthcare giants competing across both primary therapies and adjacent specialty segments. Pfizer Inc. holds a dominant position, supported by its robust R&D engine, broad therapeutic coverage, and consistent product launches. The company’s leadership is reinforced through strong biologics and specialty drug portfolios, complemented by strategic partnerships and co-development agreements that expand pipeline strength and commercial reach. Its approach increasingly integrates digital health platforms and real-world evidence to strengthen competitive advantage.

Other established leaders such as Merck & Co., Novartis AG, AstraZeneca plc, and Johnson & Johnson maintain significant global presence. Merck leverages immuno-oncology and vaccine leadership, while Novartis emphasizes specialty and rare disease segments supported by deep investments in advanced therapies. AstraZeneca has gained traction in oncology and respiratory markets with its biologics-driven pipeline, and Johnson & Johnson combines pharmaceutical strength with a diversified healthcare ecosystem, enabling cross-segment synergies. These players differentiate through scale, therapeutic depth, and strong geographic penetration, making them formidable competitors.

Emerging differentiation in the market is shifting away from traditional drug portfolios toward advanced biologics, precision medicine, and digital health integration. Leaders are also focusing on sustainability in manufacturing, value-based pricing models, and patient-centric therapy access programs, ensuring long-term positioning in a competitive and innovation-driven environment.

Key Developments:

In August 2025, Lupin Limited, in partnership with NATCO Pharma, launched Bosentan Tablets for Oral Suspension (32 mg) in the USA with 180-day exclusivity following FDA approval. The product, bioequivalent to Tracleer®, targets pediatric pulmonary arterial hypertension (PAH) and addresses a USA market valued at USD 10 million annually.

In January 2025, Amneal Pharmaceuticals received USA FDA approval for memantine/donepezil extended-release capsules (with 180-day exclusivity) and everolimus tablets for oral suspension, plus tentative approval for rifaximin. These launches expand Amneal’s dementia, oncology, and gastrointestinal portfolio, reinforcing its strategy in complex generics and specialty medicines.

Scope of the Report

Item Value
Market Value (2025) USD 1,312.0 million
Product type Immediate-Release ToOS, Extended-Release ToOS, Flavored/Pediatric ToOS, Buffered ToOS, and Effervescent ToOS
Therapeutic Anti-Infectives/Antibiotics, Gastrointestinal Disorders, Pain & Fever Management, Allergies & Respiratory, Neurological/Psychiatric, and Others
Distribution channel Institutional Sales, Retail Pharmacy, Online Pharmacies
Regions Covered North America, Latin America, Western & Eastern Europe, East Asia, South Asia & Pacific, Middle East & Africa
Countries Covered USA, Brazil, China, India, Germany, France, UK etc.
Key Companies Profiled Pfizer Inc., Merck & Co., Novartis AG, AstraZeneca plc, Johnson & Johnson
Additional Attributes Dollar sales by therapeutic area and regions, adoption trends of Immediate-Release and Flavored/Pediatric ToOS, rising demand in public health & school-based programs (antibiotics, deworming), growing demand across Institutional Sales, Retail Pharmacy, and Online Pharmacies.

Key Segmentation

By Product Type:

  • Immediate-Release ToOS
  • Extended-Release ToOS
  • Flavored / Pediatric ToOS
  • Buffered ToOS
  • Effervescent ToOS

By Therapeutic Area:

  • Anti-Infectives / Antibiotics
  • Gastrointestinal Disorders
  • Pain & Fever Management
  • Allergies & Respiratory
  • Neurological / Psychiatric
  • Others

By Distribution Channel:

  • Institutional Sales
  • Retail Pharmacy
  • Online Pharmacies
  • Others

By Region:

  • North America
  • Latin America
  • East Asia
  • South Asia & Pacific
  • Western Europe
  • Eastern Europe
  • Middle East & Africa

Table of Content

  1. Executive Summary
    • Global Market Outlook
    • Demand-side Trends
    • Supply-side Trends
    • Technology Roadmap Analysis
    • Analysis and Recommendations
  2. Market Overview
    • Market Coverage / Taxonomy
    • Market Definition / Scope / Limitations
  3. Market Background
    • Market Dynamics
      • Drivers
      • Restraints
      • Opportunity
      • Trends
    • Scenario Forecast
      • Demand in Optimistic Scenario
      • Demand in Likely Scenario
      • Demand in Conservative Scenario
    • Opportunity Map Analysis
    • Product Life Cycle Analysis
    • Supply Chain Analysis
      • Supply Side Participants and their Roles
        • Producers
        • Mid-Level Participants (Traders/ Agents/ Brokers)
        • Wholesalers and Distributors
      • Value Added and Value Created at Node in the Supply Chain
      • List of Raw Material Suppliers
      • List of Existing and Potential Buyer’s
    • Investment Feasibility Matrix
    • Value Chain Analysis
      • Profit Margin Analysis
      • Wholesalers and Distributors
      • Retailers
    • PESTLE and Porter’s Analysis
    • Regulatory Landscape
      • By Key Regions
      • By Key Countries
    • Regional Parent Market Outlook
    • Production and Consumption Statistics
    • Import and Export Statistics
  4. Global Market Analysis 2020 to 2024 and Forecast, 2025 to 2035
    • Historical Market Size Value (USD Million) & Volume (Units) Analysis, 2020 to 2024
    • Current and Future Market Size Value (USD Million) & Volume (Units) Projections, 2025 to 2035
      • Y-o-Y Growth Trend Analysis
      • Absolute $ Opportunity Analysis
  5. Global Market Analysis 2020 to 2024 and Forecast 2025 to 2035, By Product Type
    • Introduction / Key Findings
    • Historical Market Size Value (USD Million) & Volume (Units) Analysis By Product Type, 2020 to 2024
    • Current and Future Market Size Value (USD Million) & Volume (Units) Analysis and Forecast By Product Type, 2025 to 2035
      • Immediate-Release ToOS
      • Extended-Release ToOS
      • Flavored / Pediatric ToOS
      • Buffered ToOS
      • Effervescent ToOS
    • Y-o-Y Growth Trend Analysis By Product Type, 2020 to 2024
    • Absolute $ Opportunity Analysis By Product Type, 2025 to 2035
  6. Global Market Analysis 2020 to 2024 and Forecast 2025 to 2035, By Therapeutic Area
    • Introduction / Key Findings
    • Historical Market Size Value (USD Million) & Volume (Units) Analysis By Therapeutic Area, 2020 to 2024
    • Current and Future Market Size Value (USD Million) & Volume (Units) Analysis and Forecast By Therapeutic Area, 2025 to 2035
      • Anti-Infectives / Antibiotics
      • Gastrointestinal Disorders
      • Pain & Fever Management
      • Allergies & Respiratory
      • Neurological / Psychiatric
      • Others
    • Y-o-Y Growth Trend Analysis By Therapeutic Area, 2020 to 2024
    • Absolute $ Opportunity Analysis By Therapeutic Area, 2025 to 2035
  7. Global Market Analysis 2020 to 2024 and Forecast 2025 to 2035, By Distribution Channel
    • Introduction / Key Findings
    • Historical Market Size Value (USD Million) & Volume (Units) Analysis By Distribution Channel, 2020 to 2024
    • Current and Future Market Size Value (USD Million) & Volume (Units) Analysis and Forecast By Distribution Channel, 2025 to 2035
      • Institutional Sales
      • Retail Pharmacy
      • Online Pharmacies
      • Others
    • Y-o-Y Growth Trend Analysis By Distribution Channel, 2020 to 2024
    • Absolute $ Opportunity Analysis By Distribution Channel, 2025 to 2035
  8. Global Market Analysis 2020 to 2024 and Forecast 2025 to 2035, By Region
    • Introduction
    • Historical Market Size Value (USD Million) & Volume (Units) Analysis By Region, 2020 to 2024
    • Current Market Size Value (USD Million) & Volume (Units) Analysis and Forecast By Region, 2025 to 2035
      • North America
      • Latin America
      • East Asia
      • South Asia & Pacific
      • Western Europe
      • Eastern Europe
      • Middle East & Africa
    • Market Attractiveness Analysis By Region
  9. North America Market Analysis 2020 to 2024 and Forecast 2025 to 2035, By Country
    • Historical Market Size Value (USD Million) & Volume (Units) Trend Analysis By Market Taxonomy, 2020 to 2024
    • Market Size Value (USD Million) & Volume (Units) Forecast By Market Taxonomy, 2025 to 2035
      • By Country
        • USA
        • Canada
        • Mexico
      • By Product Type
      • By Therapeutic Area
      • By Distribution Channel
    • Market Attractiveness Analysis
      • By Country
      • By Product Type
      • By Therapeutic Area
      • By Distribution Channel
    • Key Takeaways
  10. Latin America Market Analysis 2020 to 2024 and Forecast 2025 to 2035, By Country
    • Historical Market Size Value (USD Million) & Volume (Units) Trend Analysis By Market Taxonomy, 2020 to 2024
    • Market Size Value (USD Million) & Volume (Units) Forecast By Market Taxonomy, 2025 to 2035
      • By Country
        • Brazil
        • Argentina
        • Rest of Latin America
      • By Product Type
      • By Therapeutic Area
      • By Distribution Channel
    • Market Attractiveness Analysis
      • By Country
      • By Product Type
      • By Therapeutic Area
      • By Distribution Channel
    • Key Takeaways
  11. East Asia Market Analysis 2020 to 2024 and Forecast 2025 to 2035, By Country
    • Historical Market Size Value (USD Million) & Volume (Units) Trend Analysis By Market Taxonomy, 2020 to 2024
    • Market Size Value (USD Million) & Volume (Units) Forecast By Market Taxonomy, 2025 to 2035
      • By Country
        • China
        • Japan
        • South Korea
      • By Product Type
      • By Therapeutic Area
      • By Distribution Channel
    • Market Attractiveness Analysis
      • By Country
      • By Product Type
      • By Therapeutic Area
      • By Distribution Channel
    • Key Takeaways
  12. South Asia & Pacific Market Analysis 2020 to 2024 and Forecast 2025 to 2035, By Country
    • Historical Market Size Value (USD Million) & Volume (Units) Trend Analysis By Market Taxonomy, 2020 to 2024
    • Market Size Value (USD Million) & Volume (Units) Forecast By Market Taxonomy, 2025 to 2035
      • By Country
        • India
        • ASEAN Countries
        • Australia& New Zealand
        • Rest of South Asia
      • By Product Type
      • By Therapeutic Area
      • By Distribution Channel
    • Market Attractiveness Analysis
      • By Country
      • By Product Type
      • By Therapeutic Area
      • By Distribution Channel
    • Key Takeaways
  13. Western Europe Market Analysis 2020 to 2024 and Forecast 2025 to 2035, By Country
    • Historical Market Size Value (USD Million) & Volume (Units) Trend Analysis By Market Taxonomy, 2020 to 2024
    • Market Size Value (USD Million) & Volume (Units) Forecast By Market Taxonomy, 2025 to 2035
      • By Country
        • Germany
        • UK
        • France
        • Italy
        • Spain
        • BENELUX
        • Nordic Countries
        • Rest of Western Europe
      • By Product Type
      • By Therapeutic Area
      • By Distribution Channel
    • Market Attractiveness Analysis
      • By Country
      • By Product Type
      • By Therapeutic Area
      • By Distribution Channel
    • Key Takeaways
  14. Eastern Europe  Market Analysis 2020 to 2024 and Forecast 2025 to 2035, By Country
    • Historical Market Size Value (USD Million) & Volume (Units) Trend Analysis By Market Taxonomy, 2020 to 2024
    • Market Size Value (USD Million) & Volume (Units) Forecast By Market Taxonomy, 2025 to 2035
      • By Country
        • Russia
        • Hungary
        • Poland
        • Rest of Eastern Europe
      • By Product Type
      • By Therapeutic Area
      • By Distribution Channel
    • Market Attractiveness Analysis
      • By Country
      • By Product Type
      • By Therapeutic Area
      • By Distribution Channel
    • Key Takeaways
  15. Middle East & Africa Market Analysis 2020 to 2024 and Forecast 2025 to 2035, By Country
    • Historical Market Size Value (USD Million) & Volume (Units) Trend Analysis By Market Taxonomy, 2020 to 2024
    • Market Size Value (USD Million) & Volume (Units) Forecast By Market Taxonomy, 2025 to 2035
      • By Country
        • Saudi Arabia
        • Türkiye
        • South Africa
        • Other African Union
        • Rest of Middle East & Africa
      • By Product Type
      • By Therapeutic Area
      • By Distribution Channel
    • Market Attractiveness Analysis
      • By Country
      • By Product Type
      • By Therapeutic Area
      • By Distribution Channel
    • Key Takeaways
  16. Key Countries Market Analysis
    • USA
      • Pricing Analysis
      • Market Share Analysis, 2024
        • By Product Type
        • By Therapeutic Area
        • By Distribution Channel
    • Brazil
      • Pricing Analysis
      • Market Share Analysis, 2024
        • By Product Type
        • By Therapeutic Area
        • By Distribution Channel
    • China
      • Pricing Analysis
      • Market Share Analysis, 2024
        • By Product Type
        • By Therapeutic Area
        • By Distribution Channel
    • India
      • Pricing Analysis
      • Market Share Analysis, 2024
        • By Product Type
        • By Therapeutic Area
        • By Distribution Channel
    • Europe
      • Pricing Analysis
      • Market Share Analysis, 2024
        • By Product Type
        • By Therapeutic Area
        • By Distribution Channel
    • Germany
      • Pricing Analysis
      • Market Share Analysis, 2024
        • By Product Type
        • By Therapeutic Area
        • By Distribution Channel
    • France
      • Pricing Analysis
      • Market Share Analysis, 2024
        • By Product Type
        • By Therapeutic Area
        • By Distribution Channel
    • UK
      • Pricing Analysis
      • Market Share Analysis, 2024
        • By Product Type
        • By Therapeutic Area
        • By Distribution Channel
  17. Market Structure Analysis
    • Competition Dashboard
    • Competition Benchmarking
    • Market Share Analysis of Top Players
      • By Regional
      • By Product Type
      • By Therapeutic Area
      • By Distribution Channel
  18. Competition Analysis
    • Competition Deep Dive
      • Pfizer Inc.
        • Overview
        • Product Portfolio
        • Profitability by Market Segments (Product/Age /Sales Channel/Region)
        • Sales Footprint
        • Strategy Overview
          • Marketing Strategy
          • Product Strategy
          • Channel Strategy
      • Merck & Co.
        • Overview
        • Product Portfolio
        • Profitability by Market Segments (Product/Age /Sales Channel/Region)
        • Sales Footprint
        • Strategy Overview
          • Marketing Strategy
          • Product Strategy
          • Channel Strategy
      • Novartis AG
        • Overview
        • Product Portfolio
        • Profitability by Market Segments (Product/Age /Sales Channel/Region)
        • Sales Footprint
        • Strategy Overview
          • Marketing Strategy
          • Product Strategy
          • Channel Strategy
      • AstraZeneca plc
        • Overview
        • Product Portfolio
        • Profitability by Market Segments (Product/Age /Sales Channel/Region)
        • Sales Footprint
        • Strategy Overview
          • Marketing Strategy
          • Product Strategy
          • Channel Strategy
      • Johnson & Johnson
        • Overview
        • Product Portfolio
        • Profitability by Market Segments (Product/Age /Sales Channel/Region)
        • Sales Footprint
        • Strategy Overview
          • Marketing Strategy
          • Product Strategy
          • Channel Strategy
  19. Assumptions & Acronyms Used
  20. Research Methodology

List of Tables

  • Table 1: Global Market Value (USD Million) Forecast by Region, 2020-2035
  • Table 2: Global Market Volume (Units) Forecast by Region, 2020-2035
  • Table 3: Global Market Value (USD Million) Forecast by Product Type, 2020-2035
  • Table 4: Global Market Volume (Units) Forecast by Product Type, 2020-2035
  • Table 5: Global Market Value (USD Million) Forecast by Therapeutic Area, 2020-2035
  • Table 6: Global Market Volume (Units) Forecast by Therapeutic Area, 2020-2035
  • Table 7: Global Market Value (USD Million) Forecast by Distribution Channel, 2020-2035
  • Table 8: Global Market Volume (Units) Forecast by Distribution Channel, 2020-2035
  • Table 9: North America Market Value (USD Million) Forecast by Country, 2020-2035
  • Table 10: North America Market Volume (Units) Forecast by Country, 2020-2035
  • Table 11: North America Market Value (USD Million) Forecast by Product Type, 2020-2035
  • Table 12: North America Market Volume (Units) Forecast by Product Type, 2020-2035
  • Table 13: North America Market Value (USD Million) Forecast by Therapeutic Area, 2020-2035
  • Table 14: North America Market Volume (Units) Forecast by Therapeutic Area, 2020-2035
  • Table 15: North America Market Value (USD Million) Forecast by Distribution Channel, 2020-2035
  • Table 16: North America Market Volume (Units) Forecast by Distribution Channel, 2020-2035
  • Table 17: Latin America Market Value (USD Million) Forecast by Country, 2020-2035
  • Table 18: Latin America Market Volume (Units) Forecast by Country, 2020-2035
  • Table 19: Latin America Market Value (USD Million) Forecast by Product Type, 2020-2035
  • Table 20: Latin America Market Volume (Units) Forecast by Product Type, 2020-2035
  • Table 21: Latin America Market Value (USD Million) Forecast by Therapeutic Area, 2020-2035
  • Table 22: Latin America Market Volume (Units) Forecast by Therapeutic Area, 2020-2035
  • Table 23: Latin America Market Value (USD Million) Forecast by Distribution Channel, 2020-2035
  • Table 24: Latin America Market Volume (Units) Forecast by Distribution Channel, 2020-2035
  • Table 25: East Asia Market Value (USD Million) Forecast by Country, 2020-2035
  • Table 26: East Asia Market Volume (Units) Forecast by Country, 2020-2035
  • Table 27: East Asia Market Value (USD Million) Forecast by Product Type, 2020-2035
  • Table 28: East Asia Market Volume (Units) Forecast by Product Type, 2020-2035
  • Table 29: East Asia Market Value (USD Million) Forecast by Therapeutic Area, 2020-2035
  • Table 30: East Asia Market Volume (Units) Forecast by Therapeutic Area, 2020-2035
  • Table 31: East Asia Market Value (USD Million) Forecast by Distribution Channel, 2020-2035
  • Table 32: East Asia Market Volume (Units) Forecast by Distribution Channel, 2020-2035
  • Table 33: South Asia & Pacific Market Value (USD Million) Forecast by Country, 2020-2035
  • Table 34: South Asia & Pacific Market Volume (Units) Forecast by Country, 2020-2035
  • Table 35: South Asia & Pacific Market Value (USD Million) Forecast by Product Type, 2020-2035
  • Table 36: South Asia & Pacific Market Volume (Units) Forecast by Product Type, 2020-2035
  • Table 37: South Asia & Pacific Market Value (USD Million) Forecast by Therapeutic Area, 2020-2035
  • Table 38: South Asia & Pacific Market Volume (Units) Forecast by Therapeutic Area, 2020-2035
  • Table 39: South Asia & Pacific Market Value (USD Million) Forecast by Distribution Channel, 2020-2035
  • Table 40: South Asia & Pacific Market Volume (Units) Forecast by Distribution Channel, 2020-2035
  • Table 41: Western Europe Market Value (USD Million) Forecast by Country, 2020-2035
  • Table 42: Western Europe Market Volume (Units) Forecast by Country, 2020-2035
  • Table 43: Western Europe Market Value (USD Million) Forecast by Product Type, 2020-2035
  • Table 44: Western Europe Market Volume (Units) Forecast by Product Type, 2020-2035
  • Table 45: Western Europe Market Value (USD Million) Forecast by Therapeutic Area, 2020-2035
  • Table 46: Western Europe Market Volume (Units) Forecast by Therapeutic Area, 2020-2035
  • Table 47: Western Europe Market Value (USD Million) Forecast by Distribution Channel, 2020-2035
  • Table 48: Western Europe Market Volume (Units) Forecast by Distribution Channel, 2020-2035
  • Table 49: Eastern Europe Market Value (USD Million) Forecast by Country, 2020-2035
  • Table 50: Eastern Europe Market Volume (Units) Forecast by Country, 2020-2035
  • Table 51: Eastern Europe Market Value (USD Million) Forecast by Product Type, 2020-2035
  • Table 52: Eastern Europe Market Volume (Units) Forecast by Product Type, 2020-2035
  • Table 53: Eastern Europe Market Value (USD Million) Forecast by Therapeutic Area, 2020-2035
  • Table 54: Eastern Europe Market Volume (Units) Forecast by Therapeutic Area, 2020-2035
  • Table 55: Eastern Europe Market Value (USD Million) Forecast by Distribution Channel, 2020-2035
  • Table 56: Eastern Europe Market Volume (Units) Forecast by Distribution Channel, 2020-2035
  • Table 57: Middle East & Africa Market Value (USD Million) Forecast by Country, 2020-2035
  • Table 58: Middle East & Africa Market Volume (Units) Forecast by Country, 2020-2035
  • Table 59: Middle East & Africa Market Value (USD Million) Forecast by Product Type, 2020-2035
  • Table 60: Middle East & Africa Market Volume (Units) Forecast by Product Type, 2020-2035
  • Table 61: Middle East & Africa Market Value (USD Million) Forecast by Therapeutic Area, 2020-2035
  • Table 62: Middle East & Africa Market Volume (Units) Forecast by Therapeutic Area, 2020-2035
  • Table 63: Middle East & Africa Market Value (USD Million) Forecast by Distribution Channel, 2020-2035
  • Table 64: Middle East & Africa Market Volume (Units) Forecast by Distribution Channel, 2020-2035

List of Figures

  • Figure 1: Global Market Value (USD Million) by Product Type, 2025-2035
  • Figure 2: Global Market Value (USD Million) by Therapeutic Area, 2025-2035
  • Figure 3: Global Market Value (USD Million) by Distribution Channel, 2025-2035
  • Figure 4: Global Market Value (USD Million) by Region, 2025-2035
  • Figure 5: Global Market Value (USD Million) Analysis by Region, 2020-2035
  • Figure 6: Global Market Volume (Units) Analysis by Region, 2020-2035
  • Figure 7: Global Market Value Share (%) and BPS Analysis by Region, 2025-2035
  • Figure 8: Global Market Y-o-Y Growth (%) Projections by Region, 2025-2035
  • Figure 9: Global Market Value (USD Million) Analysis by Product Type, 2020-2035
  • Figure 10: Global Market Volume (Units) Analysis by Product Type, 2020-2035
  • Figure 11: Global Market Value Share (%) and BPS Analysis by Product Type, 2025-2035
  • Figure 12: Global Market Y-o-Y Growth (%) Projections by Product Type, 2025-2035
  • Figure 13: Global Market Value (USD Million) Analysis by Therapeutic Area, 2020-2035
  • Figure 14: Global Market Volume (Units) Analysis by Therapeutic Area, 2020-2035
  • Figure 15: Global Market Value Share (%) and BPS Analysis by Therapeutic Area, 2025-2035
  • Figure 16: Global Market Y-o-Y Growth (%) Projections by Therapeutic Area, 2025-2035
  • Figure 17: Global Market Value (USD Million) Analysis by Distribution Channel, 2020-2035
  • Figure 18: Global Market Volume (Units) Analysis by Distribution Channel, 2020-2035
  • Figure 19: Global Market Value Share (%) and BPS Analysis by Distribution Channel, 2025-2035
  • Figure 20: Global Market Y-o-Y Growth (%) Projections by Distribution Channel, 2025-2035
  • Figure 21: Global Market Attractiveness by Product Type, 2025-2035
  • Figure 22: Global Market Attractiveness by Therapeutic Area, 2025-2035
  • Figure 23: Global Market Attractiveness by Distribution Channel, 2025-2035
  • Figure 24: Global Market Attractiveness by Region, 2025-2035
  • Figure 25: North America Market Value (USD Million) by Product Type, 2025-2035
  • Figure 26: North America Market Value (USD Million) by Therapeutic Area, 2025-2035
  • Figure 27: North America Market Value (USD Million) by Distribution Channel, 2025-2035
  • Figure 28: North America Market Value (USD Million) by Country, 2025-2035
  • Figure 29: North America Market Value (USD Million) Analysis by Country, 2020-2035
  • Figure 30: North America Market Volume (Units) Analysis by Country, 2020-2035
  • Figure 31: North America Market Value Share (%) and BPS Analysis by Country, 2025-2035
  • Figure 32: North America Market Y-o-Y Growth (%) Projections by Country, 2025-2035
  • Figure 33: North America Market Value (USD Million) Analysis by Product Type, 2020-2035
  • Figure 34: North America Market Volume (Units) Analysis by Product Type, 2020-2035
  • Figure 35: North America Market Value Share (%) and BPS Analysis by Product Type, 2025-2035
  • Figure 36: North America Market Y-o-Y Growth (%) Projections by Product Type, 2025-2035
  • Figure 37: North America Market Value (USD Million) Analysis by Therapeutic Area, 2020-2035
  • Figure 38: North America Market Volume (Units) Analysis by Therapeutic Area, 2020-2035
  • Figure 39: North America Market Value Share (%) and BPS Analysis by Therapeutic Area, 2025-2035
  • Figure 40: North America Market Y-o-Y Growth (%) Projections by Therapeutic Area, 2025-2035
  • Figure 41: North America Market Value (USD Million) Analysis by Distribution Channel, 2020-2035
  • Figure 42: North America Market Volume (Units) Analysis by Distribution Channel, 2020-2035
  • Figure 43: North America Market Value Share (%) and BPS Analysis by Distribution Channel, 2025-2035
  • Figure 44: North America Market Y-o-Y Growth (%) Projections by Distribution Channel, 2025-2035
  • Figure 45: North America Market Attractiveness by Product Type, 2025-2035
  • Figure 46: North America Market Attractiveness by Therapeutic Area, 2025-2035
  • Figure 47: North America Market Attractiveness by Distribution Channel, 2025-2035
  • Figure 48: North America Market Attractiveness by Country, 2025-2035
  • Figure 49: Latin America Market Value (USD Million) by Product Type, 2025-2035
  • Figure 50: Latin America Market Value (USD Million) by Therapeutic Area, 2025-2035
  • Figure 51: Latin America Market Value (USD Million) by Distribution Channel, 2025-2035
  • Figure 52: Latin America Market Value (USD Million) by Country, 2025-2035
  • Figure 53: Latin America Market Value (USD Million) Analysis by Country, 2020-2035
  • Figure 54: Latin America Market Volume (Units) Analysis by Country, 2020-2035
  • Figure 55: Latin America Market Value Share (%) and BPS Analysis by Country, 2025-2035
  • Figure 56: Latin America Market Y-o-Y Growth (%) Projections by Country, 2025-2035
  • Figure 57: Latin America Market Value (USD Million) Analysis by Product Type, 2020-2035
  • Figure 58: Latin America Market Volume (Units) Analysis by Product Type, 2020-2035
  • Figure 59: Latin America Market Value Share (%) and BPS Analysis by Product Type, 2025-2035
  • Figure 60: Latin America Market Y-o-Y Growth (%) Projections by Product Type, 2025-2035
  • Figure 61: Latin America Market Value (USD Million) Analysis by Therapeutic Area, 2020-2035
  • Figure 62: Latin America Market Volume (Units) Analysis by Therapeutic Area, 2020-2035
  • Figure 63: Latin America Market Value Share (%) and BPS Analysis by Therapeutic Area, 2025-2035
  • Figure 64: Latin America Market Y-o-Y Growth (%) Projections by Therapeutic Area, 2025-2035
  • Figure 65: Latin America Market Value (USD Million) Analysis by Distribution Channel, 2020-2035
  • Figure 66: Latin America Market Volume (Units) Analysis by Distribution Channel, 2020-2035
  • Figure 67: Latin America Market Value Share (%) and BPS Analysis by Distribution Channel, 2025-2035
  • Figure 68: Latin America Market Y-o-Y Growth (%) Projections by Distribution Channel, 2025-2035
  • Figure 69: Latin America Market Attractiveness by Product Type, 2025-2035
  • Figure 70: Latin America Market Attractiveness by Therapeutic Area, 2025-2035
  • Figure 71: Latin America Market Attractiveness by Distribution Channel, 2025-2035
  • Figure 72: Latin America Market Attractiveness by Country, 2025-2035
  • Figure 73: East Asia Market Value (USD Million) by Product Type, 2025-2035
  • Figure 74: East Asia Market Value (USD Million) by Therapeutic Area, 2025-2035
  • Figure 75: East Asia Market Value (USD Million) by Distribution Channel, 2025-2035
  • Figure 76: East Asia Market Value (USD Million) by Country, 2025-2035
  • Figure 77: East Asia Market Value (USD Million) Analysis by Country, 2020-2035
  • Figure 78: East Asia Market Volume (Units) Analysis by Country, 2020-2035
  • Figure 79: East Asia Market Value Share (%) and BPS Analysis by Country, 2025-2035
  • Figure 80: East Asia Market Y-o-Y Growth (%) Projections by Country, 2025-2035
  • Figure 81: East Asia Market Value (USD Million) Analysis by Product Type, 2020-2035
  • Figure 82: East Asia Market Volume (Units) Analysis by Product Type, 2020-2035
  • Figure 83: East Asia Market Value Share (%) and BPS Analysis by Product Type, 2025-2035
  • Figure 84: East Asia Market Y-o-Y Growth (%) Projections by Product Type, 2025-2035
  • Figure 85: East Asia Market Value (USD Million) Analysis by Therapeutic Area, 2020-2035
  • Figure 86: East Asia Market Volume (Units) Analysis by Therapeutic Area, 2020-2035
  • Figure 87: East Asia Market Value Share (%) and BPS Analysis by Therapeutic Area, 2025-2035
  • Figure 88: East Asia Market Y-o-Y Growth (%) Projections by Therapeutic Area, 2025-2035
  • Figure 89: East Asia Market Value (USD Million) Analysis by Distribution Channel, 2020-2035
  • Figure 90: East Asia Market Volume (Units) Analysis by Distribution Channel, 2020-2035
  • Figure 91: East Asia Market Value Share (%) and BPS Analysis by Distribution Channel, 2025-2035
  • Figure 92: East Asia Market Y-o-Y Growth (%) Projections by Distribution Channel, 2025-2035
  • Figure 93: East Asia Market Attractiveness by Product Type, 2025-2035
  • Figure 94: East Asia Market Attractiveness by Therapeutic Area, 2025-2035
  • Figure 95: East Asia Market Attractiveness by Distribution Channel, 2025-2035
  • Figure 96: East Asia Market Attractiveness by Country, 2025-2035
  • Figure 97: South Asia & Pacific Market Value (USD Million) by Product Type, 2025-2035
  • Figure 98: South Asia & Pacific Market Value (USD Million) by Therapeutic Area, 2025-2035
  • Figure 99: South Asia & Pacific Market Value (USD Million) by Distribution Channel, 2025-2035
  • Figure 100: South Asia & Pacific Market Value (USD Million) by Country, 2025-2035
  • Figure 101: South Asia & Pacific Market Value (USD Million) Analysis by Country, 2020-2035
  • Figure 102: South Asia & Pacific Market Volume (Units) Analysis by Country, 2020-2035
  • Figure 103: South Asia & Pacific Market Value Share (%) and BPS Analysis by Country, 2025-2035
  • Figure 104: South Asia & Pacific Market Y-o-Y Growth (%) Projections by Country, 2025-2035
  • Figure 105: South Asia & Pacific Market Value (USD Million) Analysis by Product Type, 2020-2035
  • Figure 106: South Asia & Pacific Market Volume (Units) Analysis by Product Type, 2020-2035
  • Figure 107: South Asia & Pacific Market Value Share (%) and BPS Analysis by Product Type, 2025-2035
  • Figure 108: South Asia & Pacific Market Y-o-Y Growth (%) Projections by Product Type, 2025-2035
  • Figure 109: South Asia & Pacific Market Value (USD Million) Analysis by Therapeutic Area, 2020-2035
  • Figure 110: South Asia & Pacific Market Volume (Units) Analysis by Therapeutic Area, 2020-2035
  • Figure 111: South Asia & Pacific Market Value Share (%) and BPS Analysis by Therapeutic Area, 2025-2035
  • Figure 112: South Asia & Pacific Market Y-o-Y Growth (%) Projections by Therapeutic Area, 2025-2035
  • Figure 113: South Asia & Pacific Market Value (USD Million) Analysis by Distribution Channel, 2020-2035
  • Figure 114: South Asia & Pacific Market Volume (Units) Analysis by Distribution Channel, 2020-2035
  • Figure 115: South Asia & Pacific Market Value Share (%) and BPS Analysis by Distribution Channel, 2025-2035
  • Figure 116: South Asia & Pacific Market Y-o-Y Growth (%) Projections by Distribution Channel, 2025-2035
  • Figure 117: South Asia & Pacific Market Attractiveness by Product Type, 2025-2035
  • Figure 118: South Asia & Pacific Market Attractiveness by Therapeutic Area, 2025-2035
  • Figure 119: South Asia & Pacific Market Attractiveness by Distribution Channel, 2025-2035
  • Figure 120: South Asia & Pacific Market Attractiveness by Country, 2025-2035
  • Figure 121: Western Europe Market Value (USD Million) by Product Type, 2025-2035
  • Figure 122: Western Europe Market Value (USD Million) by Therapeutic Area, 2025-2035
  • Figure 123: Western Europe Market Value (USD Million) by Distribution Channel, 2025-2035
  • Figure 124: Western Europe Market Value (USD Million) by Country, 2025-2035
  • Figure 125: Western Europe Market Value (USD Million) Analysis by Country, 2020-2035
  • Figure 126: Western Europe Market Volume (Units) Analysis by Country, 2020-2035
  • Figure 127: Western Europe Market Value Share (%) and BPS Analysis by Country, 2025-2035
  • Figure 128: Western Europe Market Y-o-Y Growth (%) Projections by Country, 2025-2035
  • Figure 129: Western Europe Market Value (USD Million) Analysis by Product Type, 2020-2035
  • Figure 130: Western Europe Market Volume (Units) Analysis by Product Type, 2020-2035
  • Figure 131: Western Europe Market Value Share (%) and BPS Analysis by Product Type, 2025-2035
  • Figure 132: Western Europe Market Y-o-Y Growth (%) Projections by Product Type, 2025-2035
  • Figure 133: Western Europe Market Value (USD Million) Analysis by Therapeutic Area, 2020-2035
  • Figure 134: Western Europe Market Volume (Units) Analysis by Therapeutic Area, 2020-2035
  • Figure 135: Western Europe Market Value Share (%) and BPS Analysis by Therapeutic Area, 2025-2035
  • Figure 136: Western Europe Market Y-o-Y Growth (%) Projections by Therapeutic Area, 2025-2035
  • Figure 137: Western Europe Market Value (USD Million) Analysis by Distribution Channel, 2020-2035
  • Figure 138: Western Europe Market Volume (Units) Analysis by Distribution Channel, 2020-2035
  • Figure 139: Western Europe Market Value Share (%) and BPS Analysis by Distribution Channel, 2025-2035
  • Figure 140: Western Europe Market Y-o-Y Growth (%) Projections by Distribution Channel, 2025-2035
  • Figure 141: Western Europe Market Attractiveness by Product Type, 2025-2035
  • Figure 142: Western Europe Market Attractiveness by Therapeutic Area, 2025-2035
  • Figure 143: Western Europe Market Attractiveness by Distribution Channel, 2025-2035
  • Figure 144: Western Europe Market Attractiveness by Country, 2025-2035
  • Figure 145: Eastern Europe Market Value (USD Million) by Product Type, 2025-2035
  • Figure 146: Eastern Europe Market Value (USD Million) by Therapeutic Area, 2025-2035
  • Figure 147: Eastern Europe Market Value (USD Million) by Distribution Channel, 2025-2035
  • Figure 148: Eastern Europe Market Value (USD Million) by Country, 2025-2035
  • Figure 149: Eastern Europe Market Value (USD Million) Analysis by Country, 2020-2035
  • Figure 150: Eastern Europe Market Volume (Units) Analysis by Country, 2020-2035
  • Figure 151: Eastern Europe Market Value Share (%) and BPS Analysis by Country, 2025-2035
  • Figure 152: Eastern Europe Market Y-o-Y Growth (%) Projections by Country, 2025-2035
  • Figure 153: Eastern Europe Market Value (USD Million) Analysis by Product Type, 2020-2035
  • Figure 154: Eastern Europe Market Volume (Units) Analysis by Product Type, 2020-2035
  • Figure 155: Eastern Europe Market Value Share (%) and BPS Analysis by Product Type, 2025-2035
  • Figure 156: Eastern Europe Market Y-o-Y Growth (%) Projections by Product Type, 2025-2035
  • Figure 157: Eastern Europe Market Value (USD Million) Analysis by Therapeutic Area, 2020-2035
  • Figure 158: Eastern Europe Market Volume (Units) Analysis by Therapeutic Area, 2020-2035
  • Figure 159: Eastern Europe Market Value Share (%) and BPS Analysis by Therapeutic Area, 2025-2035
  • Figure 160: Eastern Europe Market Y-o-Y Growth (%) Projections by Therapeutic Area, 2025-2035
  • Figure 161: Eastern Europe Market Value (USD Million) Analysis by Distribution Channel, 2020-2035
  • Figure 162: Eastern Europe Market Volume (Units) Analysis by Distribution Channel, 2020-2035
  • Figure 163: Eastern Europe Market Value Share (%) and BPS Analysis by Distribution Channel, 2025-2035
  • Figure 164: Eastern Europe Market Y-o-Y Growth (%) Projections by Distribution Channel, 2025-2035
  • Figure 165: Eastern Europe Market Attractiveness by Product Type, 2025-2035
  • Figure 166: Eastern Europe Market Attractiveness by Therapeutic Area, 2025-2035
  • Figure 167: Eastern Europe Market Attractiveness by Distribution Channel, 2025-2035
  • Figure 168: Eastern Europe Market Attractiveness by Country, 2025-2035
  • Figure 169: Middle East & Africa Market Value (USD Million) by Product Type, 2025-2035
  • Figure 170: Middle East & Africa Market Value (USD Million) by Therapeutic Area, 2025-2035
  • Figure 171: Middle East & Africa Market Value (USD Million) by Distribution Channel, 2025-2035
  • Figure 172: Middle East & Africa Market Value (USD Million) by Country, 2025-2035
  • Figure 173: Middle East & Africa Market Value (USD Million) Analysis by Country, 2020-2035
  • Figure 174: Middle East & Africa Market Volume (Units) Analysis by Country, 2020-2035
  • Figure 175: Middle East & Africa Market Value Share (%) and BPS Analysis by Country, 2025-2035
  • Figure 176: Middle East & Africa Market Y-o-Y Growth (%) Projections by Country, 2025-2035
  • Figure 177: Middle East & Africa Market Value (USD Million) Analysis by Product Type, 2020-2035
  • Figure 178: Middle East & Africa Market Volume (Units) Analysis by Product Type, 2020-2035
  • Figure 179: Middle East & Africa Market Value Share (%) and BPS Analysis by Product Type, 2025-2035
  • Figure 180: Middle East & Africa Market Y-o-Y Growth (%) Projections by Product Type, 2025-2035
  • Figure 181: Middle East & Africa Market Value (USD Million) Analysis by Therapeutic Area, 2020-2035
  • Figure 182: Middle East & Africa Market Volume (Units) Analysis by Therapeutic Area, 2020-2035
  • Figure 183: Middle East & Africa Market Value Share (%) and BPS Analysis by Therapeutic Area, 2025-2035
  • Figure 184: Middle East & Africa Market Y-o-Y Growth (%) Projections by Therapeutic Area, 2025-2035
  • Figure 185: Middle East & Africa Market Value (USD Million) Analysis by Distribution Channel, 2020-2035
  • Figure 186: Middle East & Africa Market Volume (Units) Analysis by Distribution Channel, 2020-2035
  • Figure 187: Middle East & Africa Market Value Share (%) and BPS Analysis by Distribution Channel, 2025-2035
  • Figure 188: Middle East & Africa Market Y-o-Y Growth (%) Projections by Distribution Channel, 2025-2035
  • Figure 189: Middle East & Africa Market Attractiveness by Product Type, 2025-2035
  • Figure 190: Middle East & Africa Market Attractiveness by Therapeutic Area, 2025-2035
  • Figure 191: Middle East & Africa Market Attractiveness by Distribution Channel, 2025-2035
  • Figure 192: Middle East & Africa Market Attractiveness by Country, 2025-2035

Frequently Asked Questions

How big is the Tablets for Oral Suspension (ToOS) market in 2025?

The global Tablets for Oral Suspension (ToOS) market is estimated to be valued at USD 1,634.8 million in 2025.

What will be the size of the Tablets for Oral Suspension (ToOS) market in 2035?

The market size for Tablets for Oral Suspension is projected to reach USD 2,587.8 million by 2035.

How much will the Tablets for Oral Suspension (ToOS) market grow between 2025 and 2035?

The Tablets for Oral Suspension market is expected to grow at a CAGR of 4.7% during this period.

What are the key product types in the Tablets for Oral Suspension (ToOS) market?

Key product types include Immediate-Release ToOS, Extended-Release ToOS, Flavored/Pediatric ToOS, Buffered ToOS, and Effervescent ToOS.

Which therapeutic area will contribute a significant share in the Tablets for Oral Suspension (ToOS) market in 2025?

The Anti-Infectives / Antibiotics segment is projected to command 48.3% of the market in 2025.

Explore Similar Insights

Future Market Insights

Tablets for Oral Suspension Market