Oral Food Challenge Testing Market Size and Share Forecast Outlook 2025 to 2035

The global Oral Food Challenge (OFC) Testing Market is projected to reach a valuation of USD 283.5 million by 2025 and USD 595.2 million by 2035. This indicates a decade-long increase of USD 311.7 million between 2025 and 2035. The market is expected to expand at a compound annual growth rate (CAGR) of 7.7%, representing a 2.1X increase over the ten-year period.
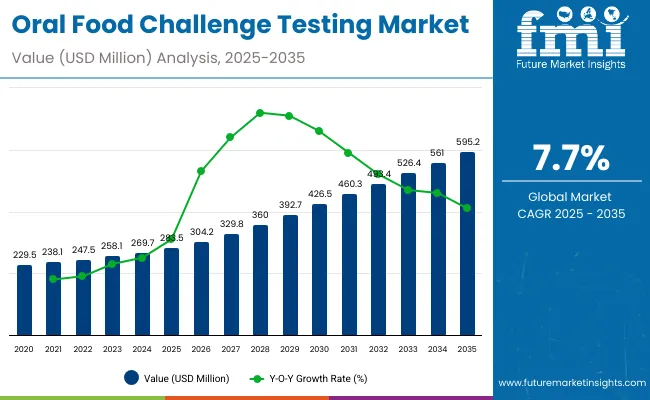
Quick Stats for Oral Food Challenge (OFC) Testing Market

  • Industry Value (2025): USD 283.5 million
  • Forecast Value (2035): USD 595.2 million
  • Forecast CAGR: 7.7%
  • Leading Segment in 2025 (Test Type): Open Food Challenge (56.3% share)
  • Key Growth Region: Europe and Asia
  • Top Key Players: Reacta Healthcare, and Beckman Coulter Life Science, UMC Utrecht.

Oral Food Challenge Testing Market

Metric Value
Industry Size (2025E) USD 283.5 million
Industry Value (2035F) USD 595.2 million
CAGR (2025 to 2035) 7.7%

During the first five-year period from 2025 to 2030, the total market value is projected to expand from USD 283.5 million to USD 426.5 million, adding USD 143.0 million, which contributes to 45.9% of the total decade growth. The Open Food Challenge segment will remain dominant, holding around 56.3% share of the category by 2030, driven by its wide adoption in pediatric allergy diagnosis due to easier administration. The Double-Blind Placebo-Controlled Food Challenge (DBPCFC) segment will increase steadily, moving toward 27.4% share by 2035, while the Single-Blind Food Challenge segment will moderate at around 16.3% share.

The second half from 2030 to 2035 contributes USD 168.7 million, which is equal to 54.1% of the total growth, as the market expands from USD 426.5million to USD 595.2 million. This acceleration is powered by the growing adoption of OFC as the gold-standard confirmatory test for food allergies in both institutional and specialized clinic settings.

By the end of the decade, Open Food Challenges and DBPCFCs together capture above 83.0% share, consolidating their importance in clinical practice. Allergen-specific tests led by peanuts and milk further strengthen the market growth outlook with a cumulative share of 49.7%, particularly in pediatric populations that account for nearly 79.0% of total OFC tests by 2035.

From 2020 to 2024, the overall Oral Food Challenge (OFC) Testing Market grew from USD 229.5million to USD 269.7 million. Leading institutions and companies such as Reacta Healthcare, Mount Sinai (NY), UMC Utrecht, and Aimmune together account for more than 72.0% of global revenue, with Reacta Healthcare alone contributing a dominant share of 72.3% in 2024. Key strategies deployed by these players include advancing standardized challenge protocols, investing in controlled dosing platforms, and forming partnerships with academic centers to validate real-world testing outcomes.

In 2025, the Oral Food Challenge Testing market is expected to reach a value of approximately USD 283.5 million, driven by its positioning as the gold-standard confirmatory tool for food allergy diagnosis. Growth will be propelled by rising prevalence of pediatric food allergies, greater reliance on confirmatory tests before introducing oral immunotherapy (OIT), and alignment with international clinical practice guidelines from AAAAI, EAACI, and NIAID.

Hospitals and specialty allergy clinics are increasingly adopting structured OFC programs, including Open Food Challenge accounting for 56.3% share and Double-Blind Placebo-Controlled Food Challenge holding 25.4% share, to enhance diagnostic accuracy, minimize false positives from IgE or skin-prick testing, and improve patient safety through standardized emergency response protocols.

Why Is This Market Growing?

The Oral Food Challenge (OFC) Testing Market is witnessing strong growth because allergy care providers worldwide face mounting pressure to accurately diagnose food allergies, reduce misdiagnosis from IgE and skin-prick tests, and improve patient safety. Major drivers include rising prevalence of pediatric food allergies, stricter clinical guidelines that recommend OFC as the gold standard, and the growing adoption of oral immunotherapy (OIT), which requires confirmatory testing before initiation. Innovations such as standardized dosing platforms, blinded protocols, and emergency-ready clinical workflows are reducing risk, minimizing false results, and enhancing reproducibility across centers.

The post-pandemic focus on immune health amplified demand for validated allergy diagnostics, accelerating adoption of structured OFC programs in hospitals and specialty clinics. As healthcare budgets increasingly prioritize evidence-based allergy management, providers who deliver reliable challenge protocols, safety monitoring, and patient-centric testing environments are seeing robust uptake. In countries with expanding pediatric allergy services, particularly in the USA, Europe, and Asia Pacific, the establishment of new allergy centers and guideline-driven upgrades is further fueling demand.

Segmental Analysis

The Oral Food Challenge (OFC) Testing Market is segmented by test type, allergen type, age group, and sales channel, each highlighting the critical dimensions influencing adoption. Test type segmentation covers Open Food Challenge, Single-Blind Food Challenge, and Double-Blind Placebo-Controlled Food Challenge (DBPCFC), reflecting the varying levels of diagnostic rigor and clinical use. Allergen type classification includes milk, eggs, peanuts, wheat, shellfish & fish, and others, underscoring the broad range of allergen triggers necessitating standardized confirmatory testing.

Based on age group, the market is divided into children, adults, and geriatric populations, with pediatric cases dominating due to the higher prevalence of childhood food allergies. In terms of sales channel, the market is categorized into institutional sales driven by hospitals and specialty allergy clinics and retail sales, which are gradually expanding through outpatient and private practice settings.
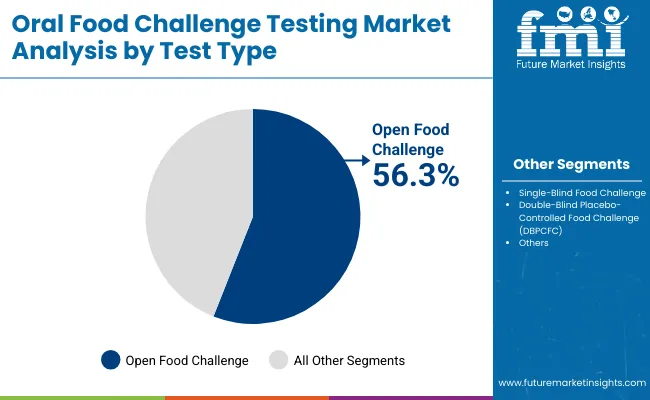
Insights into the Test Type Segment with Open Food Challenge Leading in Market Share

Oral Food Challenge Testing Market By Test

By Test Type Market Share (%)
Open Food Challenge 56.3%
Single-Blind Food Challenge 18.3%
Double-Blind Placebo-Controlled Food Challenge (DBPCFC) 25.4%

Open Food Challenge is expected to retain a dominant position, contributing 56.3% in 2025, owing to its simpler administration, wider physician familiarity, and suitability for pediatric populations where most allergy cases are concentrated. Its adoption has been driven by the growing global emphasis on confirmatory testing as the gold standard in food allergy diagnosis. Preference has been increasingly shown for open protocols due to their ease of execution, reduced resource requirements compared to blinded formats, and ability to provide quick, actionable outcomes in clinical settings.

The use of open challenges has also been encouraged by clinical practice guidelines that recommend stepwise validation of suspected allergens before initiating oral immunotherapy (OIT). These factors have collectively contributed to the sustained demand for Open Food Challenge protocols, particularly across hospitals and specialty allergy clinics handling high patient volumes.
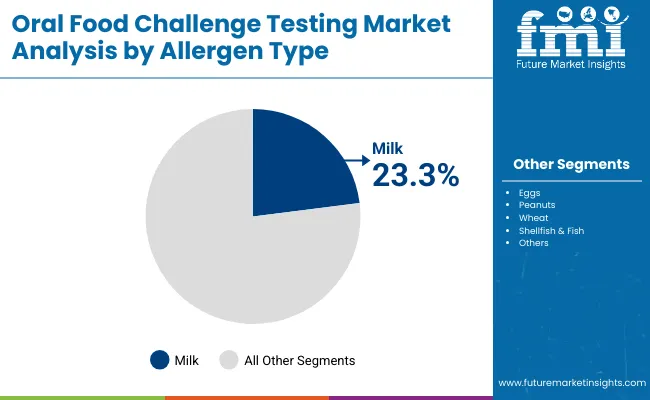
Insights into the Allergen Type Segment with Peanut Allergy Testing Dominating the Demand

Oral Food Challenge Testing Market By Allergen

By Allergen Type Market Share (%)
Milk 23.3%
Eggs 13.1%
Peanuts 27.4%
Wheat 8.4%
Shellfish & Fish 18.2%
Others 9.5%

Peanut allergy testing has emerged as the leading allergen type and is projected to hold around 27.4% share in 2025, making it the most commonly evaluated trigger in Oral Food Challenge (OFC) protocols. The dominance of peanut challenges stems from the high prevalence and severity of peanut-induced allergic reactions, which are a major cause of anaphylaxis in children and young adults. Clinical guidelines from organizations such as AAAAI and EAACI highlight the importance of confirmatory peanut challenges to establish diagnosis before recommending avoidance strategies or initiating oral immunotherapy (OIT).

As a result, specialty allergy clinics and hospitals are increasingly standardizing peanut OFCs under closely monitored conditions, supported by emergency preparedness protocols. Additionally, the growth in peanut immunotherapy products has further boosted demand for confirmatory testing, ensuring that patients are accurately diagnosed before treatment begins. Collectively, these factors have positioned peanut OFCs as the cornerstone of allergen-specific diagnostic testing, surpassing other common allergens such as milk, eggs, and shellfish.
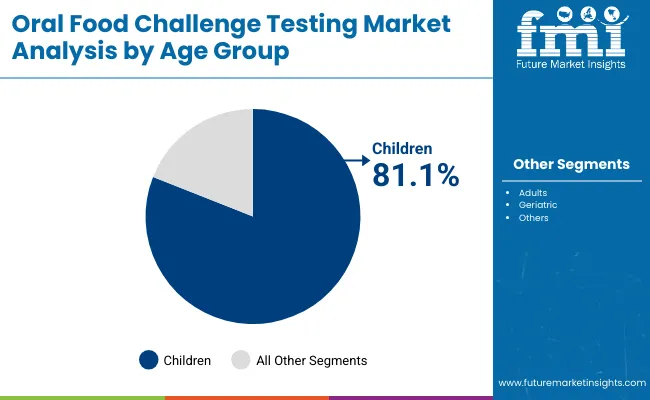
Insights into the Age Group Segment with Children Dominating Testing Demand

Oral Food Challenge Testing Market By Age

By Age Group Market Share (%)
Children 81.1%
Adults 13.2%
Geriatric 5.6%

Children are expected to remain the largest age group segment, contributing around 81.1% in 2025, owing to the high prevalence of pediatric food allergies globally. Most suspected food allergy cases are identified during early childhood, prompting the need for confirmatory Oral Food Challenges (OFCs) before dietary restrictions or therapeutic interventions are prescribed. Pediatric dominance is reinforced by clinical guidelines that emphasize OFC as the gold-standard diagnostic method in children to avoid over-diagnosis from IgE or skin-prick testing alone.

Investments in pediatric allergy centers, school-based food allergy programs, and specialized hospital units have resulted in widespread adoption of OFC protocols in this segment. Demand is further supported by the growing pipeline of oral immunotherapies (OIT) targeting pediatric patients, for which OFC is a prerequisite step. Collectively, these factors ensure that children will remain the dominant group undergoing OFC testing, with adults (13.2%) and geriatric patients (5.7%) representing smaller but steadily growing segments.
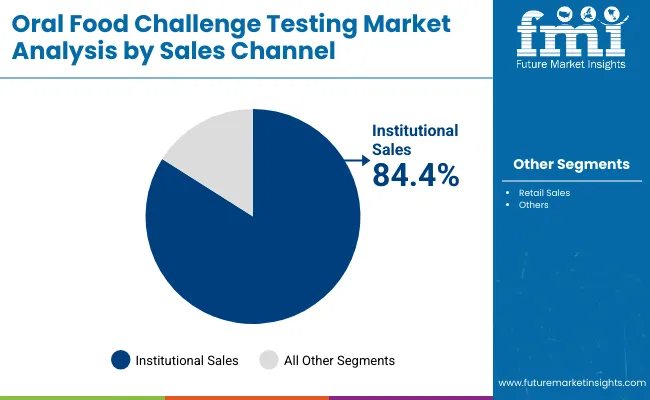
Insights into the Sales Channel Segment with Institutional Settings Leading Market Demand

Oral Food Challenge Testing Market By Sales

By Sales Channel Market Share (%)
Institutional Sales 84.4%
Retail Sales 15.6%

Institutional sales are expected to remain the dominant distribution channel, contributing around 84.4% in 2025, due to the high concentration of Oral Food Challenge (OFC) procedures in hospitals, university medical centers, and specialty allergy clinics. Most OFCs require controlled environments with emergency preparedness, trained staff, and standardized monitoring protocols, making institutional setups the preferred location for testing. Demand is reinforced by clinical guidelines recommending that OFCs be performed under strict supervision to mitigate risks of severe allergic reactions.

Investments in pediatric allergy units, dedicated food allergy centers, and academic research programs have further strengthened institutional adoption. While retail sales including private allergy practices and outpatient clinicsrepresent 15.6% in 2025, this channel is gradually expanding as more specialized clinics adopt structured OFC programs to improve accessibility. Collectively, these dynamics ensure that institutional testing settings will continue to dominate OFC market revenues, while retail-based adoption steadily broadens the testing landscape.

What are the Drivers, Restraints, and Key Trends of the Oral Food Challenge (OFC) Testing Market?

Rising Adoption of OFC as the Gold-Standard Diagnostic Driver

One of the most significant growth drivers in the Oral Food Challenge (OFC) Testing Market is its establishment as the gold-standard confirmatory diagnostic method for food allergies. Unlike skin-prick testing or serum-specific IgE assays, which often present false positives due to sensitization without clinical reactivity, OFCs provide a definitive determination of tolerance. This makes them indispensable for accurate diagnosis, particularly in pediatric populations, which account for over 80% of the testing volume.

Clinical guidelines from organizations such as the American Academy of Allergy, Asthma & Immunology (AAAAI) and the European Academy of Allergy and Clinical Immunology (EAACI) mandate OFC prior to introducing strict dietary avoidance or beginning oral immunotherapy (OIT). In the USA and Europe, insurers increasingly recognize OFC as medically necessary, improving reimbursement access.

With food allergies continuing to rise globally affecting nearly 10% of children in some developed markets the reliance on OFC testing to avoid unnecessary restrictions, improve quality of life, and guide therapeutic decisions is accelerating institutional adoption. This regulatory endorsement, coupled with growing real-world evidence of cost-effectiveness in avoiding misdiagnosis, is fueling steady demand growth across hospitals and specialized allergy clinics.

High Operational Risk and Resource Intensiveness as a Barrier

While OFCs are indispensable for accurate diagnosis, they remain underutilized due to their inherent clinical and operational risks. Conducting a challenge requires specialized infrastructure, including allergen-specific dosing materials, standardized protocols, and immediate access to emergency interventions such as epinephrine and advanced resuscitation.

The risk of inducing severe anaphylaxis during testing is a constant barrier, making hospitals and tertiary allergy centers the primary testing hubs. Smaller clinics and community practices often avoid offering OFCs due to liability concerns, shortage of trained allergists, and absence of controlled environments. Furthermore, the test is highly resource-intensive, often requiring half a day to conduct under continuous patient observation, which strains staffing availability.

From a cost perspective, the operational burden including personnel, equipment, and safety preparedness discourages scaling OFCs outside major centers. These limitations restrict the market’s ability to expand into retail or outpatient segments, reinforcing dependence on institutional adoption. As healthcare systems push toward decentralization of diagnostics, the inability of OFCs to scale easily due to safety risks remains a critical restraint on broader market penetration.

Integration of OFCs into OIT Treatment Pathways as a Key Trend

A transformative trend reshaping the OFC market is the integration of oral food challenges into oral immunotherapy (OIT) pathways. With regulatory approvals for peanut immunotherapy (e.g., Palforzia in the USA and Europe), OFCs are increasingly required at multiple stages of patient management initial diagnosis, baseline reactivity measurement, therapy eligibility confirmation, and post-treatment tolerance assessment. This shift elevates OFCs from being a one-time diagnostic to a longitudinal monitoring tool embedded in therapeutic journeys.

Providers in the USA and Europe are designing dedicated OFC units within allergy centers, ensuring continuity between diagnostic evaluation and OIT initiation. Academic institutions are conducting clinical trials that rely heavily on DBPCFCs (Double-Blind Placebo-Controlled Food Challenges) as validated outcome measures, further reinforcing standardization.

Beyond immunotherapy, OFCs are gaining traction in nutritional reintroduction programs, particularly in cases of suspected tolerance development in children with milk or egg allergies. The convergence of diagnostics with therapeutics is creating new revenue opportunities, as OFCs transition from being reactive confirmatory tools to proactive components of personalized allergy management. This integration trend is expected to accelerate adoption globally, particularly as new OIT products targeting multiple allergens progress through late-stage pipelines.
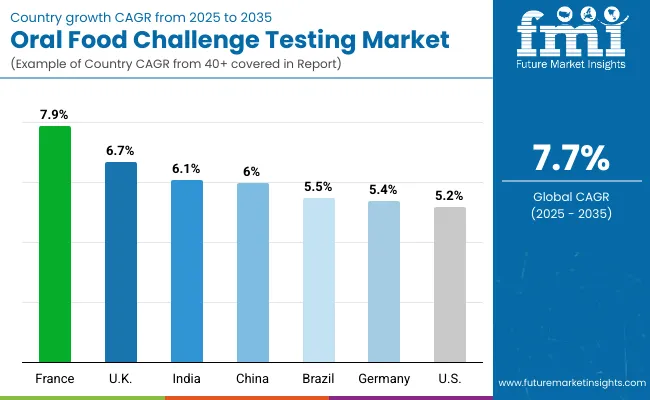
Analysis of Oral Food Challenge (OFC) Testing Market By Key Countries

Oral Food Challenge Testing Market By Country

Asia Pacific is emerging as the fastest-growing region in the Oral Food Challenge (OFC) Testing Market, with India projected to expand at a CAGR of 6.1% and China at 6.0% between 2025 and 2035. Growth in India is supported by a surge in pediatric allergy prevalence, expansion of tertiary care hospitals, and increased adherence to standardized allergy testing protocols recommended by IAP. China is witnessing rapid growth driven by rising peanut and milk allergy cases, large-scale investments in pediatric care infrastructure, and public sector initiatives to strengthen allergy testing capacity in Tier 1 and Tier 2 cities. Collectively, government-backed healthcare modernization and increasing demand for guideline-based confirmatory testing are propelling adoption of OFC across Asia Pacific.

Europe is expected to grow steadily at a CAGR of 7.3% through 2035. Germany is projected to grow at 5.4% CAGR, supported by structured reimbursement for DBPCFC testing and integration into pediatric allergy centers. France is estimated at 7.9% CAGR, driven by public hospital investments and national reforms expanding access to food allergy diagnostics. The UK is forecast at 6.7% CAGR, fueled by NHS modernization projects and growing demand for OIT-linked OFCs. Harmonized EAACI guidelines, expansion of pediatric allergy units, and strong clinical trial activity utilizing OFC as a primary endpoint are reinforcing Europe’s position as a key growth region.

North America remains a mature but innovation-driven market, with the USA projected to grow at 5.2% CAGR between 2025-2035. Growth is led by the replacement of informal diagnostic practices with structured OFC protocols in academic and specialty clinics. Increasing insurance recognition of OFC as a reimbursable service, rising pediatric allergy prevalence, and the requirement of OFC prior to initiating peanut oral immunotherapy (OIT) are major drivers. Academic centers such as Mount Sinai (NY) and leading providers are standardizing blinded and multi-allergen protocols, ensuring innovation and improved patient safety.
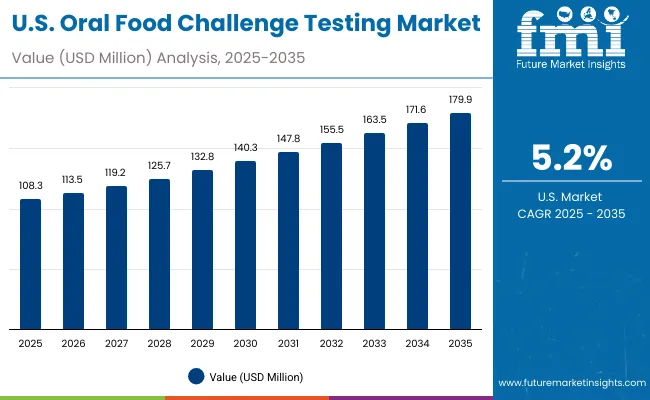
Sales Outlook for Oral Food Challenge Testing in the United States

Oral Food Challenge Testing Market Usa

The Oral Food Challenge Testing market in the USA is forecasted to grow at a 5.2% CAGR between 2025-2035, reaching nearly USD 179.9 million by 2035. Growth is being driven by rising prevalence of pediatric peanut and milk allergies, combined with guideline-based mandates from AAAAI and NIAID positioning OFC as the gold standard before oral immunotherapy (OIT). Hospitals and specialty allergy centers are formalizing OFC programs with standardized safety protocols, emergency preparedness, and blinded formats. Increasing payer recognition of OFC as a reimbursable diagnostic service is also expanding access.

  • Hospitals are scaling OFC adoption as part of pediatric allergy centers, with integrated monitoring protocols.
  • Specialty allergy clinics are expanding capacity for DBPCFC testing, particularly for OIT eligibility.
  • Academic centers like Mount Sinai are pioneering multi-allergen OFC trials to strengthen standardization and improve outcomes.

Growth and Expansion Outlook for Oral Food Challenge Testing in the United Kingdom

The Oral Food Challenge Testing market in the UK is projected to grow at a 6.7% CAGR through 2035, supported by NHS initiatives to expand pediatric allergy services. Investments under national health modernization plans are accelerating the establishment of specialized allergy clinics with capacity for blinded OFCs. Increasing emphasis on reducing misdiagnosis and unnecessary food avoidance is reinforcing OFC adoption, particularly for peanuts, eggs, and milk.

  • NHS Trust hospitals are scaling standardized OFC protocols across regional networks to optimize resources.
  • Pediatric allergy units are prioritizing DBPCFC for complex cases, ensuring patient safety and guideline compliance.
  • Clinical research groups are integrating OFC as an endpoint in immunotherapy and desensitization studies, further supporting long-term adoption.

In-depth Analysis of Oral Food Challenge Testing in Germany

The Oral Food Challenge Testing market in Germany is forecasted to grow at a 5.4% CAGR between 2025-2035, driven by rising food allergy prevalence and strong reimbursement alignment for standardized testing. Germany’s healthcare system, known for rigorous clinical protocols, is accelerating the transition from reliance on IgE blood testing to confirmatory OFCs in pediatric and adult populations. Federal hospital reforms and investments under modernization programs are facilitating expansion of dedicated allergy centers capable of performing DBPCFCs.
  • University hospitals are incorporating OFC into integrated pediatric allergy programs with advanced monitoring.
  • Private specialty clinics are adopting open and single-blind formats for accessibility, while DBPCFC remains concentrated in tertiary centers.
  • Research consortia are standardizing protocols for multi-center clinical trials, reinforcing Germany’s leadership in allergy testing innovation.

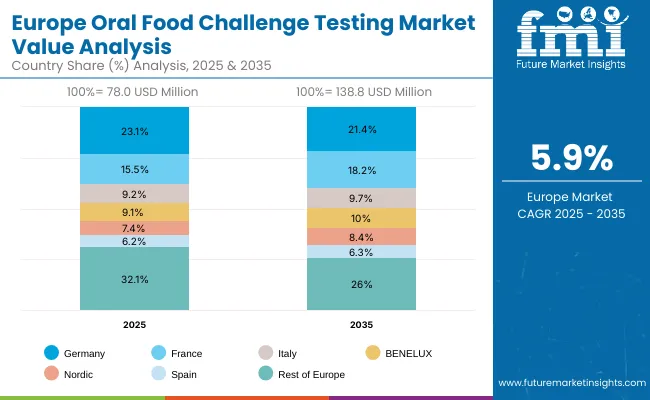
Europe Oral Food Challenge Testing Market Value Analysis By Country

Oral Food Challenge Testing Market Europe

Market Expansion Outlook for Oral Food Challenge Testing Market in India

The Oral Food Challenge (OFC) Testing market in India is expected to grow at a CAGR of 6.1% between 2025 and 2035, making it one of the fastest-growing globally. Growth is supported by a sharp rise in pediatric food allergy prevalence and the establishment of tertiary pediatric hospitals across Tier 1 and Tier 2 cities. National guidelines from the Indian Academy of Pediatrics (IAP) are increasing standardization of OFC protocols, while awareness campaigns are reducing diagnostic delays. Private hospital groups are investing in structured OFC programs as part of dedicated pediatric allergy centers.

  • Multi-specialty hospitals are formalizing OFC clinics to handle rising peanut and milk allergy cases.
  • Medical colleges are integrating OFC into training and clinical research, supporting physician adoption.
  • Tier 2 city hospitals are piloting simplified OFC setups to expand access beyond major metros.

Sales Outlook for Oral Food Challenge Testing Market in China

The Oral Food Challenge Testing market in China is projected to grow at a CAGR of 6.0% through 2035, driven by rising incidence of food allergies, particularly among children in urban centers. The Healthy China 2030 policy has prioritized allergy prevention and diagnosis, boosting investments in pediatric allergy units. Class A hospitals are scaling DBPCFC (Double-Blind Placebo-Controlled Food Challenges) capacity, while regional hospitals are adopting open challenges as entry-level diagnostics. Domestic players are also aligning with government programs to expand allergy testing infrastructure in secondary cities.
  • Tier 1 hospitals are deploying blinded OFC programs to complement immunotherapy trials.
  • County-level hospitals are offering open challenges to address milk and egg allergy diagnosis.
  • Research collaborations are making OFC protocols part of multi-allergen studies, reinforcing standardization.

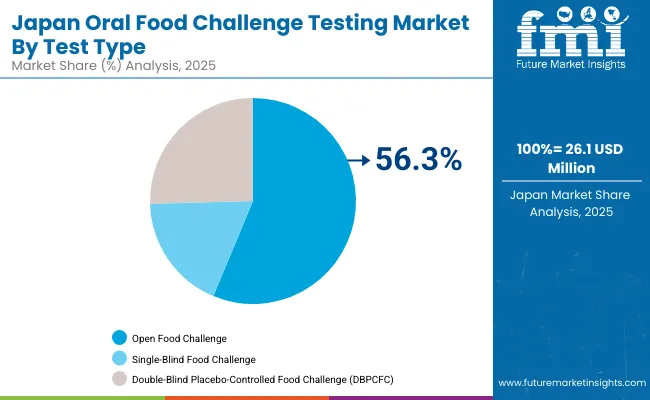
Growth Outlook of Oral Food Challenge Testing Market in Japan

Oral Food Challenge Testing Market Japan

The Oral Food Challenge Testing market in Japan is projected to reach USD 26.1 million by 2025, expanding at a 5.6% CAGR through 2035. Japan’s market is unique, with Open Food Challenges accounting for 58.2% of testing in 2025, followed by single-blind with 18.3%and DBPCFC holding 25.4%. The Ministry of Health, Labour and Welfare continues to support allergy centers in pediatric hospitals, prioritizing safety protocols. Rising demand for milk and egg allergy confirmation is reinforcing adoption, while DBPCFC remains concentrated in academic and research centers.
  • Market in Japan holds 9.2% revenue share of the global market in 2025
  • Pediatric hospitals are scaling open challenges as first-line confirmatory tests.
  • Regional centers are adopting single-blind protocols to balance cost and accuracy.

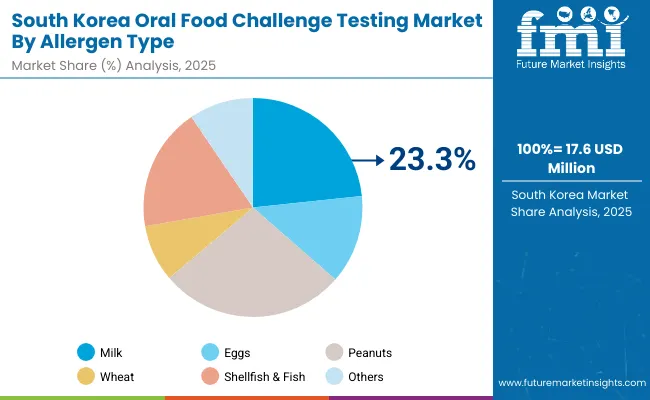
Opportunity Analysis of South Korea in Oral Food Challenge Testing Market

Oral Food Challenge Testing Market South Korea

The Oral Food Challenge Testing market in South Korea is estimated at USD 17.6 million in 2025 and projected to grow at a 6.3% CAGR through 2035. Allergen-specific segmentation shows peanut testing is estimated to hold 27.4%and milk testing contributing around 24.1% as the leading categories, reflecting Korea’s dietary allergy burden. Government-led programs to enhance pediatric allergy care are strengthening institutional adoption of OFC in university hospitals and large pediatric centers. Despite dominance of open challenges, there is a gradual shift toward DBPCFC for clinical validation in specialty clinics.
  • Market size for South Korea in 2025 is USD 17.6 million
  • South Korea holds 6.2% of the Global Market.
  • Specialty allergy clinics are expanding open OFC services to address growing childhood allergy cases.

Competition Landscape

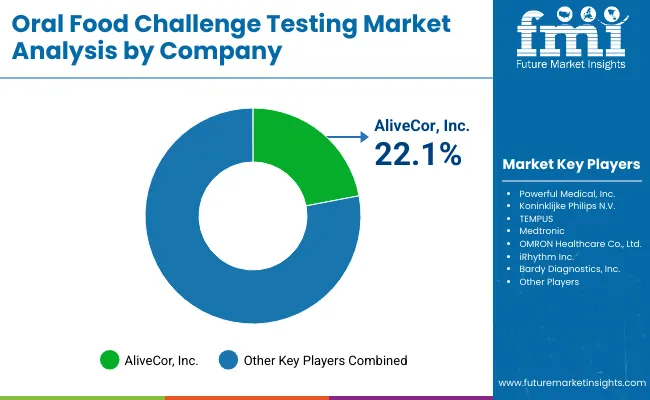
Oral Food Challenge Testing Market By Company

The Oral Food Challenge (OFC) Testing market is moderately concentrated, with global leaders, academic institutions, and specialized biopharma firms shaping the competitive landscape. Reacta Healthcare holds a dominant share of the market, supported by its proprietary standardized OFC dosing solutions and partnerships with leading hospitals across Europe and North America. Its strategy focuses on providing validated challenge kits that reduce variability, improve patient safety, and enable reproducibility across multi-center studies. By offering pre-measured allergen doses and clinical support services, Reacta is setting benchmarks in standardized OFC adoption.

Other players include Beckman Coulter Life Science who is set to play a critical role in advancing research-driven protocols and clinical best practices. Mount Sinai is recognized for its leadership in multi-allergen OFC trials and integration of blinded protocols into pediatric allergy centers, while UMC Utrecht continues to drive innovation in European OFC research, contributing to evidence-based practice standardization.Biopharma firms like Aimmune integrate OFC testing into broader oral immunotherapy (OIT) programs, making OFCs a key part of their therapeutic pathway strategy. This approach positions OFC not only as a diagnostic tool but also as a prerequisite for treatment eligibility and long-term monitoring.

Emerging players and regional institutions (Others) are contributing to OFC expansion by piloting simplified open challenge protocols, expanding access to underserved geographies, and engaging in pediatric-focused research collaborations. As the market matures, competitive differentiation is increasingly shifting toward protocol standardization, integration of OFC with OIT programs, and improved patient safety frameworks.

Key Developments:

  • In 2025, Reacta Healthcare expanded its pharmaceutical-grade challenge meal portfolio to include egg and milk, alongside peanut, marking a shift toward multi-allergen manufacturing. With prototypes for hazelnut and cashew underway, the company aims to support clinical trials and research in diagnosing and treating multiple food allergies globally.
  • In 2025, InBio and Beckman Coulter Life Sciences have partnered to advance food allergy research by integrating InBio’s validated allergen proteins into Beckman’s Next-Generation Basophil Activation Test. This collaboration enhances assay precision, reduces variability, and offers a reliable in vitro alternative to oral food challenges using advanced flow cytometry and automation.

Scope of the Report

Item Value
Market value (2025) USD 283.5 million
Test type Open Food Challenge, Single-Blind Food Challenge, and Double-Blind Placebo-Controlled Food Challenge (DBPCFC)
Allergen type milk, eggs, peanuts, wheat, shellfish & fish, and others
Age group children, adults, and geriatric populations
Sales channel institutional sales, retail sales
Regions Covered North America, Latin America, Western & Eastern Europe, East Asia, South Asia & Pacific, Middle East & Africa
Countries Covered USA, Brazil, China, India, Germany, France, UK etc.
Key Companies Profiled Reacta Healthcare, Beckman Coulter Life Science, UMC Utrecht, Aimmune, Others
Additional Attributes Dollar sales by allergen type and regions, adoption trends of Double-Blind Placebo-Controlled Food Challenges (DBPCFC), rising demand in pediatric allergy diagnosis, growing utilization across hospitals, specialty allergy clinics, and academic research centers.

Key Segments

By Test Type:

  • Open Food Challenge
  • Single-Blind Food Challenge
  • Double-Blind Placebo-Controlled Food Challenge (DBPCFC)

By Allergen Type:

  • Milk
  • Eggs
  • Peanuts
  • Wheat
  • Shellfish & Fish
  • Others

By Age Group:

  • Children
  • Adults
  • Geriatric

By Sales Channel:

  • Institutional Sales
  • Retail Sales

By Region:

  • North America
  • Latin America
  • East Asia
  • South Asia & Pacific
  • Western Europe
  • Eastern Europe
  • Middle East & Africa

Table of Content

  1. Executive Summary
    • Global Market Outlook
    • Demand-side Trends
    • Supply-side Trends
    • Technology Roadmap Analysis
    • Analysis and Recommendations
  2. Market Overview
    • Market Coverage / Taxonomy
    • Market Definition / Scope / Limitations
  3. Market Background
    • Market Dynamics
      • Drivers
      • Restraints
      • Opportunity
      • Trends
    • Scenario Forecast
      • Demand in Optimistic Scenario
      • Demand in Likely Scenario
      • Demand in Conservative Scenario
    • Opportunity Map Analysis
    • Product Life Cycle Analysis
    • Supply Chain Analysis
      • Supply Side Participants and their Roles
        • Producers
        • Mid-Level Participants (Traders/ Agents/ Brokers)
        • Wholesalers and Distributors
      • Value Added and Value Created at Node in the Supply Chain
      • List of Raw Material Suppliers
      • List of Existing and Potential Buyer’s
    • Investment Feasibility Matrix
    • Value Chain Analysis
      • Profit Margin Analysis
      • Wholesalers and Distributors
      • Retailers
    • PESTLE and Porter’s Analysis
    • Regulatory Landscape
      • By Key Regions
      • By Key Countries
    • Regional Parent Market Outlook
    • Production and Consumption Statistics
    • Import and Export Statistics
  4. Global Market Analysis 2020 to 2024 and Forecast, 2025 to 2035
    • Historical Market Size Value (USD Million) & Volume (Units) Analysis, 2020 to 2024
    • Current and Future Market Size Value (USD Million) & Volume (Units) Projections, 2025 to 2035
      • Y-o-Y Growth Trend Analysis
      • Absolute $ Opportunity Analysis
  5. Global Market Analysis 2020 to 2024 and Forecast 2025 to 2035, By Test Type
    • Introduction / Key Findings
    • Historical Market Size Value (USD Million) & Volume (Units) Analysis By Test Type, 2020 to 2024
    • Current and Future Market Size Value (USD Million) & Volume (Units) Analysis and Forecast By Test Type, 2025 to 2035
      • Open Food Challenge
      • Single-Blind Food Challenge
      • Double-Blind Placebo-Controlled Food Challenge (DBPCFC)
    • Y-o-Y Growth Trend Analysis By Test Type, 2020 to 2024
    • Absolute $ Opportunity Analysis By Test Type, 2025 to 2035
  6. Global Market Analysis 2020 to 2024 and Forecast 2025 to 2035, By Allergen Type
    • Introduction / Key Findings
    • Historical Market Size Value (USD Million) & Volume (Units) Analysis By Allergen Type, 2020 to 2024
    • Current and Future Market Size Value (USD Million) & Volume (Units) Analysis and Forecast By Allergen Type, 2025 to 2035
      • Milk
      • Eggs
      • Peanuts
      • Wheat
      • Shellfish & Fish
      • Others
    • Y-o-Y Growth Trend Analysis By Allergen Type, 2020 to 2024
    • Absolute $ Opportunity Analysis By Allergen Type, 2025 to 2035
  7. Global Market Analysis 2020 to 2024 and Forecast 2025 to 2035, By Age Group
    • Introduction / Key Findings
    • Historical Market Size Value (USD Million) & Volume (Units) Analysis By Age Group, 2020 to 2024
    • Current and Future Market Size Value (USD Million) & Volume (Units) Analysis and Forecast By Age Group, 2025 to 2035
      • Children
      • Adults
      • Geriatric
    • Y-o-Y Growth Trend Analysis By Age Group, 2020 to 2024
    • Absolute $ Opportunity Analysis By Age Group, 2025 to 2035
  8. Global Market Analysis 2020 to 2024 and Forecast 2025 to 2035, By Sales Channel
    • Introduction / Key Findings
    • Historical Market Size Value (USD Million) & Volume (Units) Analysis By Sales Channel, 2020 to 2024
    • Current and Future Market Size Value (USD Million) & Volume (Units) Analysis and Forecast By Sales Channel, 2025 to 2035
      • Institutional Sales
      • Retail Sales
    • Y-o-Y Growth Trend Analysis By Sales Channel, 2020 to 2024
    • Absolute $ Opportunity Analysis By Sales Channel, 2025 to 2035
  9. Global Market Analysis 2020 to 2024 and Forecast 2025 to 2035, By Region
    • Introduction
    • Historical Market Size Value (USD Million) & Volume (Units) Analysis By Region, 2020 to 2024
    • Current Market Size Value (USD Million) & Volume (Units) Analysis and Forecast By Region, 2025 to 2035
      • North America
      • Latin America
      • East Asia
      • South Asia & Pacific
      • Western Europe
      • Eastern Europe
      • Middle East & Africa
    • Market Attractiveness Analysis By Region
  10. North America Market Analysis 2020 to 2024 and Forecast 2025 to 2035, By Country
    • Historical Market Size Value (USD Million) & Volume (Units) Trend Analysis By Market Taxonomy, 2020 to 2024
    • Market Size Value (USD Million) & Volume (Units) Forecast By Market Taxonomy, 2025 to 2035
      • By Country
        • USA
        • Canada
        • Mexico
      • By Test Type
      • By Allergen Type
      • By Age Group
      • By Sales Channel
    • Market Attractiveness Analysis
      • By Country
      • By Test Type
      • By Allergen Type
      • By Age Group
      • By Sales Channel
    • Key Takeaways
  11. Latin America Market Analysis 2020 to 2024 and Forecast 2025 to 2035, By Country
    • Historical Market Size Value (USD Million) & Volume (Units) Trend Analysis By Market Taxonomy, 2020 to 2024
    • Market Size Value (USD Million) & Volume (Units) Forecast By Market Taxonomy, 2025 to 2035
      • By Country
        • Brazil
        • Argentina
        • Rest of Latin America
      • By Test Type
      • By Allergen Type
      • By Age Group
      • By Sales Channel
    • Market Attractiveness Analysis
      • By Country
      • By Test Type
      • By Allergen Type
      • By Age Group
      • By Sales Channel
    • Key Takeaways
  12. East Asia Market Analysis 2020 to 2024 and Forecast 2025 to 2035, By Country
    • Historical Market Size Value (USD Million) & Volume (Units) Trend Analysis By Market Taxonomy, 2020 to 2024
    • Market Size Value (USD Million) & Volume (Units) Forecast By Market Taxonomy, 2025 to 2035
      • By Country
        • China
        • Japan
        • South Korea
      • By Test Type
      • By Allergen Type
      • By Age Group
      • By Sales Channel
    • Market Attractiveness Analysis
      • By Country
      • By Test Type
      • By Allergen Type
      • By Age Group
      • By Sales Channel
    • Key Takeaways
  13. South Asia & Pacific Market Analysis 2020 to 2024 and Forecast 2025 to 2035, By Country
    • Historical Market Size Value (USD Million) & Volume (Units) Trend Analysis By Market Taxonomy, 2020 to 2024
    • Market Size Value (USD Million) & Volume (Units) Forecast By Market Taxonomy, 2025 to 2035
      • By Country
        • India
        • ASEAN Countries
        • Australia& New Zealand
        • Rest of South Asia
      • By Test Type
      • By Allergen Type
      • By Age Group
      • By Sales Channel
    • Market Attractiveness Analysis
      • By Country
      • By Test Type
      • By Allergen Type
      • By Age Group
      • By Sales Channel
    • Key Takeaways
  14. Western Europe Market Analysis 2020 to 2024 and Forecast 2025 to 2035, By Country
    • Historical Market Size Value (USD Million) & Volume (Units) Trend Analysis By Market Taxonomy, 2020 to 2024
    • Market Size Value (USD Million) & Volume (Units) Forecast By Market Taxonomy, 2025 to 2035
      • By Country
        • Germany
        • UK
        • France
        • Italy
        • Spain
        • BENELUX
        • Nordic Countries
        • Rest of Western Europe
      • By Test Type
      • By Allergen Type
      • By Age Group
      • By Sales Channel
    • Market Attractiveness Analysis
      • By Country
      • By Test Type
      • By Allergen Type
      • By Age Group
      • By Sales Channel
    • Key Takeaways
  15. Eastern Europe Market Analysis 2020 to 2024 and Forecast 2025 to 2035, By Country
    • Historical Market Size Value (USD Million) & Volume (Units) Trend Analysis By Market Taxonomy, 2020 to 2024
    • Market Size Value (USD Million) & Volume (Units) Forecast By Market Taxonomy, 2025 to 2035
      • By Country
        • Russia
        • Hungary
        • Poland
        • Rest of Eastern Europe
      • By Test Type
      • By Allergen Type
      • By Age Group
      • By Sales Channel
    • Market Attractiveness Analysis
      • By Country
      • By Test Type
      • By Allergen Type
      • By Age Group
      • By Sales Channel
    • Key Takeaways
  16. Middle East & Africa Market Analysis 2020 to 2024 and Forecast 2025 to 2035, By Country
    • Historical Market Size Value (USD Million) & Volume (Units) Trend Analysis By Market Taxonomy, 2020 to 2024
    • Market Size Value (USD Million) & Volume (Units) Forecast By Market Taxonomy, 2025 to 2035
      • By Country
        • Saudi Arabia
        • Türkiye
        • South Africa
        • Other African Union
        • Rest of Middle East & Africa
      • By Test Type
      • By Allergen Type
      • By Age Group
      • By Sales Channel
    • Market Attractiveness Analysis
      • By Country
      • By Test Type
      • By Allergen Type
      • By Age Group
      • By Sales Channel
    • Key Takeaways
  17. Key Countries Market Analysis
    • USA
      • Pricing Analysis
      • Market Share Analysis, 2024
        • By Test Type
        • By Allergen Type
        • By Age Group
        • By Sales Channel
    • Brazil
      • Pricing Analysis
      • Market Share Analysis, 2024
        • By Test Type
        • By Allergen Type
        • By Age Group
        • By Sales Channel
    • China
      • Pricing Analysis
      • Market Share Analysis, 2024
        • By Test Type
        • By Allergen Type
        • By Age Group
        • By Sales Channel
    • India
      • Pricing Analysis
      • Market Share Analysis, 2024
        • By Test Type
        • By Allergen Type
        • By Age Group
        • By Sales Channel
    • Europe
      • Pricing Analysis
      • Market Share Analysis, 2024
        • By Test Type
        • By Allergen Type
        • By Age Group
        • By Sales Channel
    • Germany
      • Pricing Analysis
      • Market Share Analysis, 2024
        • By Test Type
        • By Allergen Type
        • By Age Group
        • By Sales Channel
    • France
      • Pricing Analysis
      • Market Share Analysis, 2024
        • By Test Type
        • By Allergen Type
        • By Age Group
        • By Sales Channel
    • UK
      • Pricing Analysis
      • Market Share Analysis, 2024
        • By Test Type
        • By Allergen Type
        • By Age Group
        • By Sales Channel
  18. Market Structure Analysis
    • Competition Dashboard
    • Competition Benchmarking
    • Market Share Analysis of Top Players
      • By Regional
      • By Test Type
      • By Allergen Type
      • By Age Group
      • By Sales Channel
  19. Competition Analysis
    • Competition Deep Dive
      • Reacta Healthcare
        • Overview
        • Product Portfolio
        • Profitability by Market Segments (Product/Age /Sales Channel/Region)
        • Sales Footprint
        • Strategy Overview
          • Marketing Strategy
          • Product Strategy
          • Channel Strategy
      • Mount Sinai (NY)
        • Overview
        • Product Portfolio
        • Profitability by Market Segments (Product/Age /Sales Channel/Region)
        • Sales Footprint
        • Strategy Overview
          • Marketing Strategy
          • Product Strategy
          • Channel Strategy
      • UMC Utrecht
        • Overview
        • Product Portfolio
        • Profitability by Market Segments (Product/Age /Sales Channel/Region)
        • Sales Footprint
        • Strategy Overview
          • Marketing Strategy
          • Product Strategy
          • Channel Strategy
      • Aimmune
        • Overview
        • Product Portfolio
        • Profitability by Market Segments (Product/Age /Sales Channel/Region)
        • Sales Footprint
        • Strategy Overview
          • Marketing Strategy
          • Product Strategy
          • Channel Strategy
      • Others
        • Overview
        • Product Portfolio
        • Profitability by Market Segments (Product/Age /Sales Channel/Region)
        • Sales Footprint
        • Strategy Overview
          • Marketing Strategy
          • Product Strategy
          • Channel Strategy
  20. Assumptions & Acronyms Used
  21. Research Methodology

List of Tables

  • Table 1: Global Market Value (USD Million) Forecast by Region, 2020-2035
  • Table 2: Global Market Volume (Units) Forecast by Region, 2020-2035
  • Table 3: Global Market Value (USD Million) Forecast by Test Type, 2020-2035
  • Table 4: Global Market Volume (Units) Forecast by Test Type, 2020-2035
  • Table 5: Global Market Value (USD Million) Forecast by Allergen Type, 2020-2035
  • Table 6: Global Market Volume (Units) Forecast by Allergen Type, 2020-2035
  • Table 7: Global Market Value (USD Million) Forecast by Age Group, 2020-2035
  • Table 8: Global Market Volume (Units) Forecast by Age Group, 2020-2035
  • Table 9: Global Market Value (USD Million) Forecast by Sales Channel, 2020-2035
  • Table 10: Global Market Volume (Units) Forecast by Sales Channel, 2020-2035
  • Table 11: North America Market Value (USD Million) Forecast by Country, 2020-2035
  • Table 12: North America Market Volume (Units) Forecast by Country, 2020-2035
  • Table 13: North America Market Value (USD Million) Forecast by Test Type, 2020-2035
  • Table 14: North America Market Volume (Units) Forecast by Test Type, 2020-2035
  • Table 15: North America Market Value (USD Million) Forecast by Allergen Type, 2020-2035
  • Table 16: North America Market Volume (Units) Forecast by Allergen Type, 2020-2035
  • Table 17: North America Market Value (USD Million) Forecast by Age Group, 2020-2035
  • Table 18: North America Market Volume (Units) Forecast by Age Group, 2020-2035
  • Table 19: North America Market Value (USD Million) Forecast by Sales Channel, 2020-2035
  • Table 20: North America Market Volume (Units) Forecast by Sales Channel, 2020-2035
  • Table 21: Latin America Market Value (USD Million) Forecast by Country, 2020-2035
  • Table 22: Latin America Market Volume (Units) Forecast by Country, 2020-2035
  • Table 23: Latin America Market Value (USD Million) Forecast by Test Type, 2020-2035
  • Table 24: Latin America Market Volume (Units) Forecast by Test Type, 2020-2035
  • Table 25: Latin America Market Value (USD Million) Forecast by Allergen Type, 2020-2035
  • Table 26: Latin America Market Volume (Units) Forecast by Allergen Type, 2020-2035
  • Table 27: Latin America Market Value (USD Million) Forecast by Age Group, 2020-2035
  • Table 28: Latin America Market Volume (Units) Forecast by Age Group, 2020-2035
  • Table 29: Latin America Market Value (USD Million) Forecast by Sales Channel, 2020-2035
  • Table 30: Latin America Market Volume (Units) Forecast by Sales Channel, 2020-2035
  • Table 31: East Asia Market Value (USD Million) Forecast by Country, 2020-2035
  • Table 32: East Asia Market Volume (Units) Forecast by Country, 2020-2035
  • Table 33: East Asia Market Value (USD Million) Forecast by Test Type, 2020-2035
  • Table 34: East Asia Market Volume (Units) Forecast by Test Type, 2020-2035
  • Table 35: East Asia Market Value (USD Million) Forecast by Allergen Type, 2020-2035
  • Table 36: East Asia Market Volume (Units) Forecast by Allergen Type, 2020-2035
  • Table 37: East Asia Market Value (USD Million) Forecast by Age Group, 2020-2035
  • Table 38: East Asia Market Volume (Units) Forecast by Age Group, 2020-2035
  • Table 39: East Asia Market Value (USD Million) Forecast by Sales Channel, 2020-2035
  • Table 40: East Asia Market Volume (Units) Forecast by Sales Channel, 2020-2035
  • Table 41: South Asia & Pacific Market Value (USD Million) Forecast by Country, 2020-2035
  • Table 42: South Asia & Pacific Market Volume (Units) Forecast by Country, 2020-2035
  • Table 43: South Asia & Pacific Market Value (USD Million) Forecast by Test Type, 2020-2035
  • Table 44: South Asia & Pacific Market Volume (Units) Forecast by Test Type, 2020-2035
  • Table 45: South Asia & Pacific Market Value (USD Million) Forecast by Allergen Type, 2020-2035
  • Table 46: South Asia & Pacific Market Volume (Units) Forecast by Allergen Type, 2020-2035
  • Table 47: South Asia & Pacific Market Value (USD Million) Forecast by Age Group, 2020-2035
  • Table 48: South Asia & Pacific Market Volume (Units) Forecast by Age Group, 2020-2035
  • Table 49: South Asia & Pacific Market Value (USD Million) Forecast by Sales Channel, 2020-2035
  • Table 50: South Asia & Pacific Market Volume (Units) Forecast by Sales Channel, 2020-2035
  • Table 51: Western Europe Market Value (USD Million) Forecast by Country, 2020-2035
  • Table 52: Western Europe Market Volume (Units) Forecast by Country, 2020-2035
  • Table 53: Western Europe Market Value (USD Million) Forecast by Test Type, 2020-2035
  • Table 54: Western Europe Market Volume (Units) Forecast by Test Type, 2020-2035
  • Table 55: Western Europe Market Value (USD Million) Forecast by Allergen Type, 2020-2035
  • Table 56: Western Europe Market Volume (Units) Forecast by Allergen Type, 2020-2035
  • Table 57: Western Europe Market Value (USD Million) Forecast by Age Group, 2020-2035
  • Table 58: Western Europe Market Volume (Units) Forecast by Age Group, 2020-2035
  • Table 59: Western Europe Market Value (USD Million) Forecast by Sales Channel, 2020-2035
  • Table 60: Western Europe Market Volume (Units) Forecast by Sales Channel, 2020-2035
  • Table 61: Eastern Europe Market Value (USD Million) Forecast by Country, 2020-2035
  • Table 62: Eastern Europe Market Volume (Units) Forecast by Country, 2020-2035
  • Table 63: Eastern Europe Market Value (USD Million) Forecast by Test Type, 2020-2035
  • Table 64: Eastern Europe Market Volume (Units) Forecast by Test Type, 2020-2035
  • Table 65: Eastern Europe Market Value (USD Million) Forecast by Allergen Type, 2020-2035
  • Table 66: Eastern Europe Market Volume (Units) Forecast by Allergen Type, 2020-2035
  • Table 67: Eastern Europe Market Value (USD Million) Forecast by Age Group, 2020-2035
  • Table 68: Eastern Europe Market Volume (Units) Forecast by Age Group, 2020-2035
  • Table 69: Eastern Europe Market Value (USD Million) Forecast by Sales Channel, 2020-2035
  • Table 70: Eastern Europe Market Volume (Units) Forecast by Sales Channel, 2020-2035
  • Table 71: Middle East & Africa Market Value (USD Million) Forecast by Country, 2020-2035
  • Table 72: Middle East & Africa Market Volume (Units) Forecast by Country, 2020-2035
  • Table 73: Middle East & Africa Market Value (USD Million) Forecast by Test Type, 2020-2035
  • Table 74: Middle East & Africa Market Volume (Units) Forecast by Test Type, 2020-2035
  • Table 75: Middle East & Africa Market Value (USD Million) Forecast by Allergen Type, 2020-2035
  • Table 76: Middle East & Africa Market Volume (Units) Forecast by Allergen Type, 2020-2035
  • Table 77: Middle East & Africa Market Value (USD Million) Forecast by Age Group, 2020-2035
  • Table 78: Middle East & Africa Market Volume (Units) Forecast by Age Group, 2020-2035
  • Table 79: Middle East & Africa Market Value (USD Million) Forecast by Sales Channel, 2020-2035
  • Table 80: Middle East & Africa Market Volume (Units) Forecast by Sales Channel, 2020-2035

List of Figures

  • Figure 1: Global Market Value (USD Million) by Test Type, 2025-2035
  • Figure 2: Global Market Value (USD Million) by Allergen Type, 2025-2035
  • Figure 3: Global Market Value (USD Million) by Age Group, 2025-2035
  • Figure 4: Global Market Value (USD Million) by Sales Channel, 2025-2035
  • Figure 5: Global Market Value (USD Million) by Region, 2025-2035
  • Figure 6: Global Market Value (USD Million) Analysis by Region, 2020-2035
  • Figure 7: Global Market Volume (Units) Analysis by Region, 2020-2035
  • Figure 8: Global Market Value Share (%) and BPS Analysis by Region, 2025-2035
  • Figure 9: Global Market Y-o-Y Growth (%) Projections by Region, 2025-2035
  • Figure 10: Global Market Value (USD Million) Analysis by Test Type, 2020-2035
  • Figure 11: Global Market Volume (Units) Analysis by Test Type, 2020-2035
  • Figure 12: Global Market Value Share (%) and BPS Analysis by Test Type, 2025-2035
  • Figure 13: Global Market Y-o-Y Growth (%) Projections by Test Type, 2025-2035
  • Figure 14: Global Market Value (USD Million) Analysis by Allergen Type, 2020-2035
  • Figure 15: Global Market Volume (Units) Analysis by Allergen Type, 2020-2035
  • Figure 16: Global Market Value Share (%) and BPS Analysis by Allergen Type, 2025-2035
  • Figure 17: Global Market Y-o-Y Growth (%) Projections by Allergen Type, 2025-2035
  • Figure 18: Global Market Value (USD Million) Analysis by Age Group, 2020-2035
  • Figure 19: Global Market Volume (Units) Analysis by Age Group, 2020-2035
  • Figure 20: Global Market Value Share (%) and BPS Analysis by Age Group, 2025-2035
  • Figure 21: Global Market Y-o-Y Growth (%) Projections by Age Group, 2025-2035
  • Figure 22: Global Market Value (USD Million) Analysis by Sales Channel, 2020-2035
  • Figure 23: Global Market Volume (Units) Analysis by Sales Channel, 2020-2035
  • Figure 24: Global Market Value Share (%) and BPS Analysis by Sales Channel, 2025-2035
  • Figure 25: Global Market Y-o-Y Growth (%) Projections by Sales Channel, 2025-2035
  • Figure 26: Global Market Attractiveness by Test Type, 2025-2035
  • Figure 27: Global Market Attractiveness by Allergen Type, 2025-2035
  • Figure 28: Global Market Attractiveness by Age Group, 2025-2035
  • Figure 29: Global Market Attractiveness by Sales Channel, 2025-2035
  • Figure 30: Global Market Attractiveness by Region, 2025-2035
  • Figure 31: North America Market Value (USD Million) by Test Type, 2025-2035
  • Figure 32: North America Market Value (USD Million) by Allergen Type, 2025-2035
  • Figure 33: North America Market Value (USD Million) by Age Group, 2025-2035
  • Figure 34: North America Market Value (USD Million) by Sales Channel, 2025-2035
  • Figure 35: North America Market Value (USD Million) by Country, 2025-2035
  • Figure 36: North America Market Value (USD Million) Analysis by Country, 2020-2035
  • Figure 37: North America Market Volume (Units) Analysis by Country, 2020-2035
  • Figure 38: North America Market Value Share (%) and BPS Analysis by Country, 2025-2035
  • Figure 39: North America Market Y-o-Y Growth (%) Projections by Country, 2025-2035
  • Figure 40: North America Market Value (USD Million) Analysis by Test Type, 2020-2035
  • Figure 41: North America Market Volume (Units) Analysis by Test Type, 2020-2035
  • Figure 42: North America Market Value Share (%) and BPS Analysis by Test Type, 2025-2035
  • Figure 43: North America Market Y-o-Y Growth (%) Projections by Test Type, 2025-2035
  • Figure 44: North America Market Value (USD Million) Analysis by Allergen Type, 2020-2035
  • Figure 45: North America Market Volume (Units) Analysis by Allergen Type, 2020-2035
  • Figure 46: North America Market Value Share (%) and BPS Analysis by Allergen Type, 2025-2035
  • Figure 47: North America Market Y-o-Y Growth (%) Projections by Allergen Type, 2025-2035
  • Figure 48: North America Market Value (USD Million) Analysis by Age Group, 2020-2035
  • Figure 49: North America Market Volume (Units) Analysis by Age Group, 2020-2035
  • Figure 50: North America Market Value Share (%) and BPS Analysis by Age Group, 2025-2035
  • Figure 51: North America Market Y-o-Y Growth (%) Projections by Age Group, 2025-2035
  • Figure 52: North America Market Value (USD Million) Analysis by Sales Channel, 2020-2035
  • Figure 53: North America Market Volume (Units) Analysis by Sales Channel, 2020-2035
  • Figure 54: North America Market Value Share (%) and BPS Analysis by Sales Channel, 2025-2035
  • Figure 55: North America Market Y-o-Y Growth (%) Projections by Sales Channel, 2025-2035
  • Figure 56: North America Market Attractiveness by Test Type, 2025-2035
  • Figure 57: North America Market Attractiveness by Allergen Type, 2025-2035
  • Figure 58: North America Market Attractiveness by Age Group, 2025-2035
  • Figure 59: North America Market Attractiveness by Sales Channel, 2025-2035
  • Figure 60: North America Market Attractiveness by Country, 2025-2035
  • Figure 61: Latin America Market Value (USD Million) by Test Type, 2025-2035
  • Figure 62: Latin America Market Value (USD Million) by Allergen Type, 2025-2035
  • Figure 63: Latin America Market Value (USD Million) by Age Group, 2025-2035
  • Figure 64: Latin America Market Value (USD Million) by Sales Channel, 2025-2035
  • Figure 65: Latin America Market Value (USD Million) by Country, 2025-2035
  • Figure 66: Latin America Market Value (USD Million) Analysis by Country, 2020-2035
  • Figure 67: Latin America Market Volume (Units) Analysis by Country, 2020-2035
  • Figure 68: Latin America Market Value Share (%) and BPS Analysis by Country, 2025-2035
  • Figure 69: Latin America Market Y-o-Y Growth (%) Projections by Country, 2025-2035
  • Figure 70: Latin America Market Value (USD Million) Analysis by Test Type, 2020-2035
  • Figure 71: Latin America Market Volume (Units) Analysis by Test Type, 2020-2035
  • Figure 72: Latin America Market Value Share (%) and BPS Analysis by Test Type, 2025-2035
  • Figure 73: Latin America Market Y-o-Y Growth (%) Projections by Test Type, 2025-2035
  • Figure 74: Latin America Market Value (USD Million) Analysis by Allergen Type, 2020-2035
  • Figure 75: Latin America Market Volume (Units) Analysis by Allergen Type, 2020-2035
  • Figure 76: Latin America Market Value Share (%) and BPS Analysis by Allergen Type, 2025-2035
  • Figure 77: Latin America Market Y-o-Y Growth (%) Projections by Allergen Type, 2025-2035
  • Figure 78: Latin America Market Value (USD Million) Analysis by Age Group, 2020-2035
  • Figure 79: Latin America Market Volume (Units) Analysis by Age Group, 2020-2035
  • Figure 80: Latin America Market Value Share (%) and BPS Analysis by Age Group, 2025-2035
  • Figure 81: Latin America Market Y-o-Y Growth (%) Projections by Age Group, 2025-2035
  • Figure 82: Latin America Market Value (USD Million) Analysis by Sales Channel, 2020-2035
  • Figure 83: Latin America Market Volume (Units) Analysis by Sales Channel, 2020-2035
  • Figure 84: Latin America Market Value Share (%) and BPS Analysis by Sales Channel, 2025-2035
  • Figure 85: Latin America Market Y-o-Y Growth (%) Projections by Sales Channel, 2025-2035
  • Figure 86: Latin America Market Attractiveness by Test Type, 2025-2035
  • Figure 87: Latin America Market Attractiveness by Allergen Type, 2025-2035
  • Figure 88: Latin America Market Attractiveness by Age Group, 2025-2035
  • Figure 89: Latin America Market Attractiveness by Sales Channel, 2025-2035
  • Figure 90: Latin America Market Attractiveness by Country, 2025-2035
  • Figure 91: East Asia Market Value (USD Million) by Test Type, 2025-2035
  • Figure 92: East Asia Market Value (USD Million) by Allergen Type, 2025-2035
  • Figure 93: East Asia Market Value (USD Million) by Age Group, 2025-2035
  • Figure 94: East Asia Market Value (USD Million) by Sales Channel, 2025-2035
  • Figure 95: East Asia Market Value (USD Million) by Country, 2025-2035
  • Figure 96: East Asia Market Value (USD Million) Analysis by Country, 2020-2035
  • Figure 97: East Asia Market Volume (Units) Analysis by Country, 2020-2035
  • Figure 98: East Asia Market Value Share (%) and BPS Analysis by Country, 2025-2035
  • Figure 99: East Asia Market Y-o-Y Growth (%) Projections by Country, 2025-2035
  • Figure 100: East Asia Market Value (USD Million) Analysis by Test Type, 2020-2035
  • Figure 101: East Asia Market Volume (Units) Analysis by Test Type, 2020-2035
  • Figure 102: East Asia Market Value Share (%) and BPS Analysis by Test Type, 2025-2035
  • Figure 103: East Asia Market Y-o-Y Growth (%) Projections by Test Type, 2025-2035
  • Figure 104: East Asia Market Value (USD Million) Analysis by Allergen Type, 2020-2035
  • Figure 105: East Asia Market Volume (Units) Analysis by Allergen Type, 2020-2035
  • Figure 106: East Asia Market Value Share (%) and BPS Analysis by Allergen Type, 2025-2035
  • Figure 107: East Asia Market Y-o-Y Growth (%) Projections by Allergen Type, 2025-2035
  • Figure 108: East Asia Market Value (USD Million) Analysis by Age Group, 2020-2035
  • Figure 109: East Asia Market Volume (Units) Analysis by Age Group, 2020-2035
  • Figure 110: East Asia Market Value Share (%) and BPS Analysis by Age Group, 2025-2035
  • Figure 111: East Asia Market Y-o-Y Growth (%) Projections by Age Group, 2025-2035
  • Figure 112: East Asia Market Value (USD Million) Analysis by Sales Channel, 2020-2035
  • Figure 113: East Asia Market Volume (Units) Analysis by Sales Channel, 2020-2035
  • Figure 114: East Asia Market Value Share (%) and BPS Analysis by Sales Channel, 2025-2035
  • Figure 115: East Asia Market Y-o-Y Growth (%) Projections by Sales Channel, 2025-2035
  • Figure 116: East Asia Market Attractiveness by Test Type, 2025-2035
  • Figure 117: East Asia Market Attractiveness by Allergen Type, 2025-2035
  • Figure 118: East Asia Market Attractiveness by Age Group, 2025-2035
  • Figure 119: East Asia Market Attractiveness by Sales Channel, 2025-2035
  • Figure 120: East Asia Market Attractiveness by Country, 2025-2035
  • Figure 121: South Asia & Pacific Market Value (USD Million) by Test Type, 2025-2035
  • Figure 122: South Asia & Pacific Market Value (USD Million) by Allergen Type, 2025-2035
  • Figure 123: South Asia & Pacific Market Value (USD Million) by Age Group, 2025-2035
  • Figure 124: South Asia & Pacific Market Value (USD Million) by Sales Channel, 2025-2035
  • Figure 125: South Asia & Pacific Market Value (USD Million) by Country, 2025-2035
  • Figure 126: South Asia & Pacific Market Value (USD Million) Analysis by Country, 2020-2035
  • Figure 127: South Asia & Pacific Market Volume (Units) Analysis by Country, 2020-2035
  • Figure 128: South Asia & Pacific Market Value Share (%) and BPS Analysis by Country, 2025-2035
  • Figure 129: South Asia & Pacific Market Y-o-Y Growth (%) Projections by Country, 2025-2035
  • Figure 130: South Asia & Pacific Market Value (USD Million) Analysis by Test Type, 2020-2035
  • Figure 131: South Asia & Pacific Market Volume (Units) Analysis by Test Type, 2020-2035
  • Figure 132: South Asia & Pacific Market Value Share (%) and BPS Analysis by Test Type, 2025-2035
  • Figure 133: South Asia & Pacific Market Y-o-Y Growth (%) Projections by Test Type, 2025-2035
  • Figure 134: South Asia & Pacific Market Value (USD Million) Analysis by Allergen Type, 2020-2035
  • Figure 135: South Asia & Pacific Market Volume (Units) Analysis by Allergen Type, 2020-2035
  • Figure 136: South Asia & Pacific Market Value Share (%) and BPS Analysis by Allergen Type, 2025-2035
  • Figure 137: South Asia & Pacific Market Y-o-Y Growth (%) Projections by Allergen Type, 2025-2035
  • Figure 138: South Asia & Pacific Market Value (USD Million) Analysis by Age Group, 2020-2035
  • Figure 139: South Asia & Pacific Market Volume (Units) Analysis by Age Group, 2020-2035
  • Figure 140: South Asia & Pacific Market Value Share (%) and BPS Analysis by Age Group, 2025-2035
  • Figure 141: South Asia & Pacific Market Y-o-Y Growth (%) Projections by Age Group, 2025-2035
  • Figure 142: South Asia & Pacific Market Value (USD Million) Analysis by Sales Channel, 2020-2035
  • Figure 143: South Asia & Pacific Market Volume (Units) Analysis by Sales Channel, 2020-2035
  • Figure 144: South Asia & Pacific Market Value Share (%) and BPS Analysis by Sales Channel, 2025-2035
  • Figure 145: South Asia & Pacific Market Y-o-Y Growth (%) Projections by Sales Channel, 2025-2035
  • Figure 146: South Asia & Pacific Market Attractiveness by Test Type, 2025-2035
  • Figure 147: South Asia & Pacific Market Attractiveness by Allergen Type, 2025-2035
  • Figure 148: South Asia & Pacific Market Attractiveness by Age Group, 2025-2035
  • Figure 149: South Asia & Pacific Market Attractiveness by Sales Channel, 2025-2035
  • Figure 150: South Asia & Pacific Market Attractiveness by Country, 2025-2035
  • Figure 151: Western Europe Market Value (USD Million) by Test Type, 2025-2035
  • Figure 152: Western Europe Market Value (USD Million) by Allergen Type, 2025-2035
  • Figure 153: Western Europe Market Value (USD Million) by Age Group, 2025-2035
  • Figure 154: Western Europe Market Value (USD Million) by Sales Channel, 2025-2035
  • Figure 155: Western Europe Market Value (USD Million) by Country, 2025-2035
  • Figure 156: Western Europe Market Value (USD Million) Analysis by Country, 2020-2035
  • Figure 157: Western Europe Market Volume (Units) Analysis by Country, 2020-2035
  • Figure 158: Western Europe Market Value Share (%) and BPS Analysis by Country, 2025-2035
  • Figure 159: Western Europe Market Y-o-Y Growth (%) Projections by Country, 2025-2035
  • Figure 160: Western Europe Market Value (USD Million) Analysis by Test Type, 2020-2035
  • Figure 161: Western Europe Market Volume (Units) Analysis by Test Type, 2020-2035
  • Figure 162: Western Europe Market Value Share (%) and BPS Analysis by Test Type, 2025-2035
  • Figure 163: Western Europe Market Y-o-Y Growth (%) Projections by Test Type, 2025-2035
  • Figure 164: Western Europe Market Value (USD Million) Analysis by Allergen Type, 2020-2035
  • Figure 165: Western Europe Market Volume (Units) Analysis by Allergen Type, 2020-2035
  • Figure 166: Western Europe Market Value Share (%) and BPS Analysis by Allergen Type, 2025-2035
  • Figure 167: Western Europe Market Y-o-Y Growth (%) Projections by Allergen Type, 2025-2035
  • Figure 168: Western Europe Market Value (USD Million) Analysis by Age Group, 2020-2035
  • Figure 169: Western Europe Market Volume (Units) Analysis by Age Group, 2020-2035
  • Figure 170: Western Europe Market Value Share (%) and BPS Analysis by Age Group, 2025-2035
  • Figure 171: Western Europe Market Y-o-Y Growth (%) Projections by Age Group, 2025-2035
  • Figure 172: Western Europe Market Value (USD Million) Analysis by Sales Channel, 2020-2035
  • Figure 173: Western Europe Market Volume (Units) Analysis by Sales Channel, 2020-2035
  • Figure 174: Western Europe Market Value Share (%) and BPS Analysis by Sales Channel, 2025-2035
  • Figure 175: Western Europe Market Y-o-Y Growth (%) Projections by Sales Channel, 2025-2035
  • Figure 176: Western Europe Market Attractiveness by Test Type, 2025-2035
  • Figure 177: Western Europe Market Attractiveness by Allergen Type, 2025-2035
  • Figure 178: Western Europe Market Attractiveness by Age Group, 2025-2035
  • Figure 179: Western Europe Market Attractiveness by Sales Channel, 2025-2035
  • Figure 180: Western Europe Market Attractiveness by Country, 2025-2035
  • Figure 181: Eastern Europe Market Value (USD Million) by Test Type, 2025-2035
  • Figure 182: Eastern Europe Market Value (USD Million) by Allergen Type, 2025-2035
  • Figure 183: Eastern Europe Market Value (USD Million) by Age Group, 2025-2035
  • Figure 184: Eastern Europe Market Value (USD Million) by Sales Channel, 2025-2035
  • Figure 185: Eastern Europe Market Value (USD Million) by Country, 2025-2035
  • Figure 186: Eastern Europe Market Value (USD Million) Analysis by Country, 2020-2035
  • Figure 187: Eastern Europe Market Volume (Units) Analysis by Country, 2020-2035
  • Figure 188: Eastern Europe Market Value Share (%) and BPS Analysis by Country, 2025-2035
  • Figure 189: Eastern Europe Market Y-o-Y Growth (%) Projections by Country, 2025-2035
  • Figure 190: Eastern Europe Market Value (USD Million) Analysis by Test Type, 2020-2035
  • Figure 191: Eastern Europe Market Volume (Units) Analysis by Test Type, 2020-2035
  • Figure 192: Eastern Europe Market Value Share (%) and BPS Analysis by Test Type, 2025-2035
  • Figure 193: Eastern Europe Market Y-o-Y Growth (%) Projections by Test Type, 2025-2035
  • Figure 194: Eastern Europe Market Value (USD Million) Analysis by Allergen Type, 2020-2035
  • Figure 195: Eastern Europe Market Volume (Units) Analysis by Allergen Type, 2020-2035
  • Figure 196: Eastern Europe Market Value Share (%) and BPS Analysis by Allergen Type, 2025-2035
  • Figure 197: Eastern Europe Market Y-o-Y Growth (%) Projections by Allergen Type, 2025-2035
  • Figure 198: Eastern Europe Oral Food Challenge Testing Market Value (USD Million) Analysis by Age Group, 2020-2035
  • Figure 199: Eastern Europe Market Volume (Units) Analysis by Age Group, 2020-2035
  • Figure 200: Eastern Europe Market Value Share (%) and BPS Analysis by Age Group, 2025-2035
  • Figure 201: Eastern Europe Market Y-o-Y Growth (%) Projections by Age Group, 2025-2035
  • Figure 202: Eastern Europe Market Value (USD Million) Analysis by Sales Channel, 2020-2035
  • Figure 203: Eastern Europe Market Volume (Units) Analysis by Sales Channel, 2020-2035
  • Figure 204: Eastern Europe Market Value Share (%) and BPS Analysis by Sales Channel, 2025-2035
  • Figure 205: Eastern Europe Market Y-o-Y Growth (%) Projections by Sales Channel, 2025-2035
  • Figure 206: Eastern Europe Market Attractiveness by Test Type, 2025-2035
  • Figure 207: Eastern Europe Market Attractiveness by Allergen Type, 2025-2035
  • Figure 208: Eastern Europe Market Attractiveness by Age Group, 2025-2035
  • Figure 209: Eastern Europe Market Attractiveness by Sales Channel, 2025-2035
  • Figure 210: Eastern Europe Market Attractiveness by Country, 2025-2035
  • Figure 211: Middle East & Africa Market Value (USD Million) by Test Type, 2025-2035
  • Figure 212: Middle East & Africa Market Value (USD Million) by Allergen Type, 2025-2035
  • Figure 213: Middle East & Africa Market Value (USD Million) by Age Group, 2025-2035
  • Figure 214: Middle East & Africa Market Value (USD Million) by Sales Channel, 2025-2035
  • Figure 215: Middle East & Africa Market Value (USD Million) by Country, 2025-2035
  • Figure 216: Middle East & Africa Market Value (USD Million) Analysis by Country, 2020-2035
  • Figure 217: Middle East & Africa Market Volume (Units) Analysis by Country, 2020-2035
  • Figure 218: Middle East & Africa Market Value Share (%) and BPS Analysis by Country, 2025-2035
  • Figure 219: Middle East & Africa Market Y-o-Y Growth (%) Projections by Country, 2025-2035
  • Figure 220: Middle East & Africa Market Value (USD Million) Analysis by Test Type, 2020-2035
  • Figure 221: Middle East & Africa Market Volume (Units) Analysis by Test Type, 2020-2035
  • Figure 222: Middle East & Africa Market Value Share (%) and BPS Analysis by Test Type, 2025-2035
  • Figure 223: Middle East & Africa Market Y-o-Y Growth (%) Projections by Test Type, 2025-2035
  • Figure 224: Middle East & Africa Market Value (USD Million) Analysis by Allergen Type, 2020-2035
  • Figure 225: Middle East & Africa Market Volume (Units) Analysis by Allergen Type, 2020-2035
  • Figure 226: Middle East & Africa Market Value Share (%) and BPS Analysis by Allergen Type, 2025-2035
  • Figure 227: Middle East & Africa Market Y-o-Y Growth (%) Projections by Allergen Type, 2025-2035
  • Figure 228: Middle East & Africa Market Value (USD Million) Analysis by Age Group, 2020-2035
  • Figure 229: Middle East & Africa Market Volume (Units) Analysis by Age Group, 2020-2035
  • Figure 230: Middle East & Africa Market Value Share (%) and BPS Analysis by Age Group, 2025-2035
  • Figure 231: Middle East & Africa Market Y-o-Y Growth (%) Projections by Age Group, 2025-2035
  • Figure 232: Middle East & Africa Market Value (USD Million) Analysis by Sales Channel, 2020-2035
  • Figure 233: Middle East & Africa Market Volume (Units) Analysis by Sales Channel, 2020-2035
  • Figure 234: Middle East & Africa Market Value Share (%) and BPS Analysis by Sales Channel, 2025-2035
  • Figure 235: Middle East & Africa Market Y-o-Y Growth (%) Projections by Sales Channel, 2025-2035
  • Figure 236: Middle East & Africa Market Attractiveness by Test Type, 2025-2035
  • Figure 237: Middle East & Africa Market Attractiveness by Allergen Type, 2025-2035
  • Figure 238: Middle East & Africa Market Attractiveness by Age Group, 2025-2035
  • Figure 239: Middle East & Africa Market Attractiveness by Sales Channel, 2025-2035
  • Figure 240: Middle East & Africa Market Attractiveness by Country, 2025-2035

Frequently Asked Questions

How big is the Oral Food Challenge Testing market in 2025?

The global Oral Food Challenge Testing market is estimated to be valued at USD 283.5 million in 2025.

What will be the size of the Oral Food Challenge Testing market in 2035?

The market size for Oral Food Challenge Testing is projected to reach USD 594.8 million by 2035.

How much will the Oral Food Challenge Testing market grow between 2025 and 2035?

The Oral Food Challenge Testing market is expected to grow at a CAGR of 7.7% during this period.

What are the key test types in the Oral Food Challenge Testing market?

Key test types include Open Food Challenge, Single-Blind Food Challenge, and Double-Blind Placebo-Controlled Food Challenge (DBPCFC).

Which allergen segment will contribute a significant share in the Oral Food Challenge Testing market in 2025?

Peanut allergy testing is projected to command 27.4% of the market in 2025, making it the largest allergen segment, followed by milk and shellfish.

Explore Similar Insights

Future Market Insights

Oral Food Challenge Testing Market