Oral Clinical Nutrition Desserts Market Forecast and Outlook 2025 to 2035

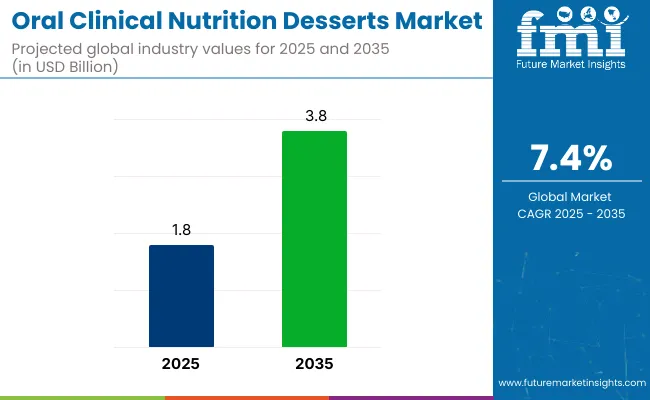
The global oral clinical nutrition desserts market is valued at USD 1.8 billion in 2025 and is expected to reach USD 3.8 billion by 2035, reflecting a CAGR of 7.4%. Growth is expected to be driven by the rising demand for specialized nutrition among elderly populations, patients recovering from surgery, and individuals suffering from chronic diseases. Moreover, increasing adoption of nutrient-dense formulations such as puddings, custards, and mousses is likely to sustain market expansion over the forecast period.
Quick Stats for Oral Clinical Nutrition Desserts Market

  • Market Value (2025): USD 1.8 billion
  • Forecast Value (2035): USD 3.8 billion
  • Forecast CAGR: 7.4%
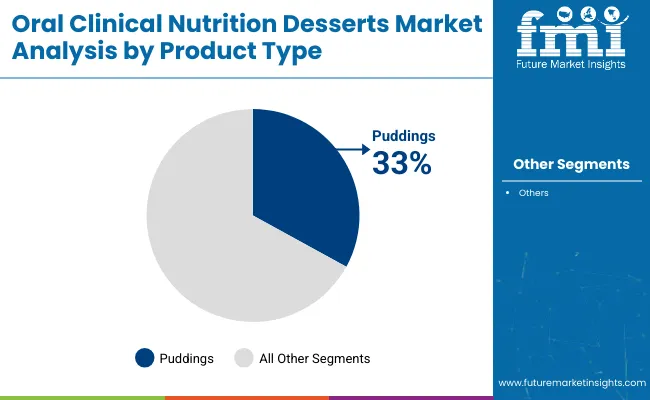
  • Product Leader in 2025: Puddings (33% market share)
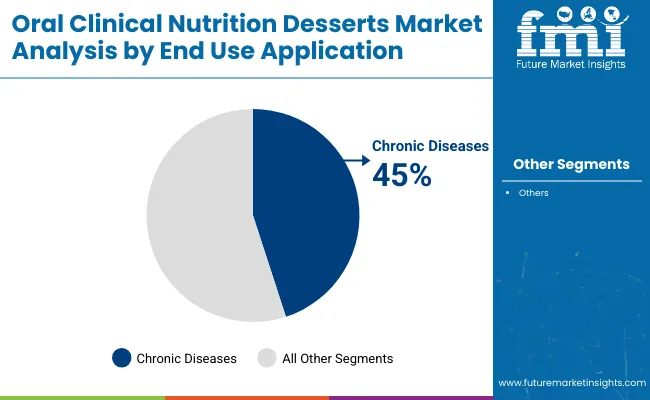
  • Top End Use Application: Chronic Diseases (45% market share)
  • Key Growth Country: Japan (fastest-growing market with 7.8% CAGR)

Oral Clinical Nutrition Desserts Market

Metric Value
Estimated Size (2025E) USD 1.8 billion
Projected Value (2035F) USD 3.8 billion
CAGR (2025 to 2035) 7.4%

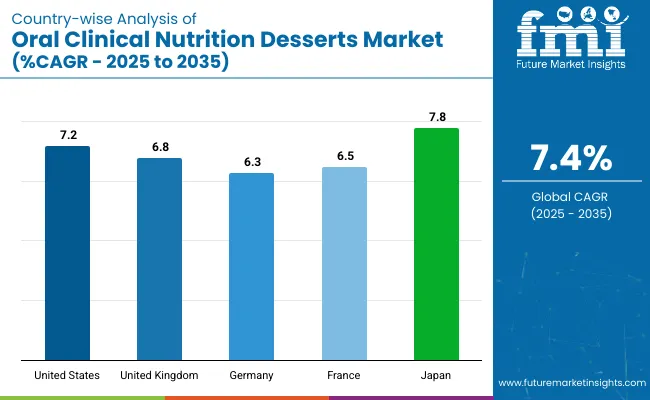
The market is anticipated to witness strong growth led by the USA, expanding at a CAGR of 7.2% and projected to maintain its dominant position with a prominent market share by 2035. Meanwhile, Japan is expected to grow at the highest CAGR of 7.8% during the forecast period, followed by the UK growing at a CAGR of 6.8%. Puddings are likely to remain the leading product type segment with a 33% share by 2035. Meanwhile, the chronic diseases segment accounts for the largest share of 45% in the end-use application.

The market accounts for approximately 6-8% of the broader clinical nutrition market, given its niche focus within oral nutrition supplements. Within the oral nutrition supplements market, it represents an estimated 12-15% share, driven by rising demand for dessert-based nutrient-dense products for elderly and chronic disease patients.

It forms a smaller portion, around 3-5% of the overall medical nutrition and FSMP markets, as these categories include enteral, parenteral, and other specialized feeds. Despite its smaller share, the segment is witnessing rapid growth due to innovation in textures, flavors, and personalized formulations, enhancing patient compliance.

Oral Clinical Nutrition Desserts Market Analysis by Top Investment Segment

The market is segmented by product type, end-use application, distribution channel, and region. By product type, it includes pudding, custard, gelatin, and mousse. By end-use application, it is segmented into malnutrition, chronic diseases, post-surgery recovery, and geriatric nutrition.

By distribution channel, it is segmented into prescription-based and over-the-counter (hospital pharmacies, retail pharmacies, specialty stores, online retail). By region, it covers North America, Latin America, Western Europe, Eastern Europe, East Asia, South Asia, the Pacific, the Middle East and Africa.

By Product Type, Puddings Account for 33% of the Market Share

Puddings are anticipated to remain the leading product type, driven by their smooth texture and ease of swallowing, making them suitable for patients with dysphagia and elderly consumers. This segment is projected to hold a 33% market share by 2035.
  • Smooth texture enhances patient compliance
  • Easily fortified with high protein and vitamins
  • Suitable for elderly and dysphagia patients

Oral Clinical Nutrition Desserts Market Analysis By Product Type

By End Use Application, the Chronic Diseases Segment Accounts for 45% of the Market Share

The chronic diseases segment is expected to dominate, accounting for a 45% market share by 2035, as patients with conditions like cancer, diabetes, and cardiovascular diseases require specialized nutrient-rich diets to manage symptoms and improve outcomes.
  • Caters to diabetes, cancer, and cardiac patients
  • Offers high-protein, low-sugar formulations
  • Prescribed as part of comprehensive treatment plans

Oral Clinical Nutrition Desserts Market Analysis By End Use

By Distribution Channel, Prescription-Based Sales Account for 55% of the Market Share

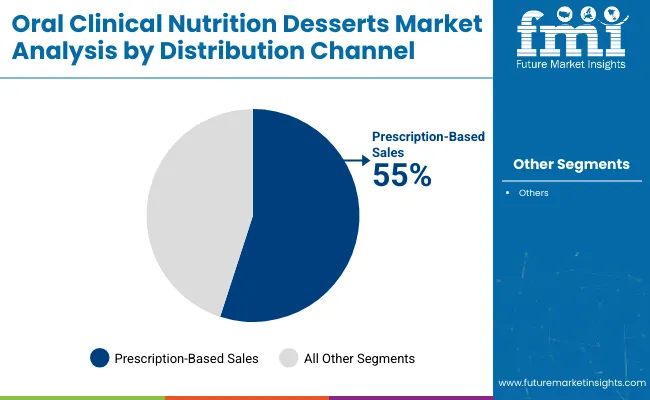
Prescription-based channels are projected to remain dominant due to the medical necessity of these products, especially for patients recovering from surgeries, managing chronic diseases, or malnutrition. This segment is expected to contribute over 55% of market revenue by 2035. Driven by doctor and dietitian prescriptions
  • Ensures compliance and targeted nutrition intake
  • Hospital pharmacies remain key distribution points

Oral Clinical Nutrition Desserts Market Analysis By Distribution Channel
Top Oral Clinical Nutrition Desserts Market Dynamics

Recent Trends in the Oral Clinical Nutrition Desserts Market

  • Increasing development of personalized nutrition desserts tailored to specific medical conditions and individual dietary needs
  • Rising popularity of high-protein, low-sugar formulations among chronic disease and post-surgery patients

Challenges in the Oral Clinical Nutrition Desserts Market

  • High production costs due to stringent quality standards and fortification requirements
  • Regulatory hurdles and approvals for new formulations in different countries are delaying launches

Analyzing Top Countries Manufacturing and Supplying Oral Clinical Nutrition Desserts

Oral Clinical Nutrition Desserts Market Country Wise Analysis

Among the top five countries in the oral clinical nutrition desserts market, Japan is projected to witness the fastest growth with a CAGR of 7.8% from 2025 to 2035, driven by its rapidly ageing population and high health consciousness. The USA follows closely with a CAGR of 7.2%, supported by its advanced healthcare infrastructure and high chronic disease prevalence.

France and the UK are forecasted to grow at 6.5% and 6.8%, respectively, owing to robust public healthcare systems and rising elderly care demand. Germany records the slowest growth at 6.3% CAGR, despite strong health consciousness and regulatory standards.

The report covers an in-depth analysis of 40+ countries; five top-performing OECD countries are highlighted below.

United States Oral Clinical Nutrition Desserts Market Analysis

The oral clinical nutrition desserts revenue in the USA is expected to grow at a CAGR of 7.2% from 2025 to 2035. Growth is expected to be driven by its advanced healthcare infrastructure, high healthcare spending, and a substantial ageing population requiring easy-to-consume, nutrient-dense products.

  • High prevalence of chronic diseases requiring specialized nutritional support.
  • Strong presence of multinational companies with diverse product portfolios.
  • Advanced healthcare infrastructure supporting widespread product availability.

Oral Clinical Nutrition Desserts Demand Analysis in the UK

The market for oral clinical nutrition desserts in the UK is projected to expand at a CAGR of 6.8% from 2025 to 2035. Growth is anticipated due to increasing awareness of clinical nutrition's role in patient recovery, along with a robust public healthcare system promoting nutritional support for chronic disease management and elderly care.

  • Increasing adoption in elderly care facilities and hospitals.
  • Growing market for online and retail pharmacy sales.
  • Emphasis on high-protein, low-sugar formulations for chronic patients.

Germany Oral Clinical Nutrition Desserts Market Analysis

The revenue from oral clinical nutrition desserts in Germany is forecasted to rise at a CAGR of 6.3% from 2025 to 2035. This growth is driven by a high burden of chronic diseases and an ageing population requiring specialized dietary interventions. Hospitals and geriatric care institutions remain key consumers of these products, especially puddings fortified with essential proteins and vitamins.

  • Strong emphasis on dietary management in chronic disease treatment plans.
  • High health consciousness among the ageing population.
  • Robust regulatory standards ensure the quality and safety of products.

France Oral Clinical Nutrition Desserts Sales Analysis

The sales of oral clinical nutrition desserts in France are projected to register a CAGR of 6.5% from 2025 to 2035. Growth is expected to be fueled by the increasing number of elderly individuals and patients undergoing post-surgery recovery, who require easy-to-consume, energy-dense desserts.

  • Increasing number of elderly patients requiring nutrient-rich desserts.
  • Growing focus on product taste and texture innovations.
  • Hospitals and rehabilitation centres are major distribution channels.

Oral Clinical Nutrition Desserts Demand Analysis in Japan

The oral clinical nutrition desserts market in Japan is anticipated to flourish at a CAGR of 7.8% from 2025 to 2035. Growth is driven by its rapidly ageing population, resulting in high demand for nutrient-dense, easy-to-swallow desserts such as puddings and custards. High health consciousness and a strong cultural emphasis on dietary management further fuel market expansion.

  • Rising demand driven by a rapidly ageing population.
  • Strong cultural emphasis on proper dietary management.
  • Growth in protein-enriched dessert formulations with improved textures.

Leading Oral Clinical Nutrition Dessert Suppliers

The market is moderately consolidated, with a few multinational corporations accounting for a substantial share alongside regional players. Companies such as Nestlé Health Science, Abbott Laboratories, Danone Nutricia, Fresenius Kabi, and Baxter International dominate due to their extensive product portfolios, strong R&D capabilities, and global distribution networks.

Competition is based on innovation in high-protein and low-sugar formulations, as well as taste and texture enhancements, and expanding market reach through strategic partnerships with hospitals and care facilities.

Top companies are increasingly focusing on product innovation by introducing personalised nutrition solutions, allergen-free and fortified formulations, and improved packaging for ease of consumption. Strategic acquisitions, expansion into emerging markets, and partnerships with healthcare providers continue to be key competitive strategies.

For instance, Nestlé Health Science has strengthened its nutritional portfolio through targeted acquisitions. At the same time, Danone Nutricia and Abbott Laboratories continue to invest in clinical trials to validate product efficacy and compliance. Fresenius Kabi and Baxter International focus on expanding their hospital-based distribution networks to reach critical care segments effectively.

Recent Oral Clinical Nutrition Desserts Market News

  • In May 2024, Bayer announced the acquisition of remaining 25% stake in Bayer Zydus Pharma Pvt Ltd to secure full ownership.

Oral Clinical Nutrition Desserts Report Scope

Report Attributes Details
Current Total Market Size (2025) USD 1.8 billion
Projected Market Size (2035) USD 3.8 billion
CAGR (2025 to 2035) 7.4%
Base Year for Estimation 2024
Historical Period 2020 to 2024
Projections Period 2025 to 2035
Market Analysis Parameters Revenue in USD billion/Volume in Units
By Product Type Pudding, Custard, Gelatin, Mousse
By End Use Application Malnutrition, Chronic Diseases, Post-surgery Recovery, Geriatric Nutrition
By Distribution Channel Prescription-based, Over-the-counter (Hospital Pharmacies, Retail Pharmacies, Specialty Stores, Online Retail)
Regions Covered North America, Latin America, Western Europe, Eastern Europe, East Asia, South Asia, Pacific, Middle East and Africa
Countries Covered United States, Canada, United Kingdom, Germany, France, China, Japan, South Korea, Brazil, Australia
Key Players Nestlé Health Science, Abbott Laboratories, Danone Nutricia, Fresenius Kabi, Baxter International Inc., Pfizer Inc., Bayer AG, GlaxoSmithKline plc, Perrigo Nutritionals, Medifood International, Church & Dwight Co., Inc., Raisin Champion International, Geobres Nemean Currants and Sultana Raisins S.A., Mead Johnson Nutrition, B. Braun Melsungen AG.
Additional Attributes Dollar sales by value, market share analysis by region, and country-wise analysis

Top Investment Segments Studied in the Oral Clinical Nutrition Desserts Market

By Product Type:

As per Product Type, the industry has been categorized into Pudding, Custard, Gelatin, and Mousse.

By End Use Application:

As per End Use, the industry has been categorized into Malnutrition, Chronic Diseases, Post-surgery recovery, and Geriatric Nutrition.

By Distribution Channel:

As per Distribution Channel, the industry has been categorized into Prescription-based and Over-the-counter (Hospital Pharmacies, Retail Pharmacies, Specialty Stores, Online Retail).

By Region:

Industry analysis has been carried out in key countries of North America, Latin America, Europe, East Asia, South Asia, Oceania, and Middle East & Africa.

Table of Content

  1. Executive Summary
    • Global Market Outlook
    • Demand-side Trends
    • Supply-side Trends
    • Technology Roadmap Analysis
    • Analysis and Recommendations
  2. Market Overview
    • Market Coverage / Taxonomy
    • Market Definition / Scope / Limitations
  3. Market Background
    • Market Dynamics
      • Drivers
      • Restraints
      • Opportunity
      • Trends
    • Scenario Forecast
      • Demand in Optimistic Scenario
      • Demand in Likely Scenario
      • Demand in Conservative Scenario
    • Opportunity Map Analysis
    • Product Life Cycle Analysis
    • Supply Chain Analysis
      • Supply Side Participants and their Roles
        • Producers
        • Mid-Level Participants (Traders/ Agents/ Brokers)
        • Wholesalers and Distributors
      • Value Added and Value Created at Node in the Supply Chain
      • List of Raw Material Suppliers
      • List of Existing and Potential Buyer’s
    • Investment Feasibility Matrix
    • Value Chain Analysis
      • Profit Margin Analysis
      • Wholesalers and Distributors
      • Retailers
    • PESTLE and Porter’s Analysis
    • Regulatory Landscape
      • By Key Regions
      • By Key Countries
    • Regional Parent Market Outlook
    • Production and Consumption Statistics
    • Import and Export Statistics
  4. Global Market Analysis 2020 to 2024 and Forecast, 2025 to 2035
    • Historical Market Size Value (USD Billion) & Volume (units) Analysis, 2020 to 2024
    • Current and Future Market Size Value (USD Billion) & Volume (units) Projections, 2025 to 2035
      • Y-o-Y Growth Trend Analysis
      • Absolute $ Opportunity Analysis
  5. Global Market Pricing Analysis 2020 to 2024 and Forecast 2025 to 2035
  6. Global Market Analysis 2020 to 2024 and Forecast 2025 to 2035, By Product Type
    • Introduction / Key Findings
    • Historical Market Size Value (USD Billion) & Volume (units) Analysis By Product Type, 2020 to 2024
    • Current and Future Market Size Value (USD Billion) & Volume (units) Analysis and Forecast By Product Type, 2025 to 2035
      • Pudding
      • Custard
      • Gelatin
      • Mousse
    • Y-o-Y Growth Trend Analysis By Product Type, 2020 to 2024
    • Absolute $ Opportunity Analysis By Product Type, 2025 to 2035
  7. Global Market Analysis 2020 to 2024 and Forecast 2025 to 2035, By End Use Application
    • Introduction / Key Findings
    • Historical Market Size Value (USD Billion) & Volume (units) Analysis By End Use Application, 2020 to 2024
    • Current and Future Market Size Value (USD Billion) & Volume (units) Analysis and Forecast By End Use Application, 2025 to 2035
      • Malnutrition
      • Chronic Diseases
      • Post-surgery Recovery
      • Geriatric Nutrition
    • Y-o-Y Growth Trend Analysis By End Use Application, 2020 to 2024
    • Absolute $ Opportunity Analysis By End Use Application, 2025 to 2035
  8. Global Market Analysis 2020 to 2024 and Forecast 2025 to 2035, By Distribution Channel
    • Introduction / Key Findings
    • Historical Market Size Value (USD Billion) & Volume (units) Analysis By Distribution Channel, 2020 to 2024
    • Current and Future Market Size Value (USD Billion) & Volume (units) Analysis and Forecast By Distribution Channel, 2025 to 2035
      • Prescription-based
      • Over-the-counter
        • Hospital Pharmacies
        • Retail Pharmacies
        • Specialty Stores
        • Online Retail
    • Y-o-Y Growth Trend Analysis By Distribution Channel, 2020 to 2024
    • Absolute $ Opportunity Analysis By Distribution Channel, 2025 to 2035
  9. Global Market Analysis 2020 to 2024 and Forecast 2025 to 2035, By Region
    • Introduction
    • Historical Market Size Value (USD Billion) & Volume (units) Analysis By Region, 2020 to 2024
    • Current Market Size Value (USD Billion) & Volume (units) Analysis and Forecast By Region, 2025 to 2035
      • North America
      • Latin America
      • Western Europe
      • Eastern Europe
      • East Asia
      • South Asia & Pacific
      • Middle East and Africa
    • Market Attractiveness Analysis By Region
  10. North America Market Analysis 2020 to 2024 and Forecast 2025 to 2035, By Country
    • Historical Market Size Value (USD Billion) & Volume (units) Trend Analysis By Market Taxonomy, 2020 to 2024
    • Market Size Value (USD Billion) & Volume (units) Forecast By Market Taxonomy, 2025 to 2035
      • By Country
        • USA
        • Canada
        • Mexico
      • By Product Type
      • By End Use Application
      • By Distribution Channel
    • Market Attractiveness Analysis
      • By Country
      • By Product Type
      • By End Use Application
      • By Distribution Channel
    • Key Takeaways
  11. Latin America Market Analysis 2020 to 2024 and Forecast 2025 to 2035, By Country
    • Historical Market Size Value (USD Billion) & Volume (units) Trend Analysis By Market Taxonomy, 2020 to 2024
    • Market Size Value (USD Billion) & Volume (units) Forecast By Market Taxonomy, 2025 to 2035
      • By Country
        • Brazil
        • Argentina
        • Rest of LATAM
      • By Product Type
      • By End Use Application
      • By Distribution Channel
    • Market Attractiveness Analysis
      • By Country
      • By Product Type
      • By End Use Application
      • By Distribution Channel
    • Key Takeaways
  12. Western Europe Market Analysis 2020 to 2024 and Forecast 2025 to 2035, By Country
    • Historical Market Size Value (USD Billion) & Volume (units) Trend Analysis By Market Taxonomy, 2020 to 2024
    • Market Size Value (USD Billion) & Volume (units) Forecast By Market Taxonomy, 2025 to 2035
      • By Country
        • Germany
        • Italy
        • France
        • UK
        • Spain
        • BENELUX
        • Nordic
        • Rest of W.Europe
      • By Product Type
      • By End Use Application
      • By Distribution Channel
    • Market Attractiveness Analysis
      • By Country
      • By Product Type
      • By End Use Application
      • By Distribution Channel
    • Key Takeaways
  13. Eastern Europe Market Analysis 2020 to 2024 and Forecast 2025 to 2035, By Country
    • Historical Market Size Value (USD Billion) & Volume (units) Trend Analysis By Market Taxonomy, 2020 to 2024
    • Market Size Value (USD Billion) & Volume (units) Forecast By Market Taxonomy, 2025 to 2035
      • By Country
        • Russia
        • Hungary
        • Poland
        • Balkan & Baltics
        • Rest of E. Europe
      • By Product Type
      • By End Use Application
      • By Distribution Channel
    • Market Attractiveness Analysis
      • By Country
      • By Product Type
      • By End Use Application
      • By Distribution Channel
    • Key Takeaways
  14. East Asia Market Analysis 2020 to 2024 and Forecast 2025 to 2035, By Country
    • Historical Market Size Value (USD Billion) & Volume (units) Trend Analysis By Market Taxonomy, 2020 to 2024
    • Market Size Value (USD Billion) & Volume (units) Forecast By Market Taxonomy, 2025 to 2035
      • By Country
        • China
        • Japan
        • South Korea
      • By Product Type
      • By End Use Application
      • By Distribution Channel
    • Market Attractiveness Analysis
      • By Country
      • By Product Type
      • By End Use Application
      • By Distribution Channel
    • Key Takeaways
  15. South Asia & Pacific Market Analysis 2020 to 2024 and Forecast 2025 to 2035, By Country
    • Historical Market Size Value (USD Billion) & Volume (units) Trend Analysis By Market Taxonomy, 2020 to 2024
    • Market Size Value (USD Billion) & Volume (units) Forecast By Market Taxonomy, 2025 to 2035
      • By Country
        • India
        • Australia & New Zealand
        • ASEAN
        • Rest of SAP
      • By Product Type
      • By End Use Application
      • By Distribution Channel
    • Market Attractiveness Analysis
      • By Country
      • By Product Type
      • By End Use Application
      • By Distribution Channel
    • Key Takeaways
  16. Middle East and Africa Market Analysis 2020 to 2024 and Forecast 2025 to 2035, By Country
    • Historical Market Size Value (USD Billion) & Volume (units) Trend Analysis By Market Taxonomy, 2020 to 2024
    • Market Size Value (USD Billion) & Volume (units) Forecast By Market Taxonomy, 2025 to 2035
      • By Country
        • GCC Countries
        • Northern Africa
        • South Africa
        • Turkiye
        • Rest of MEA
      • By Product Type
      • By End Use Application
      • By Distribution Channel
    • Market Attractiveness Analysis
      • By Country
      • By Product Type
      • By End Use Application
      • By Distribution Channel
    • Key Takeaways
  17. Key Countries Market Analysis
    • USA
      • Pricing Analysis
      • Market Share Analysis, 2024
        • By Product Type
        • By End Use Application
        • By Distribution Channel
    • Canada
      • Pricing Analysis
      • Market Share Analysis, 2024
        • By Product Type
        • By End Use Application
        • By Distribution Channel
    • Brazil
      • Pricing Analysis
      • Market Share Analysis, 2024
        • By Product Type
        • By End Use Application
        • By Distribution Channel
    • Mexico
      • Pricing Analysis
      • Market Share Analysis, 2024
        • By Product Type
        • By End Use Application
        • By Distribution Channel
    • Argentina
      • Pricing Analysis
      • Market Share Analysis, 2024
        • By Product Type
        • By End Use Application
        • By Distribution Channel
  18. Market Structure Analysis
    • Competition Dashboard
    • Competition Benchmarking
    • Market Share Analysis of Top Players
      • By Regional
      • By Product Type
      • By End Use Application
      • By Distribution Channel
  19. Competition Analysis
    • Competition Deep Dive
      • Nestlé Health Science
        • Overview
        • Product Portfolio
        • Profitability by Market Segments (Product/Age /Sales Channel/Region)
        • Sales Footprint
        • Strategy Overview
          • Marketing Strategy
          • Product Strategy
          • Channel Strategy
      • Abbott Laboratories
        • Overview
        • Product Portfolio
        • Profitability by Market Segments (Product/Age /Sales Channel/Region)
        • Sales Footprint
        • Strategy Overview
          • Marketing Strategy
          • Product Strategy
          • Channel Strategy
      • Danone Nutricia
        • Overview
        • Product Portfolio
        • Profitability by Market Segments (Product/Age /Sales Channel/Region)
        • Sales Footprint
        • Strategy Overview
          • Marketing Strategy
          • Product Strategy
          • Channel Strategy
      • Fresenius Kabi
        • Overview
        • Product Portfolio
        • Profitability by Market Segments (Product/Age /Sales Channel/Region)
        • Sales Footprint
        • Strategy Overview
          • Marketing Strategy
          • Product Strategy
          • Channel Strategy
      • Baxter International Inc.
        • Overview
        • Product Portfolio
        • Profitability by Market Segments (Product/Age /Sales Channel/Region)
        • Sales Footprint
        • Strategy Overview
          • Marketing Strategy
          • Product Strategy
          • Channel Strategy
      • Pfizer Inc.
        • Overview
        • Product Portfolio
        • Profitability by Market Segments (Product/Age /Sales Channel/Region)
        • Sales Footprint
        • Strategy Overview
          • Marketing Strategy
          • Product Strategy
          • Channel Strategy
      • Bayer AG
        • Overview
        • Product Portfolio
        • Profitability by Market Segments (Product/Age /Sales Channel/Region)
        • Sales Footprint
        • Strategy Overview
          • Marketing Strategy
          • Product Strategy
          • Channel Strategy
      • GlaxoSmithKline plc
        • Overview
        • Product Portfolio
        • Profitability by Market Segments (Product/Age /Sales Channel/Region)
        • Sales Footprint
        • Strategy Overview
          • Marketing Strategy
          • Product Strategy
          • Channel Strategy
      • Perrigo Nutritionals
        • Overview
        • Product Portfolio
        • Profitability by Market Segments (Product/Age /Sales Channel/Region)
        • Sales Footprint
        • Strategy Overview
          • Marketing Strategy
          • Product Strategy
          • Channel Strategy
      • Medifood International
        • Overview
        • Product Portfolio
        • Profitability by Market Segments (Product/Age /Sales Channel/Region)
        • Sales Footprint
        • Strategy Overview
          • Marketing Strategy
          • Product Strategy
          • Channel Strategy
      • Church & Dwight Co., Inc.
        • Overview
        • Product Portfolio
        • Profitability by Market Segments (Product/Age /Sales Channel/Region)
        • Sales Footprint
        • Strategy Overview
          • Marketing Strategy
          • Product Strategy
          • Channel Strategy
      • Raisin Champion International
        • Overview
        • Product Portfolio
        • Profitability by Market Segments (Product/Age /Sales Channel/Region)
        • Sales Footprint
        • Strategy Overview
          • Marketing Strategy
          • Product Strategy
          • Channel Strategy
      • Geobres Nemean Currants and Sultana Raisins S.A.
        • Overview
        • Product Portfolio
        • Profitability by Market Segments (Product/Age /Sales Channel/Region)
        • Sales Footprint
        • Strategy Overview
          • Marketing Strategy
          • Product Strategy
          • Channel Strategy
      • Mead Johnson Nutrition
        • Overview
        • Product Portfolio
        • Profitability by Market Segments (Product/Age /Sales Channel/Region)
        • Sales Footprint
        • Strategy Overview
          • Marketing Strategy
          • Product Strategy
          • Channel Strategy
      • B. Braun Melsungen AG
        • Overview
        • Product Portfolio
        • Profitability by Market Segments (Product/Age /Sales Channel/Region)
        • Sales Footprint
        • Strategy Overview
          • Marketing Strategy
          • Product Strategy
          • Channel Strategy
      • Others
        • Overview
        • Product Portfolio
        • Profitability by Market Segments (Product/Age /Sales Channel/Region)
        • Sales Footprint
        • Strategy Overview
          • Marketing Strategy
          • Product Strategy
          • Channel Strategy
  20. Assumptions & Acronyms Used
  21. Research Methodology

List of Tables

  • Table 1: Global Market Value (USD Billion) Forecast by Region, 2020-2035
  • Table 2: Global Market Volume (units) Forecast by Region, 2020-2035
  • Table 3: Global Market Value (USD Billion) Forecast by Product Type, 2020-2035
  • Table 4: Global Market Volume (units) Forecast by Product Type, 2020-2035
  • Table 5: Global Market Value (USD Billion) Forecast by End Use Application, 2020-2035
  • Table 6: Global Market Volume (units) Forecast by End Use Application, 2020-2035
  • Table 7: Global Market Value (USD Billion) Forecast by Distribution Channel, 2020-2035
  • Table 8: Global Market Volume (units) Forecast by Distribution Channel, 2020-2035
  • Table 9: North America Market Value (USD Billion) Forecast by Country, 2020-2035
  • Table 10: North America Market Volume (units) Forecast by Country, 2020-2035
  • Table 11: North America Market Value (USD Billion) Forecast by Product Type, 2020-2035
  • Table 12: North America Market Volume (units) Forecast by Product Type, 2020-2035
  • Table 13: North America Market Value (USD Billion) Forecast by End Use Application, 2020-2035
  • Table 14: North America Market Volume (units) Forecast by End Use Application, 2020-2035
  • Table 15: North America Market Value (USD Billion) Forecast by Distribution Channel, 2020-2035
  • Table 16: North America Market Volume (units) Forecast by Distribution Channel, 2020-2035
  • Table 17: Latin America Market Value (USD Billion) Forecast by Country, 2020-2035
  • Table 18: Latin America Market Volume (units) Forecast by Country, 2020-2035
  • Table 19: Latin America Market Value (USD Billion) Forecast by Product Type, 2020-2035
  • Table 20: Latin America Market Volume (units) Forecast by Product Type, 2020-2035
  • Table 21: Latin America Market Value (USD Billion) Forecast by End Use Application, 2020-2035
  • Table 22: Latin America Market Volume (units) Forecast by End Use Application, 2020-2035
  • Table 23: Latin America Market Value (USD Billion) Forecast by Distribution Channel, 2020-2035
  • Table 24: Latin America Market Volume (units) Forecast by Distribution Channel, 2020-2035
  • Table 25: Western Europe Market Value (USD Billion) Forecast by Country, 2020-2035
  • Table 26: Western Europe Market Volume (units) Forecast by Country, 2020-2035
  • Table 27: Western Europe Market Value (USD Billion) Forecast by Product Type, 2020-2035
  • Table 28: Western Europe Market Volume (units) Forecast by Product Type, 2020-2035
  • Table 29: Western Europe Market Value (USD Billion) Forecast by End Use Application, 2020-2035
  • Table 30: Western Europe Market Volume (units) Forecast by End Use Application, 2020-2035
  • Table 31: Western Europe Market Value (USD Billion) Forecast by Distribution Channel, 2020-2035
  • Table 32: Western Europe Market Volume (units) Forecast by Distribution Channel, 2020-2035
  • Table 33: Eastern Europe Market Value (USD Billion) Forecast by Country, 2020-2035
  • Table 34: Eastern Europe Market Volume (units) Forecast by Country, 2020-2035
  • Table 35: Eastern Europe Market Value (USD Billion) Forecast by Product Type, 2020-2035
  • Table 36: Eastern Europe Market Volume (units) Forecast by Product Type, 2020-2035
  • Table 37: Eastern Europe Market Value (USD Billion) Forecast by End Use Application, 2020-2035
  • Table 38: Eastern Europe Market Volume (units) Forecast by End Use Application, 2020-2035
  • Table 39: Eastern Europe Market Value (USD Billion) Forecast by Distribution Channel, 2020-2035
  • Table 40: Eastern Europe Market Volume (units) Forecast by Distribution Channel, 2020-2035
  • Table 41: East Asia Market Value (USD Billion) Forecast by Country, 2020-2035
  • Table 42: East Asia Market Volume (units) Forecast by Country, 2020-2035
  • Table 43: East Asia Market Value (USD Billion) Forecast by Product Type, 2020-2035
  • Table 44: East Asia Market Volume (units) Forecast by Product Type, 2020-2035
  • Table 45: East Asia Market Value (USD Billion) Forecast by End Use Application, 2020-2035
  • Table 46: East Asia Market Volume (units) Forecast by End Use Application, 2020-2035
  • Table 47: East Asia Market Value (USD Billion) Forecast by Distribution Channel, 2020-2035
  • Table 48: East Asia Market Volume (units) Forecast by Distribution Channel, 2020-2035
  • Table 49: South Asia & Pacific Market Value (USD Billion) Forecast by Country, 2020-2035
  • Table 50: South Asia & Pacific Market Volume (units) Forecast by Country, 2020-2035
  • Table 51: South Asia & Pacific Market Value (USD Billion) Forecast by Product Type, 2020-2035
  • Table 52: South Asia & Pacific Market Volume (units) Forecast by Product Type, 2020-2035
  • Table 53: South Asia & Pacific Market Value (USD Billion) Forecast by End Use Application, 2020-2035
  • Table 54: South Asia & Pacific Market Volume (units) Forecast by End Use Application, 2020-2035
  • Table 55: South Asia & Pacific Market Value (USD Billion) Forecast by Distribution Channel, 2020-2035
  • Table 56: South Asia & Pacific Market Volume (units) Forecast by Distribution Channel, 2020-2035
  • Table 57: Middle East and Africa Market Value (USD Billion) Forecast by Country, 2020-2035
  • Table 58: Middle East and Africa Market Volume (units) Forecast by Country, 2020-2035
  • Table 59: Middle East and Africa Market Value (USD Billion) Forecast by Product Type, 2020-2035
  • Table 60: Middle East and Africa Market Volume (units) Forecast by Product Type, 2020-2035
  • Table 61: Middle East and Africa Market Value (USD Billion) Forecast by End Use Application, 2020-2035
  • Table 62: Middle East and Africa Market Volume (units) Forecast by End Use Application, 2020-2035
  • Table 63: Middle East and Africa Market Value (USD Billion) Forecast by Distribution Channel, 2020-2035
  • Table 64: Middle East and Africa Market Volume (units) Forecast by Distribution Channel, 2020-2035

List of Figures

  • Figure 1: Global Market Volume (units) Forecast 2020-2035
  • Figure 2: Global Market Pricing Analysis
  • Figure 3: Global Market Value (USD Billion) Forecast 2020-2035
  • Figure 4: Global Market Value Share and BPS Analysis by Product Type, 2025 and 2035
  • Figure 5: Global Market Y-o-Y Growth Comparison by Product Type, 2025-2035
  • Figure 6: Global Market Attractiveness Analysis by Product Type
  • Figure 7: Global Market Value Share and BPS Analysis by End Use Application, 2025 and 2035
  • Figure 8: Global Market Y-o-Y Growth Comparison by End Use Application, 2025-2035
  • Figure 9: Global Market Attractiveness Analysis by End Use Application
  • Figure 10: Global Market Value Share and BPS Analysis by Distribution Channel, 2025 and 2035
  • Figure 11: Global Market Y-o-Y Growth Comparison by Distribution Channel, 2025-2035
  • Figure 12: Global Market Attractiveness Analysis by Distribution Channel
  • Figure 13: Global Market Value (USD Billion) Share and BPS Analysis by Region, 2025 and 2035
  • Figure 14: Global Market Y-o-Y Growth Comparison by Region, 2025-2035
  • Figure 15: Global Market Attractiveness Analysis by Region
  • Figure 16: North America Market Incremental $ Opportunity, 2025-2035
  • Figure 17: Latin America Market Incremental $ Opportunity, 2025-2035
  • Figure 18: Western Europe Market Incremental $ Opportunity, 2025-2035
  • Figure 19: Eastern Europe Market Incremental $ Opportunity, 2025-2035
  • Figure 20: East Asia Market Incremental $ Opportunity, 2025-2035
  • Figure 21: South Asia & Pacific Market Incremental $ Opportunity, 2025-2035
  • Figure 22: Middle East and Africa Market Incremental $ Opportunity, 2025-2035
  • Figure 23: North America Market Value Share and BPS Analysis by Country, 2025 and 2035
  • Figure 24: North America Market Value Share and BPS Analysis by Product Type, 2025 and 2035
  • Figure 25: North America Market Y-o-Y Growth Comparison by Product Type, 2025-2035
  • Figure 26: North America Market Attractiveness Analysis by Product Type
  • Figure 27: North America Market Value Share and BPS Analysis by End Use Application, 2025 and 2035
  • Figure 28: North America Market Y-o-Y Growth Comparison by End Use Application, 2025-2035
  • Figure 29: North America Market Attractiveness Analysis by End Use Application
  • Figure 30: North America Market Value Share and BPS Analysis by Distribution Channel, 2025 and 2035
  • Figure 31: North America Market Y-o-Y Growth Comparison by Distribution Channel, 2025-2035
  • Figure 32: North America Market Attractiveness Analysis by Distribution Channel
  • Figure 33: Latin America Market Value Share and BPS Analysis by Country, 2025 and 2035
  • Figure 34: Latin America Market Value Share and BPS Analysis by Product Type, 2025 and 2035
  • Figure 35: Latin America Market Y-o-Y Growth Comparison by Product Type, 2025-2035
  • Figure 36: Latin America Market Attractiveness Analysis by Product Type
  • Figure 37: Latin America Market Value Share and BPS Analysis by End Use Application, 2025 and 2035
  • Figure 38: Latin America Market Y-o-Y Growth Comparison by End Use Application, 2025-2035
  • Figure 39: Latin America Market Attractiveness Analysis by End Use Application
  • Figure 40: Latin America Market Value Share and BPS Analysis by Distribution Channel, 2025 and 2035
  • Figure 41: Latin America Market Y-o-Y Growth Comparison by Distribution Channel, 2025-2035
  • Figure 42: Latin America Market Attractiveness Analysis by Distribution Channel
  • Figure 43: Western Europe Market Value Share and BPS Analysis by Country, 2025 and 2035
  • Figure 44: Western Europe Market Value Share and BPS Analysis by Product Type, 2025 and 2035
  • Figure 45: Western Europe Market Y-o-Y Growth Comparison by Product Type, 2025-2035
  • Figure 46: Western Europe Market Attractiveness Analysis by Product Type
  • Figure 47: Western Europe Market Value Share and BPS Analysis by End Use Application, 2025 and 2035
  • Figure 48: Western Europe Market Y-o-Y Growth Comparison by End Use Application, 2025-2035
  • Figure 49: Western Europe Market Attractiveness Analysis by End Use Application
  • Figure 50: Western Europe Market Value Share and BPS Analysis by Distribution Channel, 2025 and 2035
  • Figure 51: Western Europe Market Y-o-Y Growth Comparison by Distribution Channel, 2025-2035
  • Figure 52: Western Europe Market Attractiveness Analysis by Distribution Channel
  • Figure 53: Eastern Europe Market Value Share and BPS Analysis by Country, 2025 and 2035
  • Figure 54: Eastern Europe Market Value Share and BPS Analysis by Product Type, 2025 and 2035
  • Figure 55: Eastern Europe Market Y-o-Y Growth Comparison by Product Type, 2025-2035
  • Figure 56: Eastern Europe Market Attractiveness Analysis by Product Type
  • Figure 57: Eastern Europe Market Value Share and BPS Analysis by End Use Application, 2025 and 2035
  • Figure 58: Eastern Europe Market Y-o-Y Growth Comparison by End Use Application, 2025-2035
  • Figure 59: Eastern Europe Market Attractiveness Analysis by End Use Application
  • Figure 60: Eastern Europe Market Value Share and BPS Analysis by Distribution Channel, 2025 and 2035
  • Figure 61: Eastern Europe Market Y-o-Y Growth Comparison by Distribution Channel, 2025-2035
  • Figure 62: Eastern Europe Market Attractiveness Analysis by Distribution Channel
  • Figure 63: East Asia Market Value Share and BPS Analysis by Country, 2025 and 2035
  • Figure 64: East Asia Market Value Share and BPS Analysis by Product Type, 2025 and 2035
  • Figure 65: East Asia Market Y-o-Y Growth Comparison by Product Type, 2025-2035
  • Figure 66: East Asia Market Attractiveness Analysis by Product Type
  • Figure 67: East Asia Market Value Share and BPS Analysis by End Use Application, 2025 and 2035
  • Figure 68: East Asia Market Y-o-Y Growth Comparison by End Use Application, 2025-2035
  • Figure 69: East Asia Market Attractiveness Analysis by End Use Application
  • Figure 70: East Asia Market Value Share and BPS Analysis by Distribution Channel, 2025 and 2035
  • Figure 71: East Asia Market Y-o-Y Growth Comparison by Distribution Channel, 2025-2035
  • Figure 72: East Asia Market Attractiveness Analysis by Distribution Channel
  • Figure 73: South Asia & Pacific Market Value Share and BPS Analysis by Country, 2025 and 2035
  • Figure 74: South Asia & Pacific Market Value Share and BPS Analysis by Product Type, 2025 and 2035
  • Figure 75: South Asia & Pacific Market Y-o-Y Growth Comparison by Product Type, 2025-2035
  • Figure 76: South Asia & Pacific Market Attractiveness Analysis by Product Type
  • Figure 77: South Asia & Pacific Market Value Share and BPS Analysis by End Use Application, 2025 and 2035
  • Figure 78: South Asia & Pacific Market Y-o-Y Growth Comparison by End Use Application, 2025-2035
  • Figure 79: South Asia & Pacific Market Attractiveness Analysis by End Use Application
  • Figure 80: South Asia & Pacific Market Value Share and BPS Analysis by Distribution Channel, 2025 and 2035
  • Figure 81: South Asia & Pacific Market Y-o-Y Growth Comparison by Distribution Channel, 2025-2035
  • Figure 82: South Asia & Pacific Market Attractiveness Analysis by Distribution Channel
  • Figure 83: Middle East and Africa Market Value Share and BPS Analysis by Country, 2025 and 2035
  • Figure 84: Middle East and Africa Market Value Share and BPS Analysis by Product Type, 2025 and 2035
  • Figure 85: Middle East and Africa Market Y-o-Y Growth Comparison by Product Type, 2025-2035
  • Figure 86: Middle East and Africa Market Attractiveness Analysis by Product Type
  • Figure 87: Middle East and Africa Market Value Share and BPS Analysis by End Use Application, 2025 and 2035
  • Figure 88: Middle East and Africa Market Y-o-Y Growth Comparison by End Use Application, 2025-2035
  • Figure 89: Middle East and Africa Market Attractiveness Analysis by End Use Application
  • Figure 90: Middle East and Africa Market Value Share and BPS Analysis by Distribution Channel, 2025 and 2035
  • Figure 91: Middle East and Africa Market Y-o-Y Growth Comparison by Distribution Channel, 2025-2035
  • Figure 92: Middle East and Africa Market Attractiveness Analysis by Distribution Channel
  • Figure 93: Global Market - Tier Structure Analysis
  • Figure 94: Global Market - Company Share Analysis

Frequently Asked Questions

What is the projected size of the oral clinical nutrition desserts market in 2025?

The market size is valued at USD 1.8 billion in 2025.

What is the outlook on oral clinical nutrition desserts demand by 2035?

The market is forecasted to reach USD 3.8 billion by 2035, reflecting a CAGR of 7.4%.

Which product type leads the oral clinical nutrition desserts market in 2025?

Pudding is expected to lead the market with a 33% share in 2025.

What is the projected share of chronic diseases in the end-use application segment by 2025?

Chronic diseases are projected to hold a 45% share of the market in 2025.

Which country is projected to have the fastest-growing oral clinical nutrition desserts market?

Japan is anticipated to be the fastest-growing market with a CAGR of 7.8% from 2025 to 2035.

Explore Similar Insights

Future Market Insights

Oral Clinical Nutrition Desserts Market