Reports

- Global Locations -

Headquarters

Future Market Insights, Inc.

Christiana Corporate, 200
Continental Drive, Suite 401,
Newark, Delaware - 19713,
United States

T: +1-845-579-5705

Americas

Future Market Insights, Inc.

616 Corporate Way, Suite 2-9018,
Valley Cottage, NY 10989, United States

T: +1-347-918-3531

MEA

Future Market Insights

1602-6 Jumeirah Bay X2 Tower, Plot No: JLT-PH2-X2A,
Jumeirah Lakes Towers, Dubai,
United Arab Emirates

Europe

Future Market Insights

3rd Floor, 207 Regent Street,
W1B 3HH London
United Kingdom

T: + 44 (0) 20 8123 9659
D: +44 (0) 20 3287 4268

Asia Pacific

Future Market Insights

IndiaLand Global Tech Park, Unit UG-1, Behind Grand HighStreet, Phase 1, Hinjawadi, MH, Pune – 411057, India

Oral Dosing Cups Market Outlook (2022-2032)

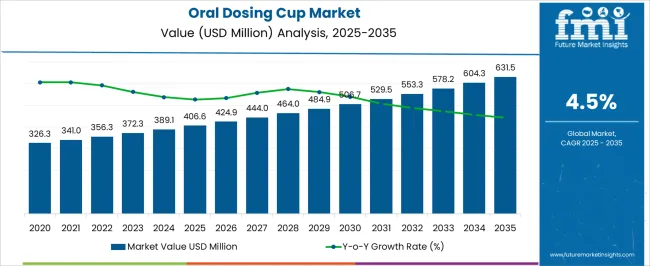
[342 Pages Report] The global oral dosing cups market is anticipated to be valued at US$ 572.6 million by 2032, up from US$ 322.8 million in 2022, increasing at a CAGR of 5.9% during the forecast period.

The modest growth rate of the oral dosing cups market can be attributed to the proliferation of precise dosing for pediatric patients. Given the availability of medicines in the form of liquid medicines, the demand for oral administration of drugs is rising. In addition to this, manufacturers operating in the oral dosing cups market are coming up with a variety of products to capacitate the need.

Report Attribute Details
Oral Dosing Cups Market Value (2022) US$ 322.8 Million
Oral Dosing Cups Market Anticipated Value (2032) US$ 572.6 Million
Oral Dosing Cups Projected Growth Rate (2022-2032) 5.9%

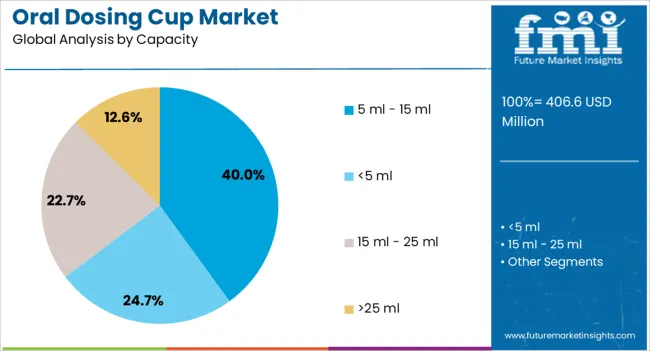
Currently, oral dosing cups are available with the measurement capacity of 2ml to 30ml of medicines, which is leading to huge opportunities for the market. Moreover, the demand for oral dosing cups is surging, owing to their rising adoption in hospitals and pharmaceutical companies.

The demand for oral dosing cups is increasing as they are used efficiently for unit dosing and reduce any chances of contamination risks and medication errors. Besides, one of the key factors driving the global oral dosing cups market is increasing demand for liquid dose delivery devices and greater number of market players in the over-the-counter liquid across the world.

Don't pay for what you don't need

Customize your report by selecting specific countries or regions and save 30%!

Top Strategies Employed by Oral Dosing Cups Market Players to Get an Edge

Quality Improvement and Capacity Enhancement:

The key market driving factor which boosts the growth of oral dosing cups market is increased dependency on oral drug administration for the geriatric and pediatric populace. As a result, companies operating in the oral dosing cups market are contending on the basis of effectiveness, capacity, and quality.

Experimentation is the Way to Go:

Several material and designs associated to oral dosing cups are experimented with to decrease the cost and cater to the generic medicinal demand. With experimentation being the backbone, players are able to bring down the cost and have a better chance to connect with end users based in the developing economies.

Targeting Over-the-counter Medicines:

There has been an acute rise in the demand for dose delivery devices for over-the-counter (OTC) liquid drug products. Among others, sales of oral dosing cups for elixirs, syrups, and suspensions are high, which are meant to assist with precise dispensing of the product by the end user i.e., parent, patient, or caregiver. Hence, manufacturers are seeking loyalty from chemists and chains of pharmacies in order to have better hand at sales.

Sales of over-the-counter drugs are on the rise and is anticipated to propel the demand for oral dosing cups across the world. The Consumer Healthcare Products Association (CHPA) states that in 2020, retail sales of over-the-counter medicines was reported to be nearly US$ 37 billion. This figure indicates lucrative growth prospects for the oral dosing cups market.

Convenience is the Key:

Preference for convenience during medicine intake from both supplier side and demand side is anticipated to promote the rising inclination for products such as oral dosing cups during the forecast period. The number of market manufacturers in the over-the-counter drug market is constantly rising, this growth is predicted to stir the demand for convenient dispensing products and thereby increasing the sales of oral dosing cups across the globe.

Increasing need for cost-efficient solutions offering better preciseness in delivering drugs is likely to promote the demand for oral dosing cups during the forecast period. These dosing cups are usually sold with the over-the-counter drugs to guarantee accuracy of drug delivery.

Accuracy and Safety Goes Hand-in-hand:

There is an additional demand for accurate and safe dosing cups, this is encouraging the growth of the oral dosing cups market further. Moreover, increasing investment from several governments across the globe is likely to result in higher growth during the forecast period.

FDA Compliance? Checked:

Since plastic is the key material used for oral dosing cups, manufacturers are doing their best to produce sustainable and safe products for end users. Despite the zeal to develop innovative packaging materials, it is important for key players to operate within peripheries of the quality compliance. As a result, there has been a high focus on adhering to norms of the quality.

Variety keeps the Sales Pushing:

Product diversification is yet another key strategy employed by players in the oral dosing cups market. One of the key parameters of product differentiation is based on the usability of oral dosing cups. Key players have been diversifying a new dimension out of their usual product manufacturing strategies in order to create disposable and re-usable oral dosing cups.

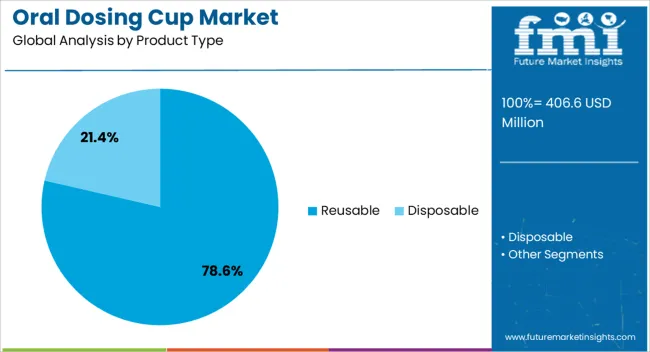
The disposable oral dosing cups can be disposed post their use and decreases the risk of any contamination. These are usually pushed in the developed countries, given the high awareness pertaining to the hygiene. However, re-usable dosing cups are being pushed and targeted for sale in the developing countries.

As per the trend report on oral dosing cups, demand for disposable oral cups is high as any medication error and risk of contamination can be eliminated. Therefore, the sales performance of disposable oral dosing cups is higher as compared to the re-usable oral dosing cups.

Alternatives to Hold the True Potential of the Oral Dosing Cups Market Back

Even though the market is said to maintain its positive position in terms of growth, there are several factors which may hinder the global dosing cups market growth. In rare cases oral dosing cups which are easily available in the market carry misleading calibration bearings. This has confused the end users and resulted in incorrect quantity of drug administration.

As an outcome, several substitutive products for drug administration are recommended and preferred as compared to dosing cups. For instance, droppers, syringes, and cylindrical spoons are some of the alternatives for oral dosing cups.

Ismail Sutaria
Ismail Sutaria

Principal Consultant

Talk to Analyst

Find your sweet spots for generating winning opportunities in this market.

U.S. to Reign the North American Oral Dosing Cups Market

Due to a mature consumer base, North America accounts for 19% market share of the global oral dosing cups market in 2022. Countries such as Canada and the United States are driving the oral dosing cups market in North America. Of these two countries, the U.S. is leading with the biggest market share. Rising investments by the U.S. government and greater healthcare expenditure by the Canadian government imply steady growth in the pharma industry and foresees a considerable growth in the oral dosing cups market during the forecast period.

Increasing prevalence of illness and several other issues related to health results in increasing sales of medical and pharmaceutical products, including oral dosing cups and other medicine measuring cups. Moreover, the development of several novel drugs by manufacturers to treat the illness results in escalated sales of oral dosing cups in the United States.

How is Asia Pacific Contributing to the Global Oral Dosing Cups Market?

The Asia Pacific region is said to provide abundant opportunities for growth of the oral dosing cups market. Owing to large population specifically in India coupled with enhanced healthcare facilities in other developing countries within this region, Asia Pacific is predicted to swell at a considerable growth rate during the forecast period. Unfortunately, a larger amount of Indian population does not have access to proper medicine and healthcare facility, hence, it renders numerous opportunities for the oral dosing cups market to grow.

Moreover, the production cost is low, and the raw materials are easily available, these two factors attract the major market players in the market for oral dosing cups. Besides, labour cost is much lower in India and China as compared to other countries and therefore manufacturers are easily able to establish their manufacturing plant in these countries. China has lower production cost and functional cost. Besides, the widespread virus in China is predicted to escalate the need for oral dosing cups market in this region.

Get the data you need at a Fraction of the cost

Personalize your report by choosing insights you need
and save 40%!

Who are the Key Players in the Oral Dosing Cups Market?

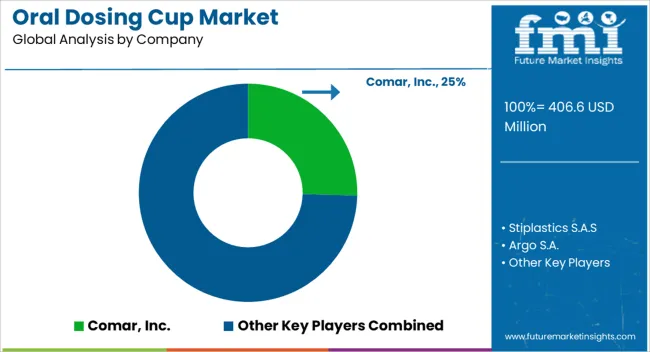
Some of the key players in the oral dosing cups market are Comar, Inc., Stiplastics S.A.S, Argo S.A., and Gramß GmbH Kunststoffverarbeitung, Eastman Chemical Company, Yuyao Liantong Plastic & Mould Co. Ltd., Medline Industries Inc., Origin Pharma Packaging, Adelphi Healthcare Packaging.

Major market players who manufacture dosing cups are aiming on improving their production capacity by intensifying their manufacturing units to compensate for the increasing demand. Furthermore, the oral dosing cups manufacturers are attempting to grow their footprint across the world via merger and acquisitions with the local market players.

  • In February 2022, Comar, Inc., a primary supplier of custom assemblies and medical devices and specialty packaging solutions, declared that it acquired Automatic Plastics Ltd., which is a manufacturer of injection moulded products mainly for pharmaceutical sectors and medical devices.
  • In June 2020, Comar extended its trajectory in East Coast by building a new plant, which will help in expanding their capacity.

Report Scope

Report Attribute Details
Growth Rate CAGR of 5.9% from 2022 to 2032
Base Year for Estimation 2021
Historical Data 2016-2021
Forecast Period 2022-2032
Quantitative Units Revenue in USD million and CAGR from 2022-2032
Report Coverage Revenue Forecast, Volume Forecast, Company Ranking, Competitive Landscape, Growth Factors, Trends and Pricing Analysis
Segments Covered
  • Product Type
  • Capacity
  • End User
  • Region
Regions Covered
  • North America
  • Latin America
  • Europe
  • East Asia
  • South Asia
  • Oceania
  • Middle East and Africa
Key Countries Profiled
  • USA
  • Canada
  • Brazil
  • Argentina
  • Germany
  • UK
  • France
  • Spain
  • Italy
  • Nordics
  • BENELUX
  • Australia & New Zealand
  • China
  • India
  • ASEAN
  • GCC
  • South Africa
Key Companies Profiled
  • Comar, Inc.
  • Stiplastics S.A.S
  • Argo S.A.
  • Gramß GmbH Kunststoffverarbeitung,
  • Eastman Chemical Company
  • Yuyao Liantong Plastic & Mould Co. Ltd.
  • Medline Industries Inc.
  • Origin Pharma Packaging
  • Adelphi Healthcare Packaging
Customization Available Upon Request

Key Segments of the Oral Dosing Cups Market

By Product Type:

  • Disposable
  • Re-usable

By Capacity:

  • <5 ml
  • 5 ml – 15 ml
  • 15 ml – 25 ml
  • >25 ml

By End User:

  • Hospital
  • Clinics
  • Retail Pharmacy
  • Pharmaceuticals
  • Others

By Region:

  • North America
  • Latin America
  • Asia Pacific
  • MEA
  • Europe

Frequently Asked Questions

What is the Growth Outlook for the Oral Dosing Cups Market?

The oral dosing cups market is predicted to advance at a CAGR of 5.9% from 2022 to 2032.

Which Region Leads the Oral Dosing Cups Market?

North America is anticipated to lead the oral dosing cups market through 2032.

How much Growth Potential does the Oral Dosing Cups Market hold?

The oral dosing cups market is likely to hold a valuation of US$ 572.6 million by 2032.

Table of Content

1. Executive Summary

    1.1. Global Market Outlook

    1.2. Demand-side Trends

    1.3. Supply-side Trends

    1.4. Technology Roadmap Analysis

    1.5. Analysis and Recommendations

2. Market Overview

    2.1. Market Coverage / Taxonomy

    2.2. Market Definition / Scope / Limitations

3. Market Background

    3.1. Market Dynamics

        3.1.1. Drivers

        3.1.2. Restraints

        3.1.3. Opportunity

        3.1.4. Trends

    3.2. Scenario Forecast

        3.2.1. Demand in Optimistic Scenario

        3.2.2. Demand in Likely Scenario

        3.2.3. Demand in Conservative Scenario

    3.3. Opportunity Map Analysis

    3.4. Product Life Cycle Analysis

    3.5. Supply Chain Analysis

        3.5.1. Supply Side Participants and their Roles

            3.5.1.1. Producers

            3.5.1.2. Mid-Level Participants (Traders/ Agents/ Brokers)

            3.5.1.3. Wholesalers and Distributors

        3.5.2. Value Added and Value Created at Node in the Supply Chain

        3.5.3. List of Raw Material Suppliers

        3.5.4. List of Existing and Potential Buyer’s

    3.6. Investment Feasibility Matrix

    3.7. Value Chain Analysis

        3.7.1. Profit Margin Analysis

        3.7.2. Wholesalers and Distributors

        3.7.3. Retailers

    3.8. PESTLE and Porter’s Analysis

    3.9. Regulatory Landscape

        3.9.1. By Key Regions

        3.9.2. By Key Countries

    3.10. Regional Parent Market Outlook

    3.11. Production and Consumption Statistics

    3.12. Import and Export Statistics

4. Global Oral Dosing Cups Market Analysis 2017-2021 and Forecast, 2022-2032

    4.1. Historical Market Size Value (US$ Mn) & Volume (Units) Analysis, 2017-2021

    4.2. Current and Future Market Size Value (US$ Mn) & Volume (Units) Projections, 2022-2032

        4.2.1. Y-o-Y Growth Trend Analysis

        4.2.2. Absolute $ Opportunity Analysis

5. Global Oral Dosing Cups Market Analysis 2017-2021 and Forecast 2022-2032, By Product Type

    5.1. Introduction / Key Findings

    5.2. Historical Market Size Value (US$ Mn) & Volume (Units) Analysis By Product Type, 2017-2021

    5.3. Current and Future Market Size Value (US$ Mn) & Volume (Units) Analysis and Forecast By Product Type, 2022-2032

        5.3.1. Disposable

        5.3.2. Re-usable

    5.4. Y-o-Y Growth Trend Analysis By Product Type, 2017-2021

    5.5. Absolute $ Opportunity Analysis By Product Type, 2022-2032

6. Global Oral Dosing Cups Market Analysis 2017-2021 and Forecast 2022-2032, By Capacity

    6.1. Introduction / Key Findings

    6.2. Historical Market Size Value (US$ Mn) & Volume (Units) Analysis By Capacity, 2017-2021

    6.3. Current and Future Market Size Value (US$ Mn) & Volume (Units) Analysis and Forecast By Capacity, 2022-2032

        6.3.1. <5 ml

        6.3.2. 5 ml – 15 ml

        6.3.3. 15 ml – 25 ml

        6.3.4. >25 ml

    6.4. Y-o-Y Growth Trend Analysis By Capacity, 2017-2021

    6.5. Absolute $ Opportunity Analysis By Capacity, 2022-2032

7. Global Oral Dosing Cups Market Analysis 2017-2021 and Forecast 2022-2032, By Region

    7.1. Introduction

    7.2. Historical Market Size Value (US$ Mn) & Volume (Units) Analysis By Region, 2017-2021

    7.3. Current Market Size Value (US$ Mn) & Volume (Units) Analysis and Forecast By Region, 2022-2032

        7.3.1. North America

        7.3.2. Latin America

        7.3.3. Europe

        7.3.4. Asia Pacific

        7.3.5. MEA

    7.4. Market Attractiveness Analysis By Region

8. North America Oral Dosing Cups Market Analysis 2017-2021 and Forecast 2022-2032, By Country

    8.1. Historical Market Size Value (US$ Mn) & Volume (Units) Trend Analysis By Market Taxonomy, 2017-2021

    8.2. Market Size Value (US$ Mn) & Volume (Units) Forecast By Market Taxonomy, 2022-2032

        8.2.1. By Country

            8.2.1.1. U.S.

            8.2.1.2. Canada

        8.2.2. By Product Type

        8.2.3. By Capacity

    8.3. Market Attractiveness Analysis

        8.3.1. By Country

        8.3.2. By Product Type

        8.3.3. By Capacity

    8.4. Key Takeaways

9. Latin America Oral Dosing Cups Market Analysis 2017-2021 and Forecast 2022-2032, By Country

    9.1. Historical Market Size Value (US$ Mn) & Volume (Units) Trend Analysis By Market Taxonomy, 2017-2021

    9.2. Market Size Value (US$ Mn) & Volume (Units) Forecast By Market Taxonomy, 2022-2032

        9.2.1. By Country

            9.2.1.1. Brazil

            9.2.1.2. Mexico

            9.2.1.3. Rest of Latin America

        9.2.2. By Product Type

        9.2.3. By Capacity

    9.3. Market Attractiveness Analysis

        9.3.1. By Country

        9.3.2. By Product Type

        9.3.3. By Capacity

    9.4. Key Takeaways

10. Europe Oral Dosing Cups Market Analysis 2017-2021 and Forecast 2022-2032, By Country

    10.1. Historical Market Size Value (US$ Mn) & Volume (Units) Trend Analysis By Market Taxonomy, 2017-2021

    10.2. Market Size Value (US$ Mn) & Volume (Units) Forecast By Market Taxonomy, 2022-2032

        10.2.1. By Country

            10.2.1.1. Germany

            10.2.1.2. U.K.

            10.2.1.3. France

            10.2.1.4. Spain

            10.2.1.5. Italy

            10.2.1.6. Rest of Europe

        10.2.2. By Product Type

        10.2.3. By Capacity

    10.3. Market Attractiveness Analysis

        10.3.1. By Country

        10.3.2. By Product Type

        10.3.3. By Capacity

    10.4. Key Takeaways

11. Asia Pacific Oral Dosing Cups Market Analysis 2017-2021 and Forecast 2022-2032, By Country

    11.1. Historical Market Size Value (US$ Mn) & Volume (Units) Trend Analysis By Market Taxonomy, 2017-2021

    11.2. Market Size Value (US$ Mn) & Volume (Units) Forecast By Market Taxonomy, 2022-2032

        11.2.1. By Country

            11.2.1.1. China

            11.2.1.2. Japan

            11.2.1.3. South Korea

            11.2.1.4. Malaysia

            11.2.1.5. Singapore

            11.2.1.6. Australia

            11.2.1.7. New Zealand

            11.2.1.8. Rest of APAC

        11.2.2. By Product Type

        11.2.3. By Capacity

    11.3. Market Attractiveness Analysis

        11.3.1. By Country

        11.3.2. By Product Type

        11.3.3. By Capacity

    11.4. Key Takeaways

12. MEA Oral Dosing Cups Market Analysis 2017-2021 and Forecast 2022-2032, By Country

    12.1. Historical Market Size Value (US$ Mn) & Volume (Units) Trend Analysis By Market Taxonomy, 2017-2021

    12.2. Market Size Value (US$ Mn) & Volume (Units) Forecast By Market Taxonomy, 2022-2032

        12.2.1. By Country

            12.2.1.1. GCC Countries

            12.2.1.2. South Africa

            12.2.1.3. Israel

            12.2.1.4. Rest of MEA

        12.2.2. By Product Type

        12.2.3. By Capacity

    12.3. Market Attractiveness Analysis

        12.3.1. By Country

        12.3.2. By Product Type

        12.3.3. By Capacity

    12.4. Key Takeaways

13. Key Countries Oral Dosing Cups Market Analysis

    13.1. U.S.

        13.1.1. Pricing Analysis

        13.1.2. Market Share Analysis, 2021

            13.1.2.1. By Product Type

            13.1.2.2. By Capacity

    13.2. Canada

        13.2.1. Pricing Analysis

        13.2.2. Market Share Analysis, 2021

            13.2.2.1. By Product Type

            13.2.2.2. By Capacity

    13.3. Brazil

        13.3.1. Pricing Analysis

        13.3.2. Market Share Analysis, 2021

            13.3.2.1. By Product Type

            13.3.2.2. By Capacity

    13.4. Mexico

        13.4.1. Pricing Analysis

        13.4.2. Market Share Analysis, 2021

            13.4.2.1. By Product Type

            13.4.2.2. By Capacity

    13.5. Germany

        13.5.1. Pricing Analysis

        13.5.2. Market Share Analysis, 2021

            13.5.2.1. By Product Type

            13.5.2.2. By Capacity

    13.6. U.K.

        13.6.1. Pricing Analysis

        13.6.2. Market Share Analysis, 2021

            13.6.2.1. By Product Type

            13.6.2.2. By Capacity

    13.7. France

        13.7.1. Pricing Analysis

        13.7.2. Market Share Analysis, 2021

            13.7.2.1. By Product Type

            13.7.2.2. By Capacity

    13.8. Spain

        13.8.1. Pricing Analysis

        13.8.2. Market Share Analysis, 2021

            13.8.2.1. By Product Type

            13.8.2.2. By Capacity

    13.9. Italy

        13.9.1. Pricing Analysis

        13.9.2. Market Share Analysis, 2021

            13.9.2.1. By Product Type

            13.9.2.2. By Capacity

    13.10. China

        13.10.1. Pricing Analysis

        13.10.2. Market Share Analysis, 2021

            13.10.2.1. By Product Type

            13.10.2.2. By Capacity

    13.11. Japan

        13.11.1. Pricing Analysis

        13.11.2. Market Share Analysis, 2021

            13.11.2.1. By Product Type

            13.11.2.2. By Capacity

    13.12. South Korea

        13.12.1. Pricing Analysis

        13.12.2. Market Share Analysis, 2021

            13.12.2.1. By Product Type

            13.12.2.2. By Capacity

    13.13. Malaysia

        13.13.1. Pricing Analysis

        13.13.2. Market Share Analysis, 2021

            13.13.2.1. By Product Type

            13.13.2.2. By Capacity

    13.14. Singapore

        13.14.1. Pricing Analysis

        13.14.2. Market Share Analysis, 2021

            13.14.2.1. By Product Type

            13.14.2.2. By Capacity

    13.15. Australia

        13.15.1. Pricing Analysis

        13.15.2. Market Share Analysis, 2021

            13.15.2.1. By Product Type

            13.15.2.2. By Capacity

    13.16. New Zealand

        13.16.1. Pricing Analysis

        13.16.2. Market Share Analysis, 2021

            13.16.2.1. By Product Type

            13.16.2.2. By Capacity

    13.17. GCC Countries

        13.17.1. Pricing Analysis

        13.17.2. Market Share Analysis, 2021

            13.17.2.1. By Product Type

            13.17.2.2. By Capacity

    13.18. South Africa

        13.18.1. Pricing Analysis

        13.18.2. Market Share Analysis, 2021

            13.18.2.1. By Product Type

            13.18.2.2. By Capacity

    13.19. Israel

        13.19.1. Pricing Analysis

        13.19.2. Market Share Analysis, 2021

            13.19.2.1. By Product Type

            13.19.2.2. By Capacity

14. Market Structure Analysis

    14.1. Competition Dashboard

    14.2. Competition Benchmarking

    14.3. Market Share Analysis of Top Players

        14.3.1. By Regional

        14.3.2. By Product Type

        14.3.3. By Capacity

15. Competition Analysis

    15.1. Competition Deep Dive

        15.1.1. Comar, Inc.

            15.1.1.1. Overview

            15.1.1.2. Product Portfolio

            15.1.1.3. Profitability by Market Segments

            15.1.1.4. Sales Footprint

            15.1.1.5. Strategy Overview

                15.1.1.5.1. Marketing Strategy

                15.1.1.5.2. Product Strategy

                15.1.1.5.3. Channel Strategy

        15.1.2. Stiplastics S.A.S

            15.1.2.1. Overview

            15.1.2.2. Product Portfolio

            15.1.2.3. Profitability by Market Segments

            15.1.2.4. Sales Footprint

            15.1.2.5. Strategy Overview

                15.1.2.5.1. Marketing Strategy

                15.1.2.5.2. Product Strategy

                15.1.2.5.3. Channel Strategy

        15.1.3. Argo S.A.

            15.1.3.1. Overview

            15.1.3.2. Product Portfolio

            15.1.3.3. Profitability by Market Segments

            15.1.3.4. Sales Footprint

            15.1.3.5. Strategy Overview

                15.1.3.5.1. Marketing Strategy

                15.1.3.5.2. Product Strategy

                15.1.3.5.3. Channel Strategy

        15.1.4. Gramb GmbH Kunststoffverarbeitung

            15.1.4.1. Overview

            15.1.4.2. Product Portfolio

            15.1.4.3. Profitability by Market Segments

            15.1.4.4. Sales Footprint

            15.1.4.5. Strategy Overview

                15.1.4.5.1. Marketing Strategy

                15.1.4.5.2. Product Strategy

                15.1.4.5.3. Channel Strategy

        15.1.5. Origin Pharma Packaging

            15.1.5.1. Overview

            15.1.5.2. Product Portfolio

            15.1.5.3. Profitability by Market Segments

            15.1.5.4. Sales Footprint

            15.1.5.5. Strategy Overview

                15.1.5.5.1. Marketing Strategy

                15.1.5.5.2. Product Strategy

                15.1.5.5.3. Channel Strategy

        15.1.6. Eastman Chemical Company

            15.1.6.1. Overview

            15.1.6.2. Product Portfolio

            15.1.6.3. Profitability by Market Segments

            15.1.6.4. Sales Footprint

            15.1.6.5. Strategy Overview

                15.1.6.5.1. Marketing Strategy

                15.1.6.5.2. Product Strategy

                15.1.6.5.3. Channel Strategy

        15.1.7. Yuyao Liantong Plastic & Mould Co. Ltd.

            15.1.7.1. Overview

            15.1.7.2. Product Portfolio

            15.1.7.3. Profitability by Market Segments

            15.1.7.4. Sales Footprint

            15.1.7.5. Strategy Overview

                15.1.7.5.1. Marketing Strategy

                15.1.7.5.2. Product Strategy

                15.1.7.5.3. Channel Strategy

        15.1.8. Medline Industries Inc.

            15.1.8.1. Overview

            15.1.8.2. Product Portfolio

            15.1.8.3. Profitability by Market Segments

            15.1.8.4. Sales Footprint

            15.1.8.5. Strategy Overview

                15.1.8.5.1. Marketing Strategy

                15.1.8.5.2. Product Strategy

                15.1.8.5.3. Channel Strategy

        15.1.9. Adelphi Healthcare Packaging

            15.1.9.1. Overview

            15.1.9.2. Product Portfolio

            15.1.9.3. Profitability by Market Segments

            15.1.9.4. Sales Footprint

            15.1.9.5. Strategy Overview

                15.1.9.5.1. Marketing Strategy

                15.1.9.5.2. Product Strategy

                15.1.9.5.3. Channel Strategy

        15.1.10. Precision Dose Inc

            15.1.10.1. Overview

            15.1.10.2. Product Portfolio

            15.1.10.3. Profitability by Market Segments

            15.1.10.4. Sales Footprint

            15.1.10.5. Strategy Overview

                15.1.10.5.1. Marketing Strategy

                15.1.10.5.2. Product Strategy

                15.1.10.5.3. Channel Strategy

16. Assumptions & Acronyms Used

17. Research Methodology

Don't pay for what you don't need

Customize your report by selecting specific countries or regions and save 30%!

List of Tables

Table 1: Global Oral Dosing Cups Market Value (US$ Mn) Forecast by Region, 2017-2032

Table 2: Global Oral Dosing Cups Market Volume (Units) Forecast by Region, 2017-2032

Table 3: Global Oral Dosing Cups Market Value (US$ Mn) Forecast by Product Type, 2017-2032

Table 4: Global Oral Dosing Cups Market Volume (Units) Forecast by Product Type, 2017-2032

Table 5: Global Oral Dosing Cups Market Value (US$ Mn) Forecast by Capacity, 2017-2032

Table 6: Global Oral Dosing Cups Market Volume (Units) Forecast by Capacity, 2017-2032

Table 7: North America Oral Dosing Cups Market Value (US$ Mn) Forecast by Country, 2017-2032

Table 8: North America Oral Dosing Cups Market Volume (Units) Forecast by Country, 2017-2032

Table 9: North America Oral Dosing Cups Market Value (US$ Mn) Forecast by Product Type, 2017-2032

Table 10: North America Oral Dosing Cups Market Volume (Units) Forecast by Product Type, 2017-2032

Table 11: North America Oral Dosing Cups Market Value (US$ Mn) Forecast by Capacity, 2017-2032

Table 12: North America Oral Dosing Cups Market Volume (Units) Forecast by Capacity, 2017-2032

Table 13: Latin America Oral Dosing Cups Market Value (US$ Mn) Forecast by Country, 2017-2032

Table 14: Latin America Oral Dosing Cups Market Volume (Units) Forecast by Country, 2017-2032

Table 15: Latin America Oral Dosing Cups Market Value (US$ Mn) Forecast by Product Type, 2017-2032

Table 16: Latin America Oral Dosing Cups Market Volume (Units) Forecast by Product Type, 2017-2032

Table 17: Latin America Oral Dosing Cups Market Value (US$ Mn) Forecast by Capacity, 2017-2032

Table 18: Latin America Oral Dosing Cups Market Volume (Units) Forecast by Capacity, 2017-2032

Table 19: Europe Oral Dosing Cups Market Value (US$ Mn) Forecast by Country, 2017-2032

Table 20: Europe Oral Dosing Cups Market Volume (Units) Forecast by Country, 2017-2032

Table 21: Europe Oral Dosing Cups Market Value (US$ Mn) Forecast by Product Type, 2017-2032

Table 22: Europe Oral Dosing Cups Market Volume (Units) Forecast by Product Type, 2017-2032

Table 23: Europe Oral Dosing Cups Market Value (US$ Mn) Forecast by Capacity, 2017-2032

Table 24: Europe Oral Dosing Cups Market Volume (Units) Forecast by Capacity, 2017-2032

Table 25: Asia Pacific Oral Dosing Cups Market Value (US$ Mn) Forecast by Country, 2017-2032

Table 26: Asia Pacific Oral Dosing Cups Market Volume (Units) Forecast by Country, 2017-2032

Table 27: Asia Pacific Oral Dosing Cups Market Value (US$ Mn) Forecast by Product Type, 2017-2032

Table 28: Asia Pacific Oral Dosing Cups Market Volume (Units) Forecast by Product Type, 2017-2032

Table 29: Asia Pacific Oral Dosing Cups Market Value (US$ Mn) Forecast by Capacity, 2017-2032

Table 30: Asia Pacific Oral Dosing Cups Market Volume (Units) Forecast by Capacity, 2017-2032

Table 31: MEA Oral Dosing Cups Market Value (US$ Mn) Forecast by Country, 2017-2032

Table 32: MEA Oral Dosing Cups Market Volume (Units) Forecast by Country, 2017-2032

Table 33: MEA Oral Dosing Cups Market Value (US$ Mn) Forecast by Product Type, 2017-2032

Table 34: MEA Oral Dosing Cups Market Volume (Units) Forecast by Product Type, 2017-2032

Table 35: MEA Oral Dosing Cups Market Value (US$ Mn) Forecast by Capacity, 2017-2032

Table 36: MEA Oral Dosing Cups Market Volume (Units) Forecast by Capacity, 2017-2032
Ismail Sutaria
Ismail Sutaria

Principal Consultant

Talk to Analyst

Find your sweet spots for generating winning opportunities in this market.

List of Charts

Figure 1: Global Oral Dosing Cups Market Value (US$ Mn) by Product Type, 2022-2032

Figure 2: Global Oral Dosing Cups Market Value (US$ Mn) by Capacity, 2022-2032

Figure 3: Global Oral Dosing Cups Market Value (US$ Mn) by Region, 2022-2032

Figure 4: Global Oral Dosing Cups Market Value (US$ Mn) Analysis by Region, 2017-2032

Figure 5: Global Oral Dosing Cups Market Volume (Units) Analysis by Region, 2017-2032

Figure 6: Global Oral Dosing Cups Market Value Share (%) and BPS Analysis by Region, 2022-2032

Figure 7: Global Oral Dosing Cups Market Y-o-Y Growth (%) Projections by Region, 2022-2032

Figure 8: Global Oral Dosing Cups Market Value (US$ Mn) Analysis by Product Type, 2017-2032

Figure 9: Global Oral Dosing Cups Market Volume (Units) Analysis by Product Type, 2017-2032

Figure 10: Global Oral Dosing Cups Market Value Share (%) and BPS Analysis by Product Type, 2022-2032

Figure 11: Global Oral Dosing Cups Market Y-o-Y Growth (%) Projections by Product Type, 2022-2032

Figure 12: Global Oral Dosing Cups Market Value (US$ Mn) Analysis by Capacity, 2017-2032

Figure 13: Global Oral Dosing Cups Market Volume (Units) Analysis by Capacity, 2017-2032

Figure 14: Global Oral Dosing Cups Market Value Share (%) and BPS Analysis by Capacity, 2022-2032

Figure 15: Global Oral Dosing Cups Market Y-o-Y Growth (%) Projections by Capacity, 2022-2032

Figure 16: Global Oral Dosing Cups Market Attractiveness by Product Type, 2022-2032

Figure 17: Global Oral Dosing Cups Market Attractiveness by Capacity, 2022-2032

Figure 18: Global Oral Dosing Cups Market Attractiveness by Region, 2022-2032

Figure 19: North America Oral Dosing Cups Market Value (US$ Mn) by Product Type, 2022-2032

Figure 20: North America Oral Dosing Cups Market Value (US$ Mn) by Capacity, 2022-2032

Figure 21: North America Oral Dosing Cups Market Value (US$ Mn) by Country, 2022-2032

Figure 22: North America Oral Dosing Cups Market Value (US$ Mn) Analysis by Country, 2017-2032

Figure 23: North America Oral Dosing Cups Market Volume (Units) Analysis by Country, 2017-2032

Figure 24: North America Oral Dosing Cups Market Value Share (%) and BPS Analysis by Country, 2022-2032

Figure 25: North America Oral Dosing Cups Market Y-o-Y Growth (%) Projections by Country, 2022-2032

Figure 26: North America Oral Dosing Cups Market Value (US$ Mn) Analysis by Product Type, 2017-2032

Figure 27: North America Oral Dosing Cups Market Volume (Units) Analysis by Product Type, 2017-2032

Figure 28: North America Oral Dosing Cups Market Value Share (%) and BPS Analysis by Product Type, 2022-2032

Figure 29: North America Oral Dosing Cups Market Y-o-Y Growth (%) Projections by Product Type, 2022-2032

Figure 30: North America Oral Dosing Cups Market Value (US$ Mn) Analysis by Capacity, 2017-2032

Figure 31: North America Oral Dosing Cups Market Volume (Units) Analysis by Capacity, 2017-2032

Figure 32: North America Oral Dosing Cups Market Value Share (%) and BPS Analysis by Capacity, 2022-2032

Figure 33: North America Oral Dosing Cups Market Y-o-Y Growth (%) Projections by Capacity, 2022-2032

Figure 34: North America Oral Dosing Cups Market Attractiveness by Product Type, 2022-2032

Figure 35: North America Oral Dosing Cups Market Attractiveness by Capacity, 2022-2032

Figure 36: North America Oral Dosing Cups Market Attractiveness by Country, 2022-2032

Figure 37: Latin America Oral Dosing Cups Market Value (US$ Mn) by Product Type, 2022-2032

Figure 38: Latin America Oral Dosing Cups Market Value (US$ Mn) by Capacity, 2022-2032

Figure 39: Latin America Oral Dosing Cups Market Value (US$ Mn) by Country, 2022-2032

Figure 40: Latin America Oral Dosing Cups Market Value (US$ Mn) Analysis by Country, 2017-2032

Figure 41: Latin America Oral Dosing Cups Market Volume (Units) Analysis by Country, 2017-2032

Figure 42: Latin America Oral Dosing Cups Market Value Share (%) and BPS Analysis by Country, 2022-2032

Figure 43: Latin America Oral Dosing Cups Market Y-o-Y Growth (%) Projections by Country, 2022-2032

Figure 44: Latin America Oral Dosing Cups Market Value (US$ Mn) Analysis by Product Type, 2017-2032

Figure 45: Latin America Oral Dosing Cups Market Volume (Units) Analysis by Product Type, 2017-2032

Figure 46: Latin America Oral Dosing Cups Market Value Share (%) and BPS Analysis by Product Type, 2022-2032

Figure 47: Latin America Oral Dosing Cups Market Y-o-Y Growth (%) Projections by Product Type, 2022-2032

Figure 48: Latin America Oral Dosing Cups Market Value (US$ Mn) Analysis by Capacity, 2017-2032

Figure 49: Latin America Oral Dosing Cups Market Volume (Units) Analysis by Capacity, 2017-2032

Figure 50: Latin America Oral Dosing Cups Market Value Share (%) and BPS Analysis by Capacity, 2022-2032

Figure 51: Latin America Oral Dosing Cups Market Y-o-Y Growth (%) Projections by Capacity, 2022-2032

Figure 52: Latin America Oral Dosing Cups Market Attractiveness by Product Type, 2022-2032

Figure 53: Latin America Oral Dosing Cups Market Attractiveness by Capacity, 2022-2032

Figure 54: Latin America Oral Dosing Cups Market Attractiveness by Country, 2022-2032

Figure 55: Europe Oral Dosing Cups Market Value (US$ Mn) by Product Type, 2022-2032

Figure 56: Europe Oral Dosing Cups Market Value (US$ Mn) by Capacity, 2022-2032

Figure 57: Europe Oral Dosing Cups Market Value (US$ Mn) by Country, 2022-2032

Figure 58: Europe Oral Dosing Cups Market Value (US$ Mn) Analysis by Country, 2017-2032

Figure 59: Europe Oral Dosing Cups Market Volume (Units) Analysis by Country, 2017-2032

Figure 60: Europe Oral Dosing Cups Market Value Share (%) and BPS Analysis by Country, 2022-2032

Figure 61: Europe Oral Dosing Cups Market Y-o-Y Growth (%) Projections by Country, 2022-2032

Figure 62: Europe Oral Dosing Cups Market Value (US$ Mn) Analysis by Product Type, 2017-2032

Figure 63: Europe Oral Dosing Cups Market Volume (Units) Analysis by Product Type, 2017-2032

Figure 64: Europe Oral Dosing Cups Market Value Share (%) and BPS Analysis by Product Type, 2022-2032

Figure 65: Europe Oral Dosing Cups Market Y-o-Y Growth (%) Projections by Product Type, 2022-2032

Figure 66: Europe Oral Dosing Cups Market Value (US$ Mn) Analysis by Capacity, 2017-2032

Figure 67: Europe Oral Dosing Cups Market Volume (Units) Analysis by Capacity, 2017-2032

Figure 68: Europe Oral Dosing Cups Market Value Share (%) and BPS Analysis by Capacity, 2022-2032

Figure 69: Europe Oral Dosing Cups Market Y-o-Y Growth (%) Projections by Capacity, 2022-2032

Figure 70: Europe Oral Dosing Cups Market Attractiveness by Product Type, 2022-2032

Figure 71: Europe Oral Dosing Cups Market Attractiveness by Capacity, 2022-2032

Figure 72: Europe Oral Dosing Cups Market Attractiveness by Country, 2022-2032

Figure 73: Asia Pacific Oral Dosing Cups Market Value (US$ Mn) by Product Type, 2022-2032

Figure 74: Asia Pacific Oral Dosing Cups Market Value (US$ Mn) by Capacity, 2022-2032

Figure 75: Asia Pacific Oral Dosing Cups Market Value (US$ Mn) by Country, 2022-2032

Figure 76: Asia Pacific Oral Dosing Cups Market Value (US$ Mn) Analysis by Country, 2017-2032

Figure 77: Asia Pacific Oral Dosing Cups Market Volume (Units) Analysis by Country, 2017-2032

Figure 78: Asia Pacific Oral Dosing Cups Market Value Share (%) and BPS Analysis by Country, 2022-2032

Figure 79: Asia Pacific Oral Dosing Cups Market Y-o-Y Growth (%) Projections by Country, 2022-2032

Figure 80: Asia Pacific Oral Dosing Cups Market Value (US$ Mn) Analysis by Product Type, 2017-2032

Figure 81: Asia Pacific Oral Dosing Cups Market Volume (Units) Analysis by Product Type, 2017-2032

Figure 82: Asia Pacific Oral Dosing Cups Market Value Share (%) and BPS Analysis by Product Type, 2022-2032

Figure 83: Asia Pacific Oral Dosing Cups Market Y-o-Y Growth (%) Projections by Product Type, 2022-2032

Figure 84: Asia Pacific Oral Dosing Cups Market Value (US$ Mn) Analysis by Capacity, 2017-2032

Figure 85: Asia Pacific Oral Dosing Cups Market Volume (Units) Analysis by Capacity, 2017-2032

Figure 86: Asia Pacific Oral Dosing Cups Market Value Share (%) and BPS Analysis by Capacity, 2022-2032

Figure 87: Asia Pacific Oral Dosing Cups Market Y-o-Y Growth (%) Projections by Capacity, 2022-2032

Figure 88: Asia Pacific Oral Dosing Cups Market Attractiveness by Product Type, 2022-2032

Figure 89: Asia Pacific Oral Dosing Cups Market Attractiveness by Capacity, 2022-2032

Figure 90: Asia Pacific Oral Dosing Cups Market Attractiveness by Country, 2022-2032

Figure 91: MEA Oral Dosing Cups Market Value (US$ Mn) by Product Type, 2022-2032

Figure 92: MEA Oral Dosing Cups Market Value (US$ Mn) by Capacity, 2022-2032

Figure 93: MEA Oral Dosing Cups Market Value (US$ Mn) by Country, 2022-2032

Figure 94: MEA Oral Dosing Cups Market Value (US$ Mn) Analysis by Country, 2017-2032

Figure 95: MEA Oral Dosing Cups Market Volume (Units) Analysis by Country, 2017-2032

Figure 96: MEA Oral Dosing Cups Market Value Share (%) and BPS Analysis by Country, 2022-2032

Figure 97: MEA Oral Dosing Cups Market Y-o-Y Growth (%) Projections by Country, 2022-2032

Figure 98: MEA Oral Dosing Cups Market Value (US$ Mn) Analysis by Product Type, 2017-2032

Figure 99: MEA Oral Dosing Cups Market Volume (Units) Analysis by Product Type, 2017-2032

Figure 100: MEA Oral Dosing Cups Market Value Share (%) and BPS Analysis by Product Type, 2022-2032

Figure 101: MEA Oral Dosing Cups Market Y-o-Y Growth (%) Projections by Product Type, 2022-2032

Figure 102: MEA Oral Dosing Cups Market Value (US$ Mn) Analysis by Capacity, 2017-2032

Figure 103: MEA Oral Dosing Cups Market Volume (Units) Analysis by Capacity, 2017-2032

Figure 104: MEA Oral Dosing Cups Market Value Share (%) and BPS Analysis by Capacity, 2022-2032

Figure 105: MEA Oral Dosing Cups Market Y-o-Y Growth (%) Projections by Capacity, 2022-2032

Figure 106: MEA Oral Dosing Cups Market Attractiveness by Product Type, 2022-2032

Figure 107: MEA Oral Dosing Cups Market Attractiveness by Capacity, 2022-2032

Figure 108: MEA Oral Dosing Cups Market Attractiveness by Country, 2022-2032

Recommendations

Packaging

Pre-Made Cups Market

Published : March 2023

Packaging

Heat Sensitive Cups Market

Published : January 2023

Explore Packaging Insights

View Reports