Reports

- Global Locations -

Headquarters

Future Market Insights, Inc.

Christiana Corporate, 200
Continental Drive, Suite 401,
Newark, Delaware - 19713,
United States

T: +1-845-579-5705

Americas

Future Market Insights, Inc.

616 Corporate Way, Suite 2-9018,
Valley Cottage, NY 10989, United States

T: +1-347-918-3531

MEA

Future Market Insights

1602-6 Jumeirah Bay X2 Tower, Plot No: JLT-PH2-X2A,
Jumeirah Lakes Towers, Dubai,
United Arab Emirates

Europe

Future Market Insights

3rd Floor, 207 Regent Street,
W1B 3HH London
United Kingdom

T: + 44 (0) 20 8123 9659
D: +44 (0) 20 3287 4268

Asia Pacific

Future Market Insights

IndiaLand Global Tech Park, Unit UG-1, Behind Grand HighStreet, Phase 1, Hinjawadi, MH, Pune – 411057, India

Floral Extract Market Overview (2022 to 2029)

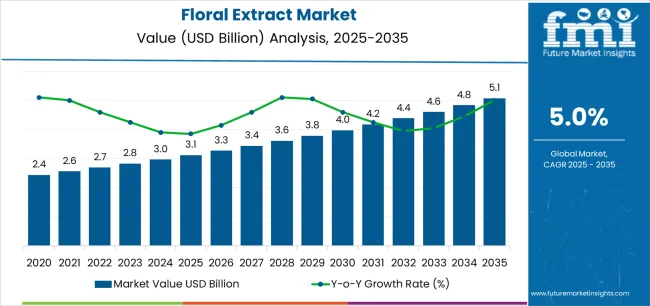
As per newly released data by Future Market Insights (FMI), the floral extract market is estimated at USD 2.6 billion in 2022 and is projected to reach USD 3.8 billion by 2029, at a CAGR of 4.3% from 2014 to 2021.

Attribute Details
Estimated Floral Extract Market Size 2022 US$ 2.6 Billion
Projected Floral Extract (2029) Market Size US$ 3.8 Billion
Value CAGR (2022 to 2029) 5.1%
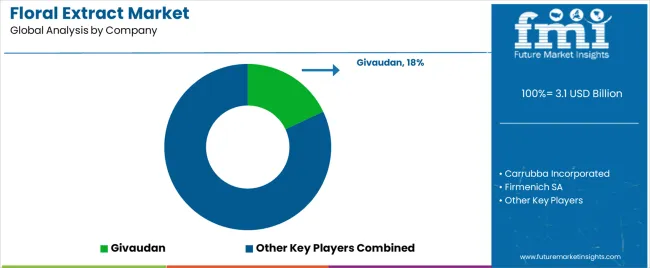
Floral Extract Market Top Players Share in 2021. 20%-25%

The share of the floral extract market in its parent market (personal care ingredients market) is approximately 5%-7%.

Don't pay for what you don't need

Customize your report by selecting specific countries or regions and save 30%!

How The Market Progressed Till June 2022?

Market Statistics Details
H1,2021 (A) 5.4%
H1,2022 Projected (P) 5.5%
H1,2022 Outlook (O) 6.1%
BPS Change : H1,2022 (O) - H1,2022 (P) (+) 55 ↑
BPS Change : H1,2022 (O) - H1,2021 (A) (+) 61 ↑

Future Market Insights predict a comparison and review analysis of the dynamics of the floral extract market, which is principally subjected to an array of industry factors along with a few definite influences concerning viewpoints that support industry innovation. Some new advances that have taken place in the market include manufacturers producing natural ingredients mixed or organic products.

According to FMI analysis, the variation between the BPS values observed in the floral extract market in H1, 2022 - Outlook over H1, 2022 Projected reflects a growth of 55 units. However, compared to H1, 2021, the market is expected to spike by 61 BPS in H1 -2022.

Key reasons for this change in growth rate are attributed to the steady uptake of the market during the first half of the forecast period, owing to the consumer demand for natural or organic products increasing as a result of increased awareness. In Dec 2021, Firmenich, announced Pure Imagination, a new collection of fragrances inspired by Pantone® Color of the Year 2022, PANTONE.

Despite these prospects, there are some likely challenges that stay ahead for the industry, which include the extraction of the flower being expensive and the extraction filters and very huge and expensive.

Floral Extract Market

Key Points Covered in Floral Extract Market Survey

  • Market estimates and forecast 2014 to 2029
  • Key drivers and restraints impacting market growth
  • Segment-wise, Country-wise, and Region-wise Analysis
  • Competition Mapping and Benchmarking
  • Brand share and Market Share Analysis
  • Key Product Innovations and Regulatory Climate
  • COVID-19 Impact on Global Floral Extract Market and How to Navigate
  • Recommendation on Key Winning Strategies
Sneha Verghese
Sneha Verghese

Principal Consultant

Talk to Analyst

Find your sweet spots for generating winning opportunities in this market.

2014 to 2021 Global Floral Extract Market Outlook Compared to 2022 to 2029 Forecast

The growing popularity of natural products, as well as their increased use in various types of cosmetic formulations such as hair care, facial treatment, and perfumes, resulted in the growth of the market for floral extract products. Furthermore, factors such as changing lifestyle, consumption pattern, and rising demand for organic cosmetics as people have become more environmentally conscious has led to an increase in the number of manufacturers using plant extracts, including flower extract ingredients, in cosmetic formulations such as facial creams and body lotions, propelling market growth in the coming years.

An Emergence of Socially- Conscious Consumer to Boost Market Growth

A new global trend has emerged recently: the emergence of socially conscious consumers. Consumers' purchasing criteria have shifted as a result of this phenomenon. Consumer demand for natural or organic products is increasing as a result of increased awareness, putting pressure on manufacturers to produce natural ingredients mixed or organic products.

Rising health & environmental concerns also generate demands for such cosmetic products which are eco-friendly in ways. Global socially conscious consumers want to purchase such products which are good for them as well as for the planet. In this way, floral extract products which are completely natural and/or organic, are healthy and do not harm society. Thus, growing demand for natural products from floral extract market, the especially essential oil has been observed in the floral extract market.

Get the data you need at a Fraction of the cost

Personalize your report by choosing insights you need
and save 40%!

Country-wise Insights

How is the Growing Popularity of the Vegan Population Driving Product Sales in the USA?

The USA is considered a lucrative market for floral extract and is expected to register a significant CAGR of 3.4%. The increased demand for floral extracts in the United States of America is highly influenced by the growing vegan population and rising focus on organic and natural ingredients products which have transformed almost every aspect of the beauty industry.

Further, with a strong desire for cosmetics to be cruelty-free, many brands are focusing on bringing vegan perfumes and personal care products devoid of animal-based ingredients into the markets, thereby potentially raising the demand for plant-based products such as floral extracts

How is the Floral Extract Market Faring in India?

The Indian market is expected to rise at an impressive growth rate. The market is driven by the Ever-expanding beauty and fragrance industry in the Indian market, on the account of unprecedented urbanization, increased incomes, sprung in the number of working women, and the growing importance of men's grooming products will signify ample growth opportunities for the stakeholders.

Why is the Demand for Floral Extracts Increasing in Germany?

Europe is expected to remain one of the key markets. Accounting for a majority of the market share, Germany held the largest market share in 2021 in Europe. Germany offers greater opportunities for floral extract manufacturers, due to the emergence of a large number of beauty brands focusing entirely on natural and organic ingredients.

Further, as the cosmetics and personal care industry is taking to a whole new level through ‘personalized’ products, floral extract manufacturers are likely to witness a period of sustained demand.

Category-wise Insights

Why is the Demand for Essential Oil Greater than Other Segments?

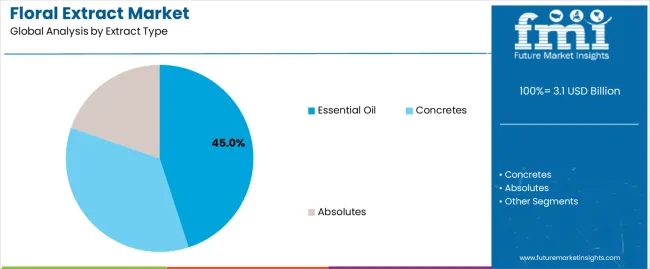
In terms of extract type, the essential oil segment dominated the market with the highest share in 2021. Essential oils have been increasingly gaining prominence in both developed and developing countries, and the result is likely to lead to increased demand for floral extracts. In an attempt to maintain a healthy lifestyle, today’s consumers are turning to products and practices that not only enhance their physical appearance but also help improve health and wellness.

Why is Demand for Natural Cosmetic Rising?

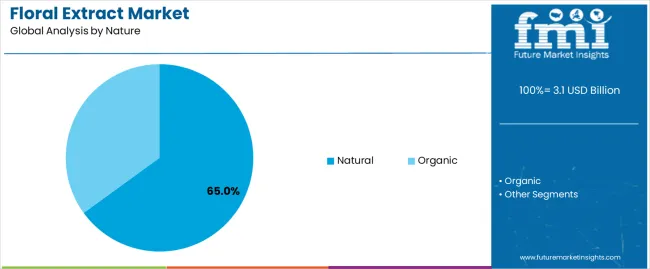
In terms of nature, the natural segment dominated the market with the highest share in 2021. The natural ingredient market is growing due to its beneficial properties such as anti-wrinkle agents, lightening/whitening agents, healing agents, etc. Healthy living is considered the current trend in the natural cosmetics market that drives the demand for ingredients coming from the floral extract market, which is further propelling the category forward in the global market.

Which Source of Floral Extraction is Key to Sales?

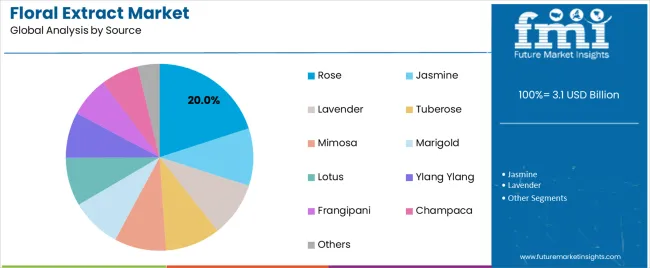
In the global floral extract market, the demand for roses is increasing in the skincare industry due to its benefits in its anti-inflammatory and antioxidant properties. Rose is high in vitamins and minerals, and its oil is excellent for treating dry skin. It also has astringent properties, making it a powerful anti-acne, anti-redness, and anti-inflammatory agent. These are a few of the factors that have facilitated growth in the adoption of rose-based floral extracts in the market.

Which Method of Extraction Holds a Major Revenue Share?

On the basis of the method, the distillation method accounted for a significant share in 2021. The distillation method is the most used technique for the floral extract market across the world. Steam distillation is widely used for essential oil extraction and is very popular in the floral extract market. However, some flowers are too delicate for the distillation process. In that case, another popular method which is known as solvent extraction is used in the floral extract industry.
How is Fragrance Applications Aiding Demand?

Based on application, the market is bifurcated into skincare, haircare, make-up, body care & toiletries, and fragrances. The fragrance segment accounted for the highest market share in the floral extract market.

The demand for floral extract fragrances is continuously increasing strongly based on the health benefits and long-lasting fragrances offered by them over synthetic fragrances. Also, some floral extracted fragrances have strong demand and healthy adoption in the premium range of perfumes. This drives the market for floral extracts.

Competitive Landscape

Leading players operating globally in the market are focusing on expansion, development, and new product launches in order to expand their business globally.

For instance:

  • In Dec 2021, Firmenich, announced Pure Imagination, a new collection of fragrances inspired by Pantone® Color of the Year 2022, PANTONE.

Scope of Report

Attribute Details
Forecast Period 2022 to 2029
Historical Data Available for 2014 to 2021
Market Analysis USD Million for Value
Key Regions Covered North America, Latin America, Europe, East Asia, South Asia, Oceania & Middle East and Africa(MEA)
Key Countries Covered USA, Canada, Brazil, Mexico, Germany, United Kingdom, France, Spain, Italy, Russia, Benelux, South Africa, Northern Africa GCC Countries, China, Japan, South Korea, India, Thailand, Malaysia, Indonesia, Australia & New Zealand.
Key Segments Covered Extracts Type, Nature, Source, Method, Application, and Region.
Key Companies Profiled
  • Carrubba Incorporated
  • Firmenich SA
  • Givaudan
  • Hddes Group
  • Herbarom
  • International Flavors & Fragrances Inc.
  • Kalishankar Export
  • Kancor Ingredients Limited
  • Katyani Exports
  • Lebermuth
  • Mane SA
  • Nateva Sas
  • Nesso-Natural & Essential Oils Pvt. Ltd.
  • Plantex
  • Robertet
  • Star Kay White, Inc.
  • Symrise
  • Synthite Industries Pvt. Ltd.
  • Takasago
  • Uchiya Essential Oils
Report Coverage Market Forecast, Company Share Analysis, Competition Intelligence, Drivers, Restraints, Opportunities and Threats Analysis, Market Dynamics and Challenges, and Strategic Growth Initiatives
Customization & Pricing Available upon Request

Global Floral Extract Market by Category

By Extracts:

  • Concretes
  • Absolutes
  • Essential Oil

By Nature:

  • Organic
  • Natural

By Source:

  • Jasmine
  • Rose
  • Lavender
  • Tuberose
  • Mimosa
  • Marigold
  • Lotus
  • Ylang Ylang
  • Frangipani
  • Chmapaca
  • Others

By Method:

  • Solvent Extraction
  • Distillation
  • Expression (Cold Pressed)
  • Supercritical Fluid Extraction

By Application:

  • Skincare
    • Creams, Lotion
    • Facial Cleansers & Toner
    • Serum
    • Sunscreen
    • Facepacks/Masks
    • Anti-Ageing & Anti-Pollution Products
  • Haircare
    • Shampoos & Shower Gel
    • Conditioner & Serum
    • Hair Rinses
    • Hair Color & Dye
    • Hair Oil & Tonics
  • Makeup
    • Facial Products
    • Eye Products
    • Lip Products
    • Nail Products
  • Body Care & Toiletries
    • Soap
    • Body Wash
    • Massage & Bath Oil
  • Fragrances
    • Perfumes
    • Deodorants
    • Colognes

By Region:

  • North America
  • Latin America
  • Europe
  • East Asia
  • South Asia
  • Oceania
  • Middle East and Africa(MEA)

Frequently Asked Questions

What is the current Floral Extract market value?

The global floral extract market reached a valuation of US$ 2.4 Bn in 2020.

At what rate did the global Floral Extract market grow between 2014 and 2021?

The global floral extract market grew at a sluggish 4.3% CAGR between 2014 and 2021.

Who are the leading players in the global floral extract market?

Leading players operating in the global floral extract market are Vidya Herbs Private Ltd., Nutra Green Biotechnology Co. Ltd., Kalsec Inc., Martin Bauer Group, Kangcare Bioindustry Co. Ltd.

What will be the demand outlook for North America floral extract market?

The North America floral extract market is projected to grow at a 3.3% CAGR over the forecast period.

What is the market share of the leading players operating in the floral extract market?

Leading players in the global floral extract market are estimated to account for approximately ~10%-15% of the total market share.

What is the floral extract demand outlook for Europe?

The Europe Floral Extract market is anticipated to expand at 3.3% CAGR over the forecast period.

Table of Content

1. Executive Summary | Floral Extract Market

    1.1. Global Market Outlook

    1.2. Summary of Key Statistics

    1.3. Summary of Key Findings

    1.4. Extracts Evolution Analysis

    1.5. FMI Analysis and Recommendations

2. Market Overview

    2.1. Market Taxonomy

    2.2. Market Definition

3. Key Market Trends

    3.1. Key Trends Impacting the Market

        3.1.1. Growing Trend of Cut Flowers Globally

        3.1.2. Top Countries To Produce Floral Extracts

        3.1.3. Most Preferred Method For Floral Extraction Among Manufacturers

        3.1.4. Global essential oil Extraction outlook

        3.1.5. Others

4. Impact of Covid-19 on the Market

    4.1. Impact of Covid-19 on Industry

    4.2. Sales Projection, Q1-Q4 2020 During Covid-19 Pandemic

    4.3. Pre Covid-19 Market Forecast v/s Post covid-19 Market Forecast

5. Covid-19 Impact on Retail Industry

    5.1. Coronavirus Impact Matrix

    5.2. Sales Increased Dramatically Across Most Categories; Paper Extracts, Home Care, and Frozen Foods Spiked in all Countries

    5.3. Consumers Impact - Winning and Losing Segment Spending

    5.4. Consumers Shifting Toward Spending Online Shopping

    5.5. Consumer Sentiment Reflects Fear of the Virus and of Recession

6. Global Market Outlook 

    6.1. Outlook - A Plant Extraction Type Material

    6.2. Key Success Factors for Adoption of Into Cosmetics & Personal Care Industries

    6.3. Companies' Latest Offerings

    6.4. Extraction Process & Methods for Floral Extraction

        6.4.1. Solvent Extraction

        6.4.2. Distillation

        6.4.3. Expression (Cold Pressed)

        6.4.4. Supercritical Fluid Extraction

    6.5. Usage Analysis of Floral Extracts In the Cosmetics & Personal Care Industry?

        6.5.1. Concrete

        6.5.2. Absolute

        6.5.3. Essential Oil

    6.6. Technology/ Development Roadmap of the Market

    6.7. Top Flowers Used for Floral Extraction Analysis

    6.8. Demand & Supply Analysis of the Floriculture Industry

    6.9. Global Sourcing Pattern of Flowers

    6.10. Current Scenario of Market

    6.11. Challenges in Market

    6.12. Government Rules & Regulation, Norms for Floral Extraction

    6.13. Certification Required for Extraction Companies

7. Global Floriculture Market Outlook

    7.1. Understanding Floriculture Market

        7.1.1. Cut Flowers Market Analysis

        7.1.2. Market Extraction & Trade Analysis

    7.2. Latest Trend In Floriculture Industry

    7.3. Top Markets for Cut Flowers

8. Global Market Demand Analysis 2014 to 2021 and Forecast, 2022 to 2029

    8.1. Historical Market Volume (Tons) Analysis, 2014 to 2021

    8.2. Current and Future Market Volume (Tons) Projections, 2022 to 2029

    8.3. Y-o-Y Growth Trend Analysis

9. Global Market- Pricing Analysis

    9.1. Regional Pricing Analysis By Extracts Type

    9.2. Pricing Break-up

        9.2.1. Manufacturer-Level Pricing

        9.2.2. Distributor Level Pricing

10. Global Market Demand (in Value or Size in US$ Million) Analysis 2014 to 2021 and Forecast, 2022 to 2029

    10.1. Historical Market Value (US$ Million) Analysis, 2014 to 2021

    10.2. Current and Future Market Value (US$ Million) Projections, 2022 to 2029

        10.2.1. Y-o-Y Growth Trend Analysis

        10.2.2. Absolute $ Opportunity Analysis

11. Market Background

    11.1. Macro-Economic Factors

        11.1.1. Global GDP Growth Outlook

        11.1.2. Industrial Extraction Outlook

        11.1.3. Global Trade Scenario of Floriculture

        11.1.4. Global Extraction of Flowers

        11.1.5. Natural Ingredient Extract Market contribution to Beauty & Personal Care Industry

        11.1.6. Flavour & Fragrance Industry Outlook

        11.1.7. and Government Policy

        11.1.8. GVA Growth for Cosmetic Extracts

    11.2. Forecast Factors - Relevance & Impact

        11.2.1. Natural Ingredient Market Demand Analysis

        11.2.2. Regional Cosmetic Demand Outlook

        11.2.3. Global Floriculture Market Analysis

        11.2.4. Beauty & Personal Care Industry Growth

        11.2.5. Cosmetic Ingredient Market Outlook

        11.2.6. Global Organic Ingredients Market Analysis

        11.2.7. Others

    11.3. PESTLE Analysis of Global Market

    11.4. Porter’s Five Forces Analysis of the Global Market

    11.5. Market Dynamics

        11.5.1. Drivers

        11.5.2. Restraints

        11.5.3. Opportunity Analysis

12. Global Market Analysis 2014 to 2021 and Forecast 2022 to 2029, by Extracts Type 

    12.1. Introduction / Key Findings

    12.2. Historical Market Size (US$ Million) and Volume (Million Tons) Analysis By Extracts Type, 2014 to 2021

    12.3. Current and Future Market Size (US$ Million) and Volume (Million Tons) Analysis and Forecast By Extracts Type, 2022 to 2029

        12.3.1. Concrete

        12.3.2. Absolute

        12.3.3. Essential Oil

    12.4. Market Attractiveness Analysis By Extracts Type

13. Global Market Analysis 2014 to 2021 and Forecast 2022 to 2029, by Nature

    13.1. Introduction / Key Findings

    13.2. Historical Market Size (US$ Million) and Volume (Million Tons) Analysis By Nature, 2014 to 2021

    13.3. Current and Future Market Size (US$ Million) and Volume (Million Tons) Analysis and Forecast By Nature, 2022 to 2029

        13.3.1. Organic

        13.3.2. Natural

    13.4. Market Attractiveness Analysis By Nature

14. Global Market Analysis 2014 to 2021 and Forecast 2022 to 2029, by Source

    14.1. Introduction / Key Findings

    14.2. Historical Market Size (US$ Million) and Volume (Million Tons) Analysis By Source, 2014 to 2021

    14.3. Current and Future Market Size (US$ Million) and Volume (Million Tons) Analysis and Forecast By Source, 2022 to 2029

        14.3.1. Jasmine

        14.3.2. Rose

        14.3.3. Lavender

        14.3.4. Tuberose

        14.3.5. Mimosa

        14.3.6. Marigold

        14.3.7. Lotus

        14.3.8. Ylang Ylang

        14.3.9. Frangipani

        14.3.10. Chmapaca

        14.3.11. Others

    14.4. Market Attractiveness Analysis By Source

15. Global Market Analysis 2014 to 2021 and Forecast 2022 to 2029, by Method

    15.1. Introduction / Key Findings

    15.2. Historical Market Size (US$ Million) and Volume (Million Tons) Analysis By Method, 2014 to 2021

    15.3. Current and Future Market Size (US$ Million) and Volume (Million Tons) Analysis and Forecast By Method, 2022 to 2029

        15.3.1. Solvent Extraction

        15.3.2. Distillation

        15.3.3. Enfleurage

        15.3.4. Others

    15.4. Market Attractiveness Analysis By Method

16. Global Market Analysis 2014 to 2021 and Forecast 2022 to 2029, by Application

    16.1. Introduction / Key Findings

    16.2. Historical Market Size (US$ Million) and Volume (Million Tons) Analysis By Application, 2014 to 2021

    16.3. Current and Future Market Size (US$ Million) and Volume (Million Tons) Analysis and Forecast By Application, 2022 to 2029

        16.3.1. Skincare

            16.3.1.1. Creams, Lotion

            16.3.1.2. Facial Cleansers & Toner

            16.3.1.3. Serum

            16.3.1.4. Sunscreen

            16.3.1.5. Facepacks/Masks

            16.3.1.6. Anti-Ageing & Anti-Pollution Products

        16.3.2. Haircare

            16.3.2.1. Shampoos & Shower Gel

            16.3.2.2. Conditioner & Serum

            16.3.2.3. Hair Rinses

            16.3.2.4. Hair Color & Dye

            16.3.2.5. Hair Oil & Tonics

        16.3.3. Makeup

            16.3.3.1. Facial Products

            16.3.3.2. Eye Products

            16.3.3.3. Lip Products

            16.3.3.4. Nail Products

        16.3.4. Body Care & Toiletries

            16.3.4.1. Soap

            16.3.4.2. Body Wash

            16.3.4.3. Massage & Bath Oil

        16.3.5. Fragrances

            16.3.5.1. Perfumes

            16.3.5.2. Deodorants

            16.3.5.3. Colognes

    16.4. Market Attractiveness Analysis By Application

17. Global Market Analysis 2014 to 2021 and Forecast 2022 to 2029, by Region

    17.1. Introduction

    17.2. Historical Market Size (US$ Million) and Volume (Tons) Analysis By Region, 2014 to 2021

    17.3. Current Market Size (US$ Million) and Volume (Tons) Analysis and Forecast By Region, 2022 to 2029

        17.3.1. North America

        17.3.2. Latin America

        17.3.3. Europe

        17.3.4. East Asia

        17.3.5. South Asia

        17.3.6. Oceania

        17.3.7. Middle East and Africa(MEA)

    17.4. Market Attractiveness Analysis By Region

18. North America Market Analysis 2014 to 2021 and Forecast 2022 to 2029

    18.1. Introduction

    18.2. Pricing Analysis

    18.3. Historical Market Size (US$ Million) and Volume Trend (Tons) Analysis By Market Taxonomy, 2014 to 2021

    18.4. Market Size (US$ Million) and Volume (Tons) Forecast By Market Taxonomy, 2022 to 2029

        18.4.1. By Country

            18.4.1.1. USA

            18.4.1.2. Canada

        18.4.2. By Extracts Type

        18.4.3. By Nature

        18.4.4. By Source

        18.4.5. By Method

        18.4.6. By Application

    18.5. Market Attractiveness Analysis

        18.5.1. By Extracts Type

        18.5.2. By Nature

        18.5.3. By Source

        18.5.4. By Method

        18.5.5. By Application

19. By Sales Channel Latin America Market Analysis 2014 to 2021 and Forecast 2022 to 2029

    19.1. Introduction

    19.2. Pricing Analysis

    19.3. Historical Market Size (US$ Million) and Volume Trend (Tons) Analysis By Market Taxonomy, 2014 to 2021

    19.4. Market Size (US$ Million) and Volume (Tons) Forecast By Market Taxonomy, 2022 to 2029

        19.4.1. By Country

            19.4.1.1. Mexico

            19.4.1.2. Brazil

            19.4.1.3. Rest of Latin America

        19.4.2. By Extracts Type

        19.4.3. By Nature

        19.4.4. By Source

        19.4.5. By Method

        19.4.6. By Application

    19.5. Market Attractiveness Analysis

        19.5.1. By Country

        19.5.2. By Extracts Type

        19.5.3. By Nature

        19.5.4. By Source

        19.5.5. By Method

        19.5.6. By Application

20. Europe Market Analysis 2014 to 2021 and Forecast 2022 to 2029

    20.1. Introduction

    20.2. Pricing Analysis

    20.3. Historical Market Size (US$ Million) and Volume Trend (Tons) Analysis By Market Taxonomy, 2014 to 2021

    20.4. Market Size (US$ Million) and Volume (Tons) Forecast By Market Taxonomy, 2022 to 2029

        20.4.1. By Country

            20.4.1.1. Germany

            20.4.1.2. Italy

            20.4.1.3. France

            20.4.1.4. United Kingdom

            20.4.1.5. Spain

            20.4.1.6. Benelux

            20.4.1.7. Russia

            20.4.1.8. Rest of Europe

        20.4.2. By Extracts Type

        20.4.3. By Nature

        20.4.4. By Source

        20.4.5. By Method

        20.4.6. By Application

    20.5. Market Attractiveness Analysis

        20.5.1. By Extracts Type

        20.5.2. By Nature

        20.5.3. By Source

        20.5.4. By Method

        20.5.5. By Application

21. East Asia Market Analysis 2014 to 2021 and Forecast 2022 to 2029

    21.1. Introduction

    21.2. Pricing Analysis

    21.3. Historical Market Size (US$ Million) and Volume Trend (Tons) Analysis By Market Taxonomy, 2014 to 2021

    21.4. Market Size (US$ Million) and Volume (Tons) Forecast By Market Taxonomy, 2022 to 2029

        21.4.1. By Country

            21.4.1.1. China

            21.4.1.2. Japan

            21.4.1.3. South Korea

        21.4.2. By Extracts Type

        21.4.3. By Nature

        21.4.4. By Source

        21.4.5. By Method

        21.4.6. By Application

    21.5. Market Attractiveness Analysis

        21.5.1. By Country

        21.5.2. By Extracts Type

        21.5.3. By Nature

        21.5.4. By Source

        21.5.5. By Method

        21.5.6. By Application

22. South Asia Market Analysis 2014 to 2021 and Forecast 2022 to 2029

    22.1. Introduction

    22.2. Pricing Analysis

    22.3. Historical Market Size (US$ Million) and Volume Trend (Tons) Analysis By Market Taxonomy, 2014 to 2021

    22.4. Market Size (US$ Million) and Volume (Tons) Forecast By Market Taxonomy, 2022 to 2029

        22.4.1. By Country

            22.4.1.1. India

            22.4.1.2. Thailand

            22.4.1.3. Indonesia

            22.4.1.4. Malaysia

            22.4.1.5. Rest of South Asia

        22.4.2. By Extracts Type

        22.4.3. By Nature

        22.4.4. By Source

        22.4.5. By Method

        22.4.6. By Application

    22.5. Market Attractiveness Analysis

        22.5.1. By Country

        22.5.2. By Extracts Type

        22.5.3. By Nature

        22.5.4. By Source

        22.5.5. By Method

        22.5.6. By Application

23. Oceania Market Analysis 2014 to 2021 and Forecast 2022 to 2029

    23.1. Introduction

    23.2. Pricing Analysis

    23.3. Historical Market Size (US$ Million) and Volume Trend (Tons) Analysis By Market Taxonomy, 2014 to 2021

    23.4. Market Size (US$ Million) and Volume (Tons) Forecast By Market Taxonomy, 2022 to 2029

        23.4.1. By Country

            23.4.1.1. Australia

            23.4.1.2. New Zealand

        23.4.2. By Extracts Type

        23.4.3. By Nature

        23.4.4. By Source

        23.4.5. By Method

        23.4.6. By Application

    23.5. Market Attractiveness Analysis

        23.5.1. By Country

        23.5.2. By Extracts Type

        23.5.3. By Nature

        23.5.4. By Source

        23.5.5. By Method

        23.5.6. By Application

24. Middle East & Africa Market Analysis 2014 to 2021 and Forecast 2022 to 2029

    24.1. Introduction

    24.2. Pricing Analysis

    24.3. Historical Market Size (US$ Million) and Volume Trend (Tons) Analysis By Market Taxonomy, 2014 to 2021

    24.4. Market Size (US$ Million) and Volume (Tons) Forecast By Market Taxonomy, 2022 to 2029

        24.4.1. By Country

            24.4.1.1. GCC Countries

            24.4.1.2. Turkey

            24.4.1.3. Northern Africa

            24.4.1.4. South Africa

            24.4.1.5. Rest of Middle East and Africa(MEA)

        24.4.2. By Extracts Type

        24.4.3. By Nature

        24.4.4. By Source

        24.4.5. By Method

        24.4.6. By Application

    24.5. Market Attractiveness Analysis

        24.5.1. By Country

        24.5.2. By Extracts Type

        24.5.3. By Nature

        24.5.4. By Source

        24.5.5. By Method

        24.5.6. By Application

25. Market Structure Analysis

    25.1. Market Analysis by Tier of Companies

    25.2. Market Concentration

    25.3. Market Share Analysis of Top Players

    25.4. Market Presence Analysis

        25.4.1. By Regional footprint of Players

        25.4.2. Extracts foot print by Players

        25.4.3. Channel Foot Print by Players

26. Competition Analysis

    26.1. Competition Dashboard

    26.2. Pricing Analysis by Competition

    26.3. Competition Benchmarking

    26.4. Competition Deep Dive

        26.4.1. Carrubba Incorporated

            26.4.1.1. Overview

            26.4.1.2. Extracts Portfolio

            26.4.1.3. Profitability by Market Segments (Extracts/Channel/Region)

            26.4.1.4. Sales Footprint

            26.4.1.5. Strategy Overview

                26.4.1.5.1. Marketing Strategy

                26.4.1.5.2. Extracts Strategy

                26.4.1.5.3. Channel Strategy

        26.4.2. Firmenich SA

            26.4.2.1. Overview

            26.4.2.2. Extracts Portfolio

            26.4.2.3. Profitability by Market Segments (Extracts/Channel/Region)

            26.4.2.4. Sales Footprint

            26.4.2.5. Strategy Overview

                26.4.2.5.1. Marketing Strategy

                26.4.2.5.2. Extracts Strategy

                26.4.2.5.3. Channel Strategy

        26.4.3. Givaudan

            26.4.3.1. Overview

            26.4.3.2. Extracts Portfolio

            26.4.3.3. Profitability by Market Segments (Extracts/Channel/Region)

            26.4.3.4. Sales Footprint

            26.4.3.5. Strategy Overview

                26.4.3.5.1. Marketing Strategy

                26.4.3.5.2. Extracts Strategy

                26.4.3.5.3. Channel Strategy

        26.4.4. Hddes Group

            26.4.4.1. Overview

            26.4.4.2. Extracts Portfolio

            26.4.4.3. Profitability by Market Segments (Extracts/Channel/Region)

            26.4.4.4. Sales Footprint

            26.4.4.5. Strategy Overview

                26.4.4.5.1. Marketing Strategy

                26.4.4.5.2. Extracts Strategy

                26.4.4.5.3. Channel Strategy

        26.4.5. Herbarom

            26.4.5.1. Overview

            26.4.5.2. Extracts Portfolio

            26.4.5.3. Profitability by Market Segments (Extracts/Channel/Region)

            26.4.5.4. Sales Footprint

            26.4.5.5. Strategy Overview

                26.4.5.5.1. Marketing Strategy

                26.4.5.5.2. Extracts Strategy

                26.4.5.5.3. Channel Strategy

        26.4.6. International Flavors & Fragrances Inc.

            26.4.6.1. Overview

            26.4.6.2. Extracts Portfolio

            26.4.6.3. Profitability by Market Segments (Extracts/Channel/Region)

            26.4.6.4. Sales Footprint

            26.4.6.5. Strategy Overview

                26.4.6.5.1. Marketing Strategy

                26.4.6.5.2. Extracts Strategy

                26.4.6.5.3. Channel Strategy

        26.4.7. Kalishankar Export

            26.4.7.1. Overview

            26.4.7.2. Extracts Portfolio

            26.4.7.3. Profitability by Market Segments (Extracts/Channel/Region)

            26.4.7.4. Sales Footprint

            26.4.7.5. Strategy Overview

                26.4.7.5.1. Marketing Strategy

                26.4.7.5.2. Extracts Strategy

                26.4.7.5.3. Channel Strategy

        26.4.8. Kancor Ingredients Limited

            26.4.8.1. Overview

            26.4.8.2. Extracts Portfolio

            26.4.8.3. Profitability by Market Segments (Extracts/Channel/Region)

            26.4.8.4. Sales Footprint

            26.4.8.5. Strategy Overview

                26.4.8.5.1. Marketing Strategy

                26.4.8.5.2. Extracts Strategy

                26.4.8.5.3. Channel Strategy

        26.4.9. Katyani Exports

            26.4.9.1. Overview

            26.4.9.2. Extracts Portfolio

            26.4.9.3. Profitability by Market Segments (Extracts/Channel/Region)

            26.4.9.4. Sales Footprint

            26.4.9.5. Strategy Overview

                26.4.9.5.1. Marketing Strategy

                26.4.9.5.2. Extracts Strategy

                26.4.9.5.3. Channel Strategy

        26.4.10. Lebermuth

            26.4.10.1. Overview

            26.4.10.2. Extracts Portfolio

            26.4.10.3. Profitability by Market Segments (Extracts/Channel/Region)

            26.4.10.4. Sales Footprint

            26.4.10.5. Strategy Overview

                26.4.10.5.1. Marketing Strategy

                26.4.10.5.2. Extracts Strategy

                26.4.10.5.3. Channel Strategy

        26.4.11. Mane SA

            26.4.11.1. Overview

            26.4.11.2. Extracts Portfolio

            26.4.11.3. Profitability by Market Segments (Extracts/Channel/Region)

            26.4.11.4. Sales Footprint

            26.4.11.5. Strategy Overview

                26.4.11.5.1. Marketing Strategy

                26.4.11.5.2. Extracts Strategy

                26.4.11.5.3. Channel Strategy

        26.4.12. Nateva Sas

            26.4.12.1. Overview

            26.4.12.2. Extracts Portfolio

            26.4.12.3. Profitability by Market Segments (Extracts/Channel/Region)

            26.4.12.4. Sales Footprint

            26.4.12.5. Strategy Overview

                26.4.12.5.1. Marketing Strategy

                26.4.12.5.2. Extracts Strategy

                26.4.12.5.3. Channel Strategy

        26.4.13. Nesso-Natural & Essential Oils Pvt. Ltd.

            26.4.13.1. Overview

            26.4.13.2. Extracts Portfolio

            26.4.13.3. Profitability by Market Segments (Extracts/Channel/Region)

            26.4.13.4. Sales Footprint

            26.4.13.5. Strategy Overview

                26.4.13.5.1. Marketing Strategy

                26.4.13.5.2. Extracts Strategy

                26.4.13.5.3. Channel Strategy

        26.4.14. Plantex

            26.4.14.1. Overview

            26.4.14.2. Extracts Portfolio

            26.4.14.3. Profitability by Market Segments (Extracts/Channel/Region)

            26.4.14.4. Sales Footprint

            26.4.14.5. Strategy Overview

                26.4.14.5.1. Marketing Strategy

                26.4.14.5.2. Extracts Strategy

                26.4.14.5.3. Channel Strategy

        26.4.15. Robertet

            26.4.15.1. Overview

            26.4.15.2. Extracts Portfolio

            26.4.15.3. Profitability by Market Segments (Extracts/Channel/Region)

            26.4.15.4. Sales Footprint

            26.4.15.5. Strategy Overview

                26.4.15.5.1. Marketing Strategy

                26.4.15.5.2. Extracts Strategy

                26.4.15.5.3. Channel Strategy

        26.4.16. Star Kay White, Inc.

            26.4.16.1. Overview

            26.4.16.2. Extracts Portfolio

            26.4.16.3. Profitability by Market Segments (Extracts/Channel/Region)

            26.4.16.4. Sales Footprint

            26.4.16.5. Strategy Overview

                26.4.16.5.1. Marketing Strategy

                26.4.16.5.2. Extracts Strategy

                26.4.16.5.3. Channel Strategy

        26.4.17. Symrise

            26.4.17.1. Overview

            26.4.17.2. Extracts Portfolio

            26.4.17.3. Profitability by Market Segments (Extracts/Channel/Region)

            26.4.17.4. Sales Footprint

            26.4.17.5. Strategy Overview

                26.4.17.5.1. Marketing Strategy

                26.4.17.5.2. Extracts Strategy

                26.4.17.5.3. Channel Strategy

        26.4.18. Synthite Industries Pvt. Ltd.

            26.4.18.1. Overview

            26.4.18.2. Extracts Portfolio

            26.4.18.3. Profitability by Market Segments (Extracts/Channel/Region)

            26.4.18.4. Sales Footprint

            26.4.18.5. Strategy Overview

                26.4.18.5.1. Marketing Strategy

                26.4.18.5.2. Extracts Strategy

                26.4.18.5.3. Channel Strategy

        26.4.19. Takasago

            26.4.19.1. Overview

            26.4.19.2. Extracts Portfolio

            26.4.19.3. Profitability by Market Segments (Extracts/Channel/Region)

            26.4.19.4. Sales Footprint

            26.4.19.5. Strategy Overview

                26.4.19.5.1. Marketing Strategy

                26.4.19.5.2. Extracts Strategy

                26.4.19.5.3. Channel Strategy

        26.4.20. Uchiya Essential Oils

            26.4.20.1. Overview

            26.4.20.2. Extracts Portfolio

            26.4.20.3. Profitability by Market Segments (Extracts/Channel/Region)

            26.4.20.4. Sales Footprint

            26.4.20.5. Strategy Overview

                26.4.20.5.1. Marketing Strategy

                26.4.20.5.2. Extracts Strategy

                26.4.20.5.3. Channel Strategy

27. Assumptions and Acronyms Used

28. Research Methodology

Don't pay for what you don't need

Customize your report by selecting specific countries or regions and save 30%!

List of Tables

Table 1: Global Market Value (US$ Million) Forecast, By Extracts Type, 2014 to 2029

Table 2: Global Market Volume (Tons) Forecast, By Extracts Type, 2014 to 2029

Table 3: Global Market Value (US$ Million) Forecast, By Nature, 2014 to 2029

Table 4: Global Market Volume (Tons) Forecast, By Nature, 2014 to 2029

Table 5: Global Market Value (US$ Million) Forecast, By Source, 2014 to 2029

Table 6: Global Market Volume (Tons) Forecast, By Source, 2014 to 2029

Table 7: Global Market Value (US$ Million) Forecast, By Method, 2014 to 2029

Table 8: Global Market Volume (Tons) Forecast, By Method, 2014 to 2029

Table 9: Global Market Value (US$ Million) Forecast, By Application, 2014 to 2029

Table 10: Global Market Volume (Tons) Forecast, By Application, 2014 to 2029

Table 11: Global Market Value (US$ Million) Forecast, By Region, 2014 to 2029

Table 12: Global Market Volume (Tons) Forecast, By Region, 2014 to 2029

Table 13: North America Market Value (US$ Million) Forecast, By Extracts Type, 2014 to 2029

Table 14: North America Market Volume (Tons) Forecast, By Extracts Type, 2014 to 2029

Table 15: North America Market Value (US$ Million) Forecast, By Nature, 2014 to 2029

Table 16: North America Market Volume (Tons) Forecast, By Nature, 2014 to 2029

Table 17: North America Market Value (US$ Million) Forecast, By Source, 2014 to 2029

Table 18: North America Market Volume (Tons) Forecast, By Source, 2014 to 2029

Table 19: North America Market Value (US$ Million) Forecast, By Method, 2014 to 2029

Table 20: North America Market Volume (Tons) Forecast, By Method, 2014 to 2029

Table 21: North America Market Value (US$ Million) Forecast, By Application, 2014 to 2029

Table 22: North America Market Volume (Tons) Forecast, By Application, 2014 to 2029

Table 23: North America Market Value (US$ Million) Forecast, By Country, 2014 to 2029

Table 24: North America Market Volume (Tons) Forecast, By Country, 2014 to 2029

Table 25: Latin America Market Value (US$ Million) Forecast, By Extracts Type, 2014 to 2029

Table 26: Latin America Market Volume (Tons) Forecast, By Extracts Type, 2014 to 2029

Table 27: Latin America Market Value (US$ Million) Forecast, By Nature, 2014 to 2029

Table 28: Latin America Market Volume (Tons) Forecast, By Nature, 2014 to 2029

Table 29: Latin America Market Value (US$ Million) Forecast, By Source, 2014 to 2029

Table 30: Latin America Market Volume (Tons) Forecast, By Source, 2014 to 2029

Table 31: Latin America Market Value (US$ Million) Forecast, By Method, 2014 to 2029

Table 32: Latin America Market Volume (Tons) Forecast, By Method, 2014 to 2029

Table 33: Latin America Market Value (US$ Million) Forecast, By Application, 2014 to 2029

Table 34: Latin America Market Volume (Tons) Forecast, By Application, 2014 to 2029

Table 35: Latin America Market Value (US$ Million) Forecast, By Country, 2014 to 2029

Table 36: Latin America Market Volume (Tons) Forecast, By Country, 2014 to 2029

Table 37: Europe Market Value (US$ Million) Forecast, By Extracts Type, 2014 to 2029

Table 38: Europe Market Volume (Tons) Forecast, By Extracts Type, 2014 to 2029

Table 39: Europe Market Value (US$ Million) Forecast, By Nature, 2014 to 2029

Table 40: Europe Market Volume (Tons) Forecast, By Nature, 2014 to 2029

Table 41: Europe Market Value (US$ Million) Forecast, By Source, 2014 to 2029

Table 42: Europe Market Volume (Tons) Forecast, By Source, 2014 to 2029

Table 43: Europe Market Value (US$ Million) Forecast, By Method, 2014 to 2029

Table 44: Europe Market Volume (Tons) Forecast, By Method, 2014 to 2029

Table 45: Europe Market Value (US$ Million) Forecast, By Application, 2014 to 2029

Table 46: Europe Market Volume (Tons) Forecast, By Application, 2014 to 2029

Table 47: Europe Market Value (US$ Million) Forecast, By Country, 2014 to 2029

Table 48: Europe Market Volume (Tons) Forecast, By Country, 2014 to 2029

Table 49: South Asia Market Value (US$ Million) Forecast, By Extracts Type, 2014 to 2029

Table 50: South Asia Market Volume (Tons) Forecast, By Extracts Type, 2014 to 2029

Table 51: South Asia Market Value (US$ Million) Forecast, By Nature, 2014 to 2029

Table 52: South Asia Market Volume (Tons) Forecast, By Nature, 2014 to 2029

Table 53: South Asia Market Value (US$ Million) Forecast, By Source, 2014 to 2029

Table 54: South Asia Market Volume (Tons) Forecast, By Source, 2014 to 2029

Table 55: South Asia Market Value (US$ Million) Forecast, By Method, 2014 to 2029

Table 56: South Asia Market Volume (Tons) Forecast, By Method, 2014 to 2029

Table 57: South Asia Market Value (US$ Million) Forecast, By Application, 2014 to 2029

Table 58: South Asia Market Volume (Tons) Forecast, By Application, 2014 to 2029

Table 59: South Asia Market Value (US$ Million) Forecast, By Country, 2014 to 2029

Table 60: South Asia Market Volume (Tons) Forecast, By Country, 2014 to 2029

Table 61: East Asia Market Value (US$ Million) Forecast, By Extracts Type, 2014 to 2029

Table 62: East Asia Market Volume (Tons) Forecast, By Extracts Type, 2014 to 2029

Table 63: East Asia Market Value (US$ Million) Forecast, By Nature, 2014 to 2029

Table 64: East Asia Market Volume (Tons) Forecast, By Nature, 2014 to 2029

Table 65: East Asia Market Value (US$ Million) Forecast, By Source, 2014 to 2029

Table 66: East Asia Market Volume (Tons) Forecast, By Source, 2014 to 2029

Table 67: East Asia Market Value (US$ Million) Forecast, By Method, 2014 to 2029

Table 68: East Asia Market Volume (Tons) Forecast, By Method, 2014 to 2029

Table 69: East Asia Market Value (US$ Million) Forecast, By Application, 2014 to 2029

Table 70: East Asia Market Volume (Tons) Forecast, By Application, 2014 to 2029

Table 71: East Asia Market Value (US$ Million) Forecast, By Country, 2014 to 2029

Table 72: East Asia Market Volume (Tons) Forecast, By Country, 2014 to 2029

Table 73: Oceania Market Value (US$ Million) Forecast, By Extracts Type, 2014 to 2029

Table 74: Oceania Market Volume (Tons) Forecast, By Extracts Type, 2014 to 2029

Table 75: Oceania Market Value (US$ Million) Forecast, By Nature, 2014 to 2029

Table 76: Oceania Market Volume (Tons) Forecast, By Nature, 2014 to 2029

Table 77: Oceania Market Value (US$ Million) Forecast, By Source, 2014 to 2029

Table 78: Oceania Market Volume (Tons) Forecast, By Source, 2014 to 2029

Table 79: Oceania Market Value (US$ Million) Forecast, By Method, 2014 to 2029

Table 80: Oceania Market Volume (Tons) Forecast, By Method, 2014 to 2029

Table 81: Oceania Market Value (US$ Million) Forecast, By Application, 2014 to 2029

Table 82: Oceania Market Volume (Tons) Forecast, By Application, 2014 to 2029

Table 83: Oceania Market Value (US$ Million) Forecast, By Country, 2014 to 2029

Table 84: Oceania Market Volume (Tons) Forecast, By Country, 2014 to 2029

Table 85: Middle East and Africa Market Value (US$ Million) Forecast, By Extracts Type, 2014 to 2029

Table 86: Middle East and Africa Market Volume (Tons) Forecast, By Extracts Type, 2014 to 2029

Table 87: Middle East and Africa Market Value (US$ Million) Forecast, By Nature, 2014 to 2029

Table 88: Middle East and Africa Market Volume (Tons) Forecast, By Nature, 2014 to 2029

Table 89: Middle East and Africa Market Value (US$ Million) Forecast, By Source, 2014 to 2029

Table 90: Middle East and Africa Market Volume (Tons) Forecast, By Source, 2014 to 2029

Table 91: Middle East and Africa Market Value (US$ Million) Forecast, By Method, 2014 to 2029

Table 92: Middle East and Africa Market Volume (Tons) Forecast, By Method, 2014 to 2029

Table 93: Middle East and Africa Market Value (US$ Million) Forecast, By Application, 2014 to 2029

Table 94: Middle East and Africa Market Volume (Tons) Forecast, By Application, 2014 to 2029

Table 95: Middle East and Africa Market Value (US$ Million) Forecast, By Country, 2014 to 2029
Sneha Verghese
Sneha Verghese

Principal Consultant

Talk to Analyst

Find your sweet spots for generating winning opportunities in this market.

List of Charts

Figure 1: Global Market Value (US$ Million) and Volume (Tons) Analysis, 2014 to 2021

Figure 2: Global Market Value (US$ Million) and Volume (Tons) Forecast, 2022 to 2029

Figure 3: Global Market Analysis, 2014 to 2021

Figure 4: Global Market Forecast, 2022 to 2029

Figure 5: Global Market Absolute $ Opportunity Value (US$ Million), 2022 to 2029

Figure 6: Global Market Value (US$ Million) Analysis, By Extracts Type, 2014 to 2029

Figure 7: Global Market Volume (Tons) Analysis, By Extracts Type, 2014 to 2029

Figure 8: Global Market Share and BPS Analysis, By Extracts Type, 2022 & 2029

Figure 9: Global Market Y-o-Y Growth (%) Projections, By Extracts Type, 2022 to 2029

Figure 10: Global Market Attractiveness, By Extracts Type, 2014 to 2029

Figure 11: Global Market Value (US$ Million) Analysis, By Nature, 2014 to 2029

Figure 12: Global Market Volume (Tons) Analysis, By Nature, 2014 to 2029

Figure 13: Global Market Share and BPS Analysis, By Nature, 2022 & 2029

Figure 14: Global Market Y-o-Y Growth (%) Projections, By Nature, 2022 to 2029

Figure 15: Global Market Attractiveness, By Nature, 2014 to 2029

Figure 16: Global Market Value (US$ Million) Analysis, By Source, 2014 to 2029

Figure 17: Global Market Volume (Tons) Analysis, By Source, 2014 to 2029

Figure 18: Global Market Share and BPS Analysis, By Source, 2022 & 2029

Figure 19: Global Market Y-o-Y Growth (%) Projections, By Source, 2022 to 2029

Figure 20: Global Market Attractiveness, By Source, 2014 to 2029

Figure 21: Global Market Value (US$ Million) Analysis, By Method, 2014 to 2029

Figure 22: Global Market Volume (Tons) Analysis, By Method, 2014 to 2029

Figure 23: Global Market Share and BPS Analysis, By Method, 2022 & 2029

Figure 24: Global Market Y-o-Y Growth (%) Projections, By Method, 2022 to 2029

Figure 25: Global Market Attractiveness, By Method, 2014 to 2029

Figure 26: Global Market Value (US$ Million) Analysis, By Application, 2014 to 2029

Figure 27: Global Market Volume (Tons) Analysis, By Application, 2014 to 2029

Figure 28: Global Market Share and BPS Analysis, By Application, 2022 & 2029

Figure 29: Global Market Y-o-Y Growth (%) Projections, By Application, 2022 to 2029

Figure 30: Global Market Attractiveness, By Application, 2014 to 2029

Figure 31: Global Market Value (US$ Million) Analysis, By Region, 2014 to 2029

Figure 32: Global Market Volume (Tons) Analysis, By Region, 2014 to 2029

Figure 33: Global Market Share and BPS Analysis, By Region, 2022 & 2029

Figure 34: Global Market Y-o-Y Growth (%) Projections, By Region, 2022 to 2029

Figure 35: Global Market Attractiveness, By Region, 2014 to 2029

Figure 36: North America Market Value (US$ Million) Analysis, By Extracts Type, 2014 to 2029

Figure 37: North America Market Volume (Tons) Analysis, By Extracts Type, 2014 to 2029

Figure 38: North America Market Share and BPS Analysis, By Extracts Type, 2022 & 2029

Figure 39: North America Market Y-o-Y Growth (%) Projections, By Extracts Type, 2022 to 2029

Figure 40: North America Market Attractiveness, By Extracts Type, 2014 to 2029

Figure 41: North America Market Value (US$ Million) Analysis, By Nature, 2014 to 2029

Figure 42: North America Market Volume (Tons) Analysis, By Nature, 2014 to 2029

Figure 43: North America Market Share and BPS Analysis, By Nature, 2022 & 2029

Figure 44: North America Market Y-o-Y Growth (%) Projections, By Nature, 2022 to 2029

Figure 45: North America Market Attractiveness, By Nature, 2014 to 2029

Figure 46: North America Market Value (US$ Million) Analysis, By Source, 2014 to 2029

Figure 47: North America Market Volume (Tons) Analysis, By Source, 2014 to 2029

Figure 48: North America Market Share and BPS Analysis, By Source, 2022 & 2029

Figure 49: North America Market Y-o-Y Growth (%) Projections, By Source, 2022 to 2029

Figure 50: North America Market Attractiveness, By Source, 2014 to 2029

Figure 51: North America Market Value (US$ Million) Analysis, By Method, 2014 to 2029

Figure 52: North America Market Volume (Tons) Analysis, By Method, 2014 to 2029

Figure 53: North America Market Share and BPS Analysis, By Method, 2022 & 2029

Figure 54: North America Market Y-o-Y Growth (%) Projections, By Method, 2022 to 2029

Figure 55: North America Market Attractiveness, By Method, 2014 to 2029

Figure 56: North America Market Value (US$ Million) Analysis, By Application, 2014 to 2029

Figure 57: North America Market Volume (Tons) Analysis, By Application, 2014 to 2029

Figure 58: North America Market Share and BPS Analysis, By Application, 2022 & 2029

Figure 59: North America Market Y-o-Y Growth (%) Projections, By Application, 2022 to 2029

Figure 60: North America Market Attractiveness, By Application, 2014 to 2029

Figure 61: North America Market Value (US$ Million) Analysis, By Country, 2014 to 2029

Figure 62: North America Market Volume (Tons) Analysis, By Country, 2014 to 2029

Figure 63: North America Market Share and BPS Analysis, By Country, 2022 & 2029

Figure 64: North America Market Y-o-Y Growth (%) Projections, By Country, 2022 to 2029

Figure 65: North America Market Attractiveness, By Country, 2014 to 2029

Figure 66: Latin America Market Value (US$ Million) Analysis, By Extracts Type, 2014 to 2029

Figure 67: Latin America Market Volume (Tons) Analysis, By Extracts Type, 2014 to 2029

Figure 68: Latin America Market Share and BPS Analysis, By Extracts Type, 2022 & 2029

Figure 69: Latin America Market Y-o-Y Growth (%) Projections, By Extracts Type, 2022 to 2029

Figure 70: Latin America Market Attractiveness, By Extracts Type, 2014 to 2029

Figure 71: Latin America Market Value (US$ Million) Analysis, By Nature, 2014 to 2029

Figure 72: Latin America Market Volume (Tons) Analysis, By Nature, 2014 to 2029

Figure 73: Latin America Market Share and BPS Analysis, By Nature, 2022 & 2029

Figure 74: Latin America Market Y-o-Y Growth (%) Projections, By Nature, 2022 to 2029

Figure 75: Latin America Market Attractiveness, By Nature, 2014 to 2029

Figure 76: Latin America Market Value (US$ Million) Analysis, By Source, 2014 to 2029

Figure 77: Latin America Market Volume (Tons) Analysis, By Source, 2014 to 2029

Figure 78: Latin America Market Share and BPS Analysis, By Source, 2022 & 2029

Figure 79: Latin America Market Y-o-Y Growth (%) Projections, By Source, 2022 to 2029

Figure 80: Latin America Market Attractiveness, By Source, 2014 to 2029

Figure 81: Latin America Market Value (US$ Million) Analysis, By Method, 2014 to 2029

Figure 82: Latin America Market Volume (Tons) Analysis, By Method, 2014 to 2029

Figure 83: Latin America Market Share and BPS Analysis, By Method, 2022 & 2029

Figure 84: Latin America Market Y-o-Y Growth (%) Projections, By Method, 2022 to 2029

Figure 85: Latin America Market Attractiveness, By Method, 2014 to 2029

Figure 86: Latin America Market Value (US$ Million) Analysis, By Application, 2014 to 2029

Figure 87: Latin America Market Volume (Tons) Analysis, By Application, 2014 to 2029

Figure 88: Latin America Market Share and BPS Analysis, By Application, 2022 & 2029

Figure 89: Latin America Market Y-o-Y Growth (%) Projections, By Application, 2022 to 2029

Figure 90: Latin America Market Attractiveness, By Application, 2014 to 2029

Figure 91: Latin America Market Value (US$ Million) Analysis, By Country, 2014 to 2029

Figure 92: Latin America Market Volume (Tons) Analysis, By Country, 2014 to 2029

Figure 93: Latin America Market Share and BPS Analysis, By Country, 2022 & 2029

Figure 94: Latin America Market Y-o-Y Growth (%) Projections, By Country, 2022 to 2029

Figure 95: Latin America Market Attractiveness, By Country, 2014 to 2029

Figure 96: Europe Market Value (US$ Million) Analysis, By Extracts Type, 2014 to 2029

Figure 97: Europe Market Volume (Tons) Analysis, By Extracts Type, 2014 to 2029

Figure 98: Europe Market Share and BPS Analysis, By Extracts Type, 2022 & 2029

Figure 99: Europe Market Y-o-Y Growth (%) Projections, By Extracts Type, 2022 to 2029

Figure 100: Europe Market Attractiveness, By Extracts Type, 2014 to 2029

Figure 101: Europe Market Value (US$ Million) Analysis, By Nature, 2014 to 2029

Figure 102: Europe Market Volume (Tons) Analysis, By Nature, 2014 to 2029

Figure 103: Europe Market Share and BPS Analysis, By Nature, 2022 & 2029

Figure 104: Europe Market Y-o-Y Growth (%) Projections, By Nature, 2022 to 2029

Figure 105: Europe Market Attractiveness, By Nature, 2014 to 2029

Figure 106: Europe Market Value (US$ Million) Analysis, By Source, 2014 to 2029

Figure 107: Europe Market Volume (Tons) Analysis, By Source, 2014 to 2029

Figure 108: Europe Market Share and BPS Analysis, By Source, 2022 & 2029

Figure 109: Europe Market Y-o-Y Growth (%) Projections, By Source, 2022 to 2029

Figure 110: Europe Market Attractiveness, By Source, 2014 to 2029

Figure 111: Europe Market Value (US$ Million) Analysis, By Method, 2014 to 2029

Figure 112: Europe Market Volume (Tons) Analysis, By Method, 2014 to 2029

Figure 113: Europe Market Share and BPS Analysis, By Method, 2022 & 2029

Figure 114: Europe Market Y-o-Y Growth (%) Projections, By Method, 2022 to 2029

Figure 115: Europe Market Attractiveness, By Method, 2014 to 2029

Figure 116: Europe Market Value (US$ Million) Analysis, By Application, 2014 to 2029

Figure 117: Europe Market Volume (Tons) Analysis, By Application, 2014 to 2029

Figure 118: Europe Market Share and BPS Analysis, By Application, 2022 & 2029

Figure 119: Europe Market Y-o-Y Growth (%) Projections, By Application, 2022 to 2029

Figure 120: Europe Market Attractiveness, By Application, 2014 to 2029

Figure 121: Europe Market Value (US$ Million) Analysis, By Country, 2014 to 2029

Figure 122: Europe Market Volume (Tons) Analysis, By Country, 2014 to 2029

Figure 123: Europe Market Share and BPS Analysis, By Country, 2022 & 2029

Figure 124: Europe Market Y-o-Y Growth (%) Projections, By Country, 2022 to 2029

Figure 125: Europe Market Attractiveness, By Country, 2014 to 2029

Figure 126: South Asia Market Value (US$ Million) Analysis, By Extracts Type, 2014 to 2029

Figure 127: South Asia Market Volume (Tons) Analysis, By Extracts Type, 2014 to 2029

Figure 128: South Asia Market Share and BPS Analysis, By Extracts Type, 2022 & 2029

Figure 129: South Asia Market Y-o-Y Growth (%) Projections, By Extracts Type, 2022 to 2029

Figure 130: South Asia Market Attractiveness, By Extracts Type, 2014 to 2029

Figure 131: South Asia Market Value (US$ Million) Analysis, By Nature, 2014 to 2029

Figure 132: South Asia Market Volume (Tons) Analysis, By Nature, 2014 to 2029

Figure 133: South Asia Market Share and BPS Analysis, By Nature, 2022 & 2029

Figure 134: South Asia Market Y-o-Y Growth (%) Projections, By Nature, 2022 to 2029

Figure 135: South Asia Market Attractiveness, By Nature, 2014 to 2029

Figure 136: South Asia Market Value (US$ Million) Analysis, By Source, 2014 to 2029

Figure 137: South Asia Market Volume (Tons) Analysis, By Source, 2014 to 2029

Figure 138: South Asia Market Share and BPS Analysis, By Source, 2022 & 2029

Figure 139: South Asia Market Y-o-Y Growth (%) Projections, By Source, 2022 to 2029

Figure 140: South Asia Market Attractiveness, By Source, 2014 to 2029

Figure 141: South Asia Market Value (US$ Million) Analysis, By Method, 2014 to 2029

Figure 142: South Asia Market Volume (Tons) Analysis, By Method, 2014 to 2029

Figure 143: South Asia Market Share and BPS Analysis, By Method, 2022 & 2029

Figure 144: South Asia Market Y-o-Y Growth (%) Projections, By Method, 2022 to 2029

Figure 145: South Asia Market Attractiveness, By Method, 2014 to 2029

Figure 146: South Asia Market Value (US$ Million) Analysis, By Application, 2014 to 2029

Figure 147: South Asia Market Volume (Tons) Analysis, By Application, 2014 to 2029

Figure 148: South Asia Market Share and BPS Analysis, By Application, 2022 & 2029

Figure 149: South Asia Market Y-o-Y Growth (%) Projections, By Application, 2022 to 2029

Figure 150: South Asia Market Attractiveness, By Application, 2014 to 2029

Figure 151: South Asia Market Value (US$ Million) Analysis, By Country, 2014 to 2029

Figure 152: South Asia Market Volume (Tons) Analysis, By Country, 2014 to 2029

Figure 153: South Asia Market Share and BPS Analysis, By Country, 2022 & 2029

Figure 154: South Asia Market Y-o-Y Growth (%) Projections, By Country, 2022 to 2029

Figure 155: South Asia Market Attractiveness, By Country, 2014 to 2029

Figure 156: East Asia Market Value (US$ Million) Analysis, By Extracts Type, 2014 to 2029

Figure 157: East Asia Market Volume (Tons) Analysis, By Extracts Type, 2014 to 2029

Figure 158: East Asia Market Share and BPS Analysis, By Extracts Type, 2022 & 2029

Figure 159: East Asia Market Y-o-Y Growth (%) Projections, By Extracts Type, 2022 to 2029

Figure 160: East Asia Market Attractiveness, By Extracts Type, 2014 to 2029

Figure 161: East Asia Market Value (US$ Million) Analysis, By Nature, 2014 to 2029

Figure 162: East Asia Market Volume (Tons) Analysis, By Nature, 2014 to 2029

Figure 163: East Asia Market Share and BPS Analysis, By Nature, 2022 & 2029

Figure 164: East Asia Market Y-o-Y Growth (%) Projections, By Nature, 2022 to 2029

Figure 165: East Asia Market Attractiveness, By Nature, 2014 to 2029

Figure 166: East Asia Market Value (US$ Million) Analysis, By Source, 2014 to 2029

Figure 167: East Asia Market Volume (Tons) Analysis, By Source, 2014 to 2029

Figure 168: East Asia Market Share and BPS Analysis, By Source, 2022 & 2029

Figure 169: East Asia Market Y-o-Y Growth (%) Projections, By Source, 2022 to 2029

Figure 170: East Asia Market Attractiveness, By Source, 2014 to 2029

Figure 171: East Asia Market Value (US$ Million) Analysis, By Method, 2014 to 2029

Figure 172: East Asia Market Volume (Tons) Analysis, By Method, 2014 to 2029

Figure 173: East Asia Market Share and BPS Analysis, By Method, 2022 & 2029

Figure 174: East Asia Market Y-o-Y Growth (%) Projections, By Method, 2022 to 2029

Figure 175: East Asia Market Attractiveness, By Method, 2014 to 2029

Figure 176: East Asia Market Value (US$ Million) Analysis, By Application, 2014 to 2029

Figure 177: East Asia Market Volume (Tons) Analysis, By Application, 2014 to 2029

Figure 178: East Asia Market Share and BPS Analysis, By Application, 2022 & 2029

Figure 179: East Asia Market Y-o-Y Growth (%) Projections, By Application, 2022 to 2029

Figure 180: East Asia Market Attractiveness, By Application, 2014 to 2029

Figure 181: East Asia Market Value (US$ Million) Analysis, By Country, 2014 to 2029

Figure 182: East Asia Market Volume (Tons) Analysis, By Country, 2014 to 2029

Figure 183: East Asia Market Share and BPS Analysis, By Country, 2022 & 2029

Figure 184: East Asia Market Y-o-Y Growth (%) Projections, By Country, 2022 to 2029

Figure 185: East Asia Market Attractiveness, By Country, 2014 to 2029

Figure 186: Oceania Market Value (US$ Million) Analysis, By Extracts Type, 2014 to 2029

Figure 187: Oceania Market Volume (Tons) Analysis, By Extracts Type, 2014 to 2029

Figure 188: Oceania Market Share and BPS Analysis, By Extracts Type, 2022 & 2029

Figure 189: Oceania Market Y-o-Y Growth (%) Projections, By Extracts Type, 2022 to 2029

Figure 190: Oceania Market Attractiveness, By Extracts Type, 2014 to 2029

Figure 191: Oceania Market Value (US$ Million) Analysis, By Nature, 2014 to 2029

Figure 192: Oceania Market Volume (Tons) Analysis, By Nature, 2014 to 2029

Figure 193: Oceania Market Share and BPS Analysis, By Nature, 2022 & 2029

Figure 194: Oceania Market Y-o-Y Growth (%) Projections, By Nature, 2022 to 2029

Figure 195: Oceania Market Attractiveness, By Nature, 2014 to 2029

Figure 196: Oceania Market Value (US$ Million) Analysis, By Source, 2014 to 2029

Figure 197: Oceania Market Volume (Tons) Analysis, By Source, 2014 to 2029

Figure 198: Oceania Market Share and BPS Analysis, By Source, 2022 & 2029

Figure 199: Oceania Market Y-o-Y Growth (%) Projections, By Source, 2022 to 2029

Figure 200: Oceania Market Attractiveness, By Source, 2014 to 2029

Figure 201: Oceania Market Value (US$ Million) Analysis, By Method, 2014 to 2029

Figure 202: Oceania Market Volume (Tons) Analysis, By Method, 2014 to 2029

Figure 203: Oceania Market Share and BPS Analysis, By Method, 2022 & 2029

Figure 204: Oceania Market Y-o-Y Growth (%) Projections, By Method, 2022 to 2029

Figure 205: Oceania Market Attractiveness, By Method, 2014 to 2029

Figure 206: Oceania Market Value (US$ Million) Analysis, By Application, 2014 to 2029

Figure 207: Oceania Market Volume (Tons) Analysis, By Application, 2014 to 2029

Figure 208: Oceania Market Share and BPS Analysis, By Application, 2022 & 2029

Figure 209: Oceania Market Y-o-Y Growth (%) Projections, By Application, 2022 to 2029

Figure 210: Oceania Market Attractiveness, By Application, 2014 to 2029

Figure 211: Oceania Market Value (US$ Million) Analysis, By Country, 2014 to 2029

Figure 212: Oceania Market Volume (Tons) Analysis, By Country, 2014 to 2029

Figure 213: Oceania Market Share and BPS Analysis, By Country, 2022 & 2029

Figure 214: Oceania Market Y-o-Y Growth (%) Projections, By Country, 2022 to 2029

Figure 215: Oceania Market Attractiveness, By Country, 2014 to 2029

Figure 216: Middle East and Africa Market Value (US$ Million) Analysis, By Extracts Type, 2014 to 2029

Figure 217: Middle East and Africa Market Volume (Tons) Analysis, By Extracts Type, 2014 to 2029

Figure 218: Middle East and Africa Market Share and BPS Analysis, By Extracts Type, 2022 & 2029

Figure 219: Middle East and Africa Market Y-o-Y Growth (%) Projections, By Extracts Type, 2022 to 2029

Figure 220: Middle East and Africa Market Attractiveness, By Extracts Type, 2014 to 2029

Figure 221: Middle East and Africa Market Value (US$ Million) Analysis, By Nature, 2014 to 2029

Figure 222: Middle East and Africa Market Volume (Tons) Analysis, By Nature, 2014 to 2029

Figure 223: Middle East and Africa Market Share and BPS Analysis, By Nature, 2022 & 2029

Figure 224: Middle East and Africa Market Y-o-Y Growth (%) Projections, By Nature, 2022 to 2029

Figure 225: Middle East and Africa Market Attractiveness, By Nature, 2014 to 2029

Figure 226: Middle East and Africa Market Value (US$ Million) Analysis, By Source, 2014 to 2029

Figure 227: Middle East and Africa Market Volume (Tons) Analysis, By Source, 2014 to 2029

Figure 228: Middle East and Africa Market Share and BPS Analysis, By Source, 2022 & 2029

Figure 229: Middle East and Africa Market Y-o-Y Growth (%) Projections, By Source, 2022 to 2029

Figure 230: Middle East and Africa Market Attractiveness, By Source, 2014 to 2029

Figure 231: Middle East and Africa Market Value (US$ Million) Analysis, By Method, 2014 to 2029

Figure 232: Middle East and Africa Market Volume (Tons) Analysis, By Method, 2014 to 2029

Figure 233: Middle East and Africa Market Share and BPS Analysis, By Method, 2022 & 2029

Figure 234: Middle East and Africa Market Y-o-Y Growth (%) Projections, By Method, 2022 to 2029

Figure 235: Middle East and Africa Market Attractiveness, By Method, 2014 to 2029

Figure 236: Middle East and Africa Market Value (US$ Million) Analysis, By Application, 2014 to 2029

Figure 237: Middle East and Africa Market Volume (Tons) Analysis, By Application, 2014 to 2029

Figure 238: Middle East and Africa Market Share and BPS Analysis, By Application, 2022 & 2029

Figure 239: Middle East and Africa Market Y-o-Y Growth (%) Projections, By Application, 2022 to 2029

Figure 240: Middle East and Africa Market Attractiveness, By Application, 2014 to 2029

Figure 241: Middle East and Africa Market Value (US$ Million) Analysis, By Country, 2014 to 2029

Figure 242: Middle East and Africa Market Volume (Tons) Analysis, By Country, 2014 to 2029

Figure 243: Middle East and Africa Market Share and BPS Analysis, By Country, 2022 & 2029

Figure 244: Middle East and Africa Market Y-o-Y Growth (%) Projections, By Country, 2022 to 2029

Figure 245: Middle East and Africa Market Attractiveness, By Country, 2014 to 2029

Figure 246: Middle East and Africa Market Attractiveness, By Country, 2014 to 2029

Recommendations

Consumer Product

Fragrance Diffuser Market

Published : March 2024

Consumer Product

Floral Nectar Market

Published : November 2023

Food and Beverage

Passion Fruit Extract Market

Published : October 2023

Consumer Product

Floral Extract Market

Published : July 2022

Explore Consumer Product Insights

View Reports