Amla Extract Market Size, Share, and Forecast Outlook 2025 to 2035

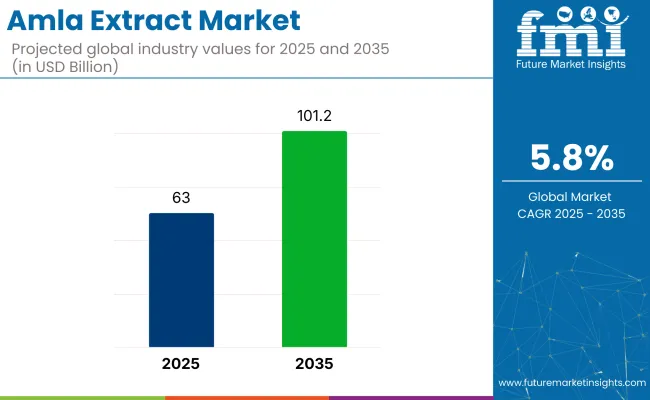
The amla extract market is projected to grow from USD 63 billion in 2025 to USD 101.2 billion by 2035, reflecting a CAGR of 5.8% over the forecast period. Rising consumer preference for botanical ingredients in daily wellness, skincare, and functional food products is expected to support steady demand for amla-based formulations. India continues to be the largest producer and exporter, while global demand is increasing across North America, Europe, and East Asia.
Quick Stats in Amla Extract Market

  • Market Value (2025): USD 63 billion
  • Forecast Value (2035): USD 101.2 billion
  • Forecast CAGR: 5.8%
  • Top Form Segment: Powder (39% market share in 2025)
  • Leading Nature Category: Organic (65% market share in 2025)
  • Key Growth Country: UK (7.2% CAGR)

Amla Extract Market

As of 2025, the amla extract market holds a modest but steadily expanding share across its broader parent markets. Within the global herbal extracts market, it contributes approximately 3-5%, supported by its rich vitamin C content and traditional medicinal use. In the nutraceuticals market, amla extract accounts for about 2-3%, as it's widely included in immunity-boosting and anti-aging formulations.

Within the functional food ingredients market, its share is estimated at 1-2%, used in fortified juices, snacks, and health beverages. In the dietary supplements market, amla extract makes up around 2-4%, especially in capsules and powders. In the Ayurvedic products market, its presence is stronger, contributing roughly 6-8%, driven by its long-standing role in Ayurvedic formulations like chyawanprash and herbal tonics.

Processing innovation, including low-heat extraction and freeze-drying, is helping preserve nutrient potency and flavor integrity in amla products. As regulatory clarity improves in key markets, the extract is increasingly entering mainstream dietary supplements and fortified food categories. With its blend of heritage appeal and functional value, amla extract is positioned to expand its global footprint across wellness-driven industries.

Analyzing Amla Extract Market by Top Investment Segments

Powder form is projected to lead the form segment with a 39% market share by 2025, while organic amla extract is expected to dominate the nature segment with a commanding 65% share, supported by rising demand for natural and clean-label nutraceuticals.

Powder Form to Lead the Form Segment with 39% Market Share

Powdered amla extract is anticipated to dominate the form segment, securing a 39% market share by 2025, driven by its high versatility and ease of use in dietary supplements and food products.
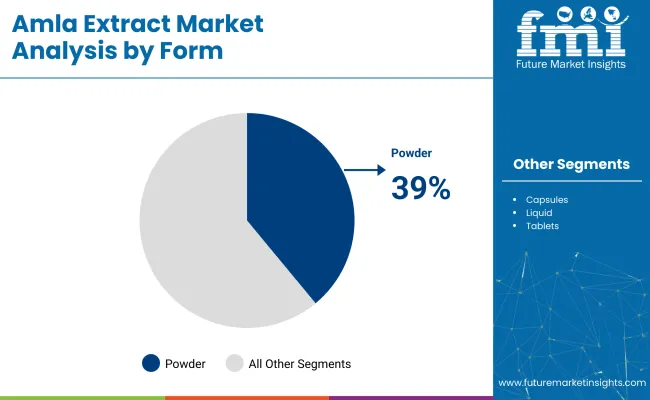
  • Powder form has been widely incorporated into health beverages, capsules, and functional food offerings due to its stable shelf life and standardized nutrient profile. Consumers seeking immune-boosting superfoods have increasingly favored powdered amla for its high vitamin C content.
  • Large-scale manufacturers have adopted powder-based formulations to streamline processing and packaging, enhancing supply chain efficiency. Expanding demand for herbal wellness products is likely to keep powdered extracts in strong demand across global nutraceutical markets.

Amla Extract Market Analysis By Form

Organic Amla Extract to Dominate the Nature Segment with 65% Market Share

Organic amla extract is expected to lead the nature segment with a 65% share by 2025, supported by the growing preference for clean-label, chemical-free health ingredients.
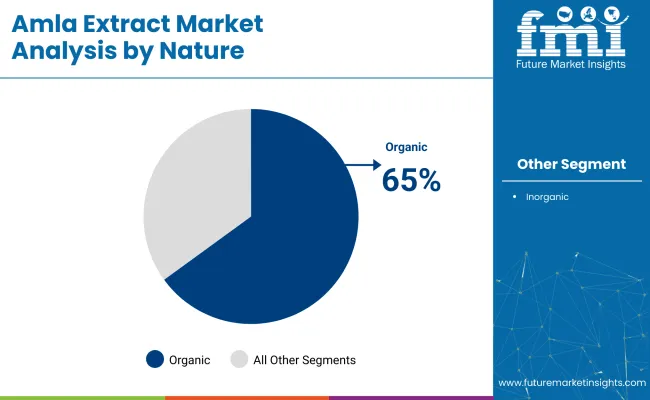
  • Rising health consciousness among consumers has significantly increased the adoption of organic products, including herbal extracts used in functional foods and supplements. Organic certification provides added value by assuring safety, sustainability, and purity.
  • Wellness brands and supplement manufacturers are integrating organic amla into formulations to align with eco-conscious and natural health trends. The organic segment continues to be propelled by regulatory backing, increasing e-commerce penetration, and expanding health-focused consumer demographics.

Amla Extract Market Analysis By Nature

Top Amla Extract Market Dynamics

Manufacturers are targeting the growing demand for herbal supplements, clean-label cosmetics, and plant-based food additives. Ayurvedic wellness products utilize amla for detox and adaptogenic effects, which is likely to generate demand for amla extract for functional foods.

Expanding Applications in Nutraceuticals and Functional Foods

Amla extract is increasingly used in dietary supplements for its immune-boosting and anti-inflammatory properties. Capsules, powders, and drink formulations enriched with amla are popular among health-conscious consumers. Functional food producers are incorporating it into juices, gummies, and health bars to enhance nutritional value. Its adaptogenic and detoxifying benefits are also gaining traction in Ayurveda-inspired wellness products.

  • Amla extract is used in supplements for immune support and antioxidant benefits.
  • Functional foods incorporate amla for enhanced nutritional and health appeal.

Rising Demand in Clean-Label and Herbal Cosmetics

Amla extract is a preferred ingredient in natural and herbal beauty formulations. Its role in promoting skin radiance, reducing pigmentation, and strengthening hair has led to widespread use in creams, serums, shampoos, and hair oils. Clean-label cosmetic brands emphasize amla's plant-based origin and traditional efficacy, especially in sulfate- and paraben-free products.
  • Amla extract is used in skincare to brighten skin and reduce blemishes.
  • Haircare products rely on amla to improve scalp health and strengthen strands.
  • Natural cosmetic brands prefer amla for its herbal origin and proven benefits.

Analysis of Top Countries Innovating, Processing, and Commercializing Amla Extract Products Globally

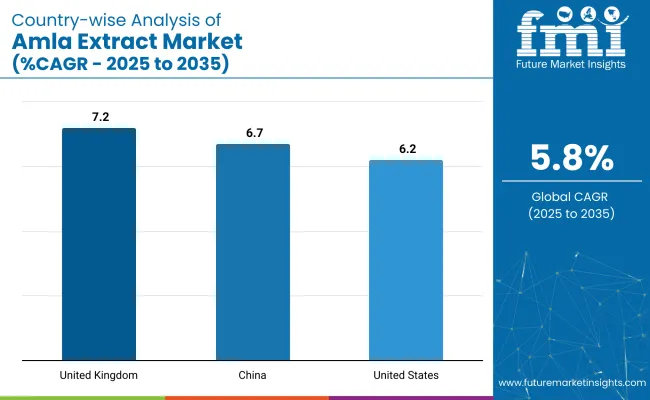
Country Wise Analysis Of Amla Extract Market Cagr 2025 To 2035

Countries CAGR (2025 to 2035)
United Kingdom 7.2%
China 6.7%
United States 6.2%

The global market is projected to grow at a CAGR of 5.8% from 2025 to 2035, driven by increased demand for natural antioxidants, vitamin C-rich formulations, and plant-based wellness products. The United Kingdom leads among key countries with a CAGR of 7.2%, followed by China at 6.7%, and the United States at 6.2%.

Growth is being powered by consumer interest in herbal immunity boosters, ayurvedic nutrition, and clean-label cosmetic ingredients. Amla extract, known for its adaptogenic and anti-inflammatory properties, is gaining traction across nutraceuticals, personal care, and functional food sectors.

In the OECD markets the USA and the UK are focusing on regulatory-backed nutraceutical innovation, while China, a BRICS member, is scaling production for both domestic and export purposes.

The report provides insights across 40+ countries. The three below are highlighted for their strategic influence and growth trajectory.

United Kingdom Amla Extract Market Outlook

The United Kingdom is experiencing the highest growth among leading countries with a CAGR of 7.2% from 2025 to 2035. Consumer demand is rising for botanical-based supplements, immunity-supporting capsules, and clean-label beauty products that contain high levels of natural antioxidants like amla extract.

As an OECD country with strong regulatory infrastructure for nutraceuticals, the UK supports product innovation in functional foods and wellness blends. Online wellness retailers and organic personal care brands are incorporating amla into hair, skin, and digestive health formulations, appealing to the country’s plant-forward and ethically conscious consumers.

  • Demand for herbal supplements is growing in immune and gut health.
  • Amla-based skincare and haircare products are entering premium shelves.
  • Clean-label and vegan product positioning is gaining popularity.

China Amla Extract Market Trends

China’s amla extract market is growing at a CAGR of 6.7%, driven by both traditional medicine influence and the rise of natural health products. As a BRICS and Protein-Transition Market, China is witnessing rapid expansion in herbal supplement usage and adaptogenic ingredients.

Domestic manufacturers are exploring amla's applications in TCM-inspired blends, functional teas, and anti-aging cosmetics. Rising middle-class health awareness, government-backed herbal medicine standardization, and strong e-commerce distribution are propelling local and imported amla extract brands into the mainstream wellness space.

  • Amla is used in energy-boosting and anti-fatigue herbal mixes.
  • Growth in natural beauty brands is accelerating demand for fruit extracts.
  • Cross-border e-commerce is expanding the availability of amla products.

United States Amla Extract Market Insights

The USA market is forecast to grow at a CAGR of 6.2%, supported by rising interest in adaptogens, clean-label superfoods, and Ayurvedic nutrition. As an OECD and Agri-food Tech Pioneer, the USA offers a fertile landscape for natural product innovation in gummies, tablets, and skincare formulations. Amla extract is being included in collagen-supporting supplements, anti-aging serums, and stress-relief blends.

Wellness influencers, natural grocery chains, and personalized supplement platforms are increasing consumer exposure. FDA labeling regulations and growing consumer demand for traceable ingredients are prompting companies to invest in quality sourcing and formulation transparency.

  • Amla is gaining traction in anti-aging and stress-management products.
  • Wellness brands are expanding into personalized plant-based formulations.
  • Transparency and sourcing integrity are key to market expansion.

Leading Amla Extract Manufacturers

The industry is moderately fragmented, featuring a diverse set of players ranging from large nutraceutical firms to specialized herbal product manufacturers. Leading companies such as Dabur India Ltd. and Organic India Pvt. Ltd. are prominent in the Ayurvedic and wellness sectors, offering high-quality amla extracts in a variety of formulations. NutraGenesis LLC and Natreon Inc. serve global markets with standardized botanical extracts, emphasizing scientific validation and quality control.

AmbePhytoextracts Pvt. Ltd. and Herbeno Herbals Pvt. Ltd. focus on large-scale herbal extraction and supply to pharmaceutical and cosmetic industries. Emerging players like Avestia Pharma, Ayurceutics, and Indigo Herbs Ltd. are gaining traction by offering clean-label, organic-certified amla products. Additionally, Aloecorp Inc. and Rusmolco contribute through their diversified botanical extract portfolios and sustainable sourcing strategies, enhancing global market competitiveness.

Recent Amla Extract Industry News

In October 2024, Organic India Pvt. Ltd. expanded its certified organic cultivation network in Uttar Pradesh to boost the sustainable supply of high-grade amla used in herbal formulations.

Report Coverage and Scope Summary

Report Attributes Details
Market Size (2025) USD 63 billion
Projected Market Size (2035) USD 101.2 billion
CAGR (2025 to 2035) 5.8%
Base Year for Estimation 2024
Historical Period 2020 to 2024
Projections Period 2025 to 2035
Quantitative Units USD billion for market value
Forms Analyzed (Segment 1) Powder, Liquid, Capsules, Tablets
Nature Analyzed (Segment 2) Organic, Inorganic
Regions Covered North America, Latin America, Western Europe, Eastern Europe, South Asia & Pacific, East Asia, Central Asia, Balkan & Baltic Countries, Russia & Belarus, Middle East & Africa
Key Players Dabur India Ltd., NutraGenesis LLC, Organic India Pvt. Ltd., Natreon Inc., Ambe Phytoextracts Pvt. Ltd., Avestia Pharma, Herbeno Herbals Pvt. Ltd., Rusmolco, Ayurceutics, Aloecorp Inc., Indigo Herbs Ltd.
Additional Attributes Dollar sales by form and nature, growing traction for organic extracts, rising adoption in dietary supplements, and expansion in functional food and nutraceutical sectors globally.

Leading Players in Amla Extract Industry

  • Dabur India Ltd.
  • NutraGenesis LLC
  • Organic India Pvt. Ltd.
  • Natreon Inc.
  • AmbePhytoextractsPvt. Ltd.
  • Avestia Pharma
  • Herbeno Herbals Pvt. Ltd.
  • Rusmolco
  • Ayurceutics
  • Aloecorp Inc.
  • Indigo Herbs Ltd.

Amla Extract Market Analyzed by Key Investment Segments

By Form:

By form, the industry has been categorized into powder, liquid, capsules, and tablets.

By Nature:

By nature, the industry is segmented into organic and inorganic variants.

By Region:

The market spans across multiple regions, including North America, Latin America, Western Europe, Eastern Europe, South Asia & Pacific, East Asia, Central Asia, Balkan and Baltic Countries, Russia and Belarus, and the Middle East & Africa.

Table of Content

  1. Executive Summary
    • Global Market Outlook
    • Demand-side Trends
    • Supply-side Trends
    • Technology Roadmap Analysis
    • Analysis and Recommendations
  2. Market Overview
    • Market Coverage / Taxonomy
    • Market Definition / Scope / Limitations
  3. Market Background
    • Market Dynamics
      • Drivers
      • Restraints
      • Opportunity
      • Trends
    • Scenario Forecast
      • Demand in Optimistic Scenario
      • Demand in Likely Scenario
      • Demand in Conservative Scenario
    • Opportunity Map Analysis
    • Product Life Cycle Analysis
    • Supply Chain Analysis
      • Supply Side Participants and their Roles
        • Producers
        • Mid-Level Participants (Traders/ Agents/ Brokers)
        • Wholesalers and Distributors
      • Value Added and Value Created at Node in the Supply Chain
      • List of Raw Material Suppliers
      • List of Existing and Potential Buyer’s
    • Investment Feasibility Matrix
    • Value Chain Analysis
      • Profit Margin Analysis
      • Wholesalers and Distributors
      • Retailers
    • PESTLE and Porter’s Analysis
    • Regulatory Landscape
      • By Key Regions
      • By Key Countries
    • Regional Parent Market Outlook
    • Production and Consumption Statistics
    • Import and Export Statistics
  4. Global Market Analysis 2020 to 2024 and Forecast, 2025 to 2035
    • Historical Market Size Value (USD Billion) & Volume (Metric tons) Analysis, 2020 to 2024
    • Current and Future Market Size Value (USD Billion) & Volume (Metric tons) Projections, 2025 to 2035
      • Y-o-Y Growth Trend Analysis
      • Absolute $ Opportunity Analysis
  5. Global Market Pricing Analysis 2020 to 2024 and Forecast 2025 to 2035
  6. Global Market Analysis 2020 to 2024 and Forecast 2025 to 2035, By Form
    • Introduction / Key Findings
    • Historical Market Size Value (USD Billion) & Volume (Metric tons) Analysis By Form, 2020 to 2024
    • Current and Future Market Size Value (USD Billion) & Volume (Metric tons) Analysis and Forecast By Form, 2025 to 2035
      • Powder
      • Liquid
      • Capsules
      • Tablets
    • Y-o-Y Growth Trend Analysis By Form, 2020 to 2024
    • Absolute $ Opportunity Analysis By Form, 2025 to 2035
  7. Global Market Analysis 2020 to 2024 and Forecast 2025 to 2035, By Nature
    • Introduction / Key Findings
    • Historical Market Size Value (USD Billion) & Volume (Metric tons) Analysis By Nature, 2020 to 2024
    • Current and Future Market Size Value (USD Billion) & Volume (Metric tons) Analysis and Forecast By Nature, 2025 to 2035
      • Organic
      • Inorganic
    • Y-o-Y Growth Trend Analysis By Nature, 2020 to 2024
    • Absolute $ Opportunity Analysis By Nature, 2025 to 2035
  8. Global Market Analysis 2020 to 2024 and Forecast 2025 to 2035, By Region
    • Introduction
    • Historical Market Size Value (USD Billion) & Volume (Metric tons) Analysis By Region, 2020 to 2024
    • Current Market Size Value (USD Billion) & Volume (Metric tons) Analysis and Forecast By Region, 2025 to 2035
      • North America
      • Latin America
      • Western Europe
      • Eastern Europe
      • East Asia
      • South Asia & Pacific
      • Middle East and Africa
    • Market Attractiveness Analysis By Region
  9. North America Market Analysis 2020 to 2024 and Forecast 2025 to 2035, By Country
    • Historical Market Size Value (USD Billion) & Volume (Metric tons) Trend Analysis By Market Taxonomy, 2020 to 2024
    • Market Size Value (USD Billion) & Volume (Metric tons) Forecast By Market Taxonomy, 2025 to 2035
      • By Country
        • USA
        • Canada
        • Mexico
      • By Form
      • By Nature
    • Market Attractiveness Analysis
      • By Country
      • By Form
      • By Nature
    • Key Takeaways
  10. Latin America Market Analysis 2020 to 2024 and Forecast 2025 to 2035, By Country
    • Historical Market Size Value (USD Billion) & Volume (Metric tons) Trend Analysis By Market Taxonomy, 2020 to 2024
    • Market Size Value (USD Billion) & Volume (Metric tons) Forecast By Market Taxonomy, 2025 to 2035
      • By Country
        • Brazil
        • Argentina
        • Rest of LATAM
      • By Form
      • By Nature
    • Market Attractiveness Analysis
      • By Country
      • By Form
      • By Nature
    • Key Takeaways
  11. Western Europe Market Analysis 2020 to 2024 and Forecast 2025 to 2035, By Country
    • Historical Market Size Value (USD Billion) & Volume (Metric tons) Trend Analysis By Market Taxonomy, 2020 to 2024
    • Market Size Value (USD Billion) & Volume (Metric tons) Forecast By Market Taxonomy, 2025 to 2035
      • By Country
        • Germany
        • Italy
        • France
        • UK
        • Spain
        • BENELUX
        • Nordic
        • Rest of W.Europe
      • By Form
      • By Nature
    • Market Attractiveness Analysis
      • By Country
      • By Form
      • By Nature
    • Key Takeaways
  12. Eastern Europe Market Analysis 2020 to 2024 and Forecast 2025 to 2035, By Country
    • Historical Market Size Value (USD Billion) & Volume (Metric tons) Trend Analysis By Market Taxonomy, 2020 to 2024
    • Market Size Value (USD Billion) & Volume (Metric tons) Forecast By Market Taxonomy, 2025 to 2035
      • By Country
        • Russia
        • Hungary
        • Poland
        • Balkan & Baltics
        • Rest of E. Europe
      • By Form
      • By Nature
    • Market Attractiveness Analysis
      • By Country
      • By Form
      • By Nature
    • Key Takeaways
  13. East Asia Market Analysis 2020 to 2024 and Forecast 2025 to 2035, By Country
    • Historical Market Size Value (USD Billion) & Volume (Metric tons) Trend Analysis By Market Taxonomy, 2020 to 2024
    • Market Size Value (USD Billion) & Volume (Metric tons) Forecast By Market Taxonomy, 2025 to 2035
      • By Country
        • China
        • Japan
        • South Korea
      • By Form
      • By Nature
    • Market Attractiveness Analysis
      • By Country
      • By Form
      • By Nature
    • Key Takeaways
  14. South Asia & Pacific Market Analysis 2020 to 2024 and Forecast 2025 to 2035, By Country
    • Historical Market Size Value (USD Billion) & Volume (Metric tons) Trend Analysis By Market Taxonomy, 2020 to 2024
    • Market Size Value (USD Billion) & Volume (Metric tons) Forecast By Market Taxonomy, 2025 to 2035
      • By Country
        • India
        • Australia & New Zealand
        • ASEAN
        • Rest of SAP
      • By Form
      • By Nature
    • Market Attractiveness Analysis
      • By Country
      • By Form
      • By Nature
    • Key Takeaways
  15. Middle East and Africa Market Analysis 2020 to 2024 and Forecast 2025 to 2035, By Country
    • Historical Market Size Value (USD Billion) & Volume (Metric tons) Trend Analysis By Market Taxonomy, 2020 to 2024
    • Market Size Value (USD Billion) & Volume (Metric tons) Forecast By Market Taxonomy, 2025 to 2035
      • By Country
        • GCC Countries
        • Northern Africa
        • South Africa
        • Turkiye
        • Rest of MEA
      • By Form
      • By Nature
    • Market Attractiveness Analysis
      • By Country
      • By Form
      • By Nature
    • Key Takeaways
  16. Key Countries Market Analysis
    • USA
      • Pricing Analysis
      • Market Share Analysis, 2024
        • By Form
        • By Nature
    • Canada
      • Pricing Analysis
      • Market Share Analysis, 2024
        • By Form
        • By Nature
    • Brazil
      • Pricing Analysis
      • Market Share Analysis, 2024
        • By Form
        • By Nature
    • Mexico
      • Pricing Analysis
      • Market Share Analysis, 2024
        • By Form
        • By Nature
    • Argentina
      • Pricing Analysis
      • Market Share Analysis, 2024
        • By Form
        • By Nature
  17. Market Structure Analysis
    • Competition Dashboard
    • Competition Benchmarking
    • Market Share Analysis of Top Players
      • By Regional
      • By Form
      • By Nature
  18. Competition Analysis
    • Competition Deep Dive
      • Dabur India Ltd.
        • Overview
        • Product Portfolio
        • Profitability by Market Segments (Product/Age /Sales Channel/Region)
        • Sales Footprint
        • Strategy Overview
          • Marketing Strategy
          • Product Strategy
          • Channel Strategy
      • NutraGenesis LLC
        • Overview
        • Product Portfolio
        • Profitability by Market Segments (Product/Age /Sales Channel/Region)
        • Sales Footprint
        • Strategy Overview
          • Marketing Strategy
          • Product Strategy
          • Channel Strategy
      • Organic India Pvt. Ltd.
        • Overview
        • Product Portfolio
        • Profitability by Market Segments (Product/Age /Sales Channel/Region)
        • Sales Footprint
        • Strategy Overview
          • Marketing Strategy
          • Product Strategy
          • Channel Strategy
      • Natreon Inc.
        • Overview
        • Product Portfolio
        • Profitability by Market Segments (Product/Age /Sales Channel/Region)
        • Sales Footprint
        • Strategy Overview
          • Marketing Strategy
          • Product Strategy
          • Channel Strategy
      • Ambe Phytoextracts Pvt. Ltd.
        • Overview
        • Product Portfolio
        • Profitability by Market Segments (Product/Age /Sales Channel/Region)
        • Sales Footprint
        • Strategy Overview
          • Marketing Strategy
          • Product Strategy
          • Channel Strategy
      • Avestia Pharma
        • Overview
        • Product Portfolio
        • Profitability by Market Segments (Product/Age /Sales Channel/Region)
        • Sales Footprint
        • Strategy Overview
          • Marketing Strategy
          • Product Strategy
          • Channel Strategy
      • Herbeno Herbals Pvt. Ltd.
        • Overview
        • Product Portfolio
        • Profitability by Market Segments (Product/Age /Sales Channel/Region)
        • Sales Footprint
        • Strategy Overview
          • Marketing Strategy
          • Product Strategy
          • Channel Strategy
      • Rusmolco
        • Overview
        • Product Portfolio
        • Profitability by Market Segments (Product/Age /Sales Channel/Region)
        • Sales Footprint
        • Strategy Overview
          • Marketing Strategy
          • Product Strategy
          • Channel Strategy
      • Ayurceutics
        • Overview
        • Product Portfolio
        • Profitability by Market Segments (Product/Age /Sales Channel/Region)
        • Sales Footprint
        • Strategy Overview
          • Marketing Strategy
          • Product Strategy
          • Channel Strategy
      • Aloecorp Inc.
        • Overview
        • Product Portfolio
        • Profitability by Market Segments (Product/Age /Sales Channel/Region)
        • Sales Footprint
        • Strategy Overview
          • Marketing Strategy
          • Product Strategy
          • Channel Strategy
      • Indigo Herbs Ltd.
        • Overview
        • Product Portfolio
        • Profitability by Market Segments (Product/Age /Sales Channel/Region)
        • Sales Footprint
        • Strategy Overview
          • Marketing Strategy
          • Product Strategy
          • Channel Strategy
  19. Assumptions & Acronyms Used
  20. Research Methodology

List of Tables

  • Table 1: Global Market Value (USD Billion) Forecast by Region, 2020 to 2035
  • Table 2: Global Market Volume (Metric tons) Forecast by Region, 2020 to 2035
  • Table 3: Global Market Value (USD Billion) Forecast by Form, 2020 to 2035
  • Table 4: Global Market Volume (Metric tons) Forecast by Form, 2020 to 2035
  • Table 5: Global Market Value (USD Billion) Forecast by Nature, 2020 to 2035
  • Table 6: Global Market Volume (Metric tons) Forecast by Nature, 2020 to 2035
  • Table 7: North America Market Value (USD Billion) Forecast by Country, 2020 to 2035
  • Table 8: North America Market Volume (Metric tons) Forecast by Country, 2020 to 2035
  • Table 9: North America Market Value (USD Billion) Forecast by Form, 2020 to 2035
  • Table 10: North America Market Volume (Metric tons) Forecast by Form, 2020 to 2035
  • Table 11: North America Market Value (USD Billion) Forecast by Nature, 2020 to 2035
  • Table 12: North America Market Volume (Metric tons) Forecast by Nature, 2020 to 2035
  • Table 13: Latin America Market Value (USD Billion) Forecast by Country, 2020 to 2035
  • Table 14: Latin America Market Volume (Metric tons) Forecast by Country, 2020 to 2035
  • Table 15: Latin America Market Value (USD Billion) Forecast by Form, 2020 to 2035
  • Table 16: Latin America Market Volume (Metric tons) Forecast by Form, 2020 to 2035
  • Table 17: Latin America Market Value (USD Billion) Forecast by Nature, 2020 to 2035
  • Table 18: Latin America Market Volume (Metric tons) Forecast by Nature, 2020 to 2035
  • Table 19: Western Europe Market Value (USD Billion) Forecast by Country, 2020 to 2035
  • Table 20: Western Europe Market Volume (Metric tons) Forecast by Country, 2020 to 2035
  • Table 21: Western Europe Market Value (USD Billion) Forecast by Form, 2020 to 2035
  • Table 22: Western Europe Market Volume (Metric tons) Forecast by Form, 2020 to 2035
  • Table 23: Western Europe Market Value (USD Billion) Forecast by Nature, 2020 to 2035
  • Table 24: Western Europe Market Volume (Metric tons) Forecast by Nature, 2020 to 2035
  • Table 25: Eastern Europe Market Value (USD Billion) Forecast by Country, 2020 to 2035
  • Table 26: Eastern Europe Market Volume (Metric tons) Forecast by Country, 2020 to 2035
  • Table 27: Eastern Europe Market Value (USD Billion) Forecast by Form, 2020 to 2035
  • Table 28: Eastern Europe Market Volume (Metric tons) Forecast by Form, 2020 to 2035
  • Table 29: Eastern Europe Market Value (USD Billion) Forecast by Nature, 2020 to 2035
  • Table 30: Eastern Europe Market Volume (Metric tons) Forecast by Nature, 2020 to 2035
  • Table 31: East Asia Market Value (USD Billion) Forecast by Country, 2020 to 2035
  • Table 32: East Asia Market Volume (Metric tons) Forecast by Country, 2020 to 2035
  • Table 33: East Asia Market Value (USD Billion) Forecast by Form, 2020 to 2035
  • Table 34: East Asia Market Volume (Metric tons) Forecast by Form, 2020 to 2035
  • Table 35: East Asia Market Value (USD Billion) Forecast by Nature, 2020 to 2035
  • Table 36: East Asia Market Volume (Metric tons) Forecast by Nature, 2020 to 2035
  • Table 37: South Asia & Pacific Market Value (USD Billion) Forecast by Country, 2020 to 2035
  • Table 38: South Asia & Pacific Market Volume (Metric tons) Forecast by Country, 2020 to 2035
  • Table 39: South Asia & Pacific Market Value (USD Billion) Forecast by Form, 2020 to 2035
  • Table 40: South Asia & Pacific Market Volume (Metric tons) Forecast by Form, 2020 to 2035
  • Table 41: South Asia & Pacific Market Value (USD Billion) Forecast by Nature, 2020 to 2035
  • Table 42: South Asia & Pacific Market Volume (Metric tons) Forecast by Nature, 2020 to 2035
  • Table 43: Middle East and Africa Market Value (USD Billion) Forecast by Country, 2020 to 2035
  • Table 44: Middle East and Africa Market Volume (Metric tons) Forecast by Country, 2020 to 2035
  • Table 45: Middle East and Africa Market Value (USD Billion) Forecast by Form, 2020 to 2035
  • Table 46: Middle East and Africa Market Volume (Metric tons) Forecast by Form, 2020 to 2035
  • Table 47: Middle East and Africa Market Value (USD Billion) Forecast by Nature, 2020 to 2035
  • Table 48: Middle East and Africa Market Volume (Metric tons) Forecast by Nature, 2020 to 2035

List of Figures

  • Figure 1: Global Market Volume (Metric tons) Forecast 2020 to 2035
  • Figure 2: Global Market Pricing Analysis
  • Figure 3: Global Market Value (USD Billion) Forecast 2020 to 2035
  • Figure 4: Global Market Value Share and BPS Analysis by Form, 2025 and 2035
  • Figure 5: Global Market Y-o-Y Growth Comparison by Form, 2025 to 2035
  • Figure 6: Global Market Attractiveness Analysis by Form
  • Figure 7: Global Market Value Share and BPS Analysis by Nature, 2025 and 2035
  • Figure 8: Global Market Y-o-Y Growth Comparison by Nature, 2025 to 2035
  • Figure 9: Global Market Attractiveness Analysis by Nature
  • Figure 10: Global Market Value (USD Billion) Share and BPS Analysis by Region, 2025 and 2035
  • Figure 11: Global Market Y-o-Y Growth Comparison by Region, 2025 to 2035
  • Figure 12: Global Market Attractiveness Analysis by Region
  • Figure 13: North America Market Incremental $ Opportunity, 2025 to 2035
  • Figure 14: Latin America Market Incremental $ Opportunity, 2025 to 2035
  • Figure 15: Western Europe Market Incremental $ Opportunity, 2025 to 2035
  • Figure 16: Eastern Europe Market Incremental $ Opportunity, 2025 to 2035
  • Figure 17: East Asia Market Incremental $ Opportunity, 2025 to 2035
  • Figure 18: South Asia & Pacific Market Incremental $ Opportunity, 2025 to 2035
  • Figure 19: Middle East and Africa Market Incremental $ Opportunity, 2025 to 2035
  • Figure 20: North America Market Value Share and BPS Analysis by Country, 2025 and 2035
  • Figure 21: North America Market Value Share and BPS Analysis by Form, 2025 and 2035
  • Figure 22: North America Market Y-o-Y Growth Comparison by Form, 2025 to 2035
  • Figure 23: North America Market Attractiveness Analysis by Form
  • Figure 24: North America Market Value Share and BPS Analysis by Nature, 2025 and 2035
  • Figure 25: North America Market Y-o-Y Growth Comparison by Nature, 2025 to 2035
  • Figure 26: North America Market Attractiveness Analysis by Nature
  • Figure 27: Latin America Market Value Share and BPS Analysis by Country, 2025 and 2035
  • Figure 28: Latin America Market Value Share and BPS Analysis by Form, 2025 and 2035
  • Figure 29: Latin America Market Y-o-Y Growth Comparison by Form, 2025 to 2035
  • Figure 30: Latin America Market Attractiveness Analysis by Form
  • Figure 31: Latin America Market Value Share and BPS Analysis by Nature, 2025 and 2035
  • Figure 32: Latin America Market Y-o-Y Growth Comparison by Nature, 2025 to 2035
  • Figure 33: Latin America Market Attractiveness Analysis by Nature
  • Figure 34: Western Europe Market Value Share and BPS Analysis by Country, 2025 and 2035
  • Figure 35: Western Europe Market Value Share and BPS Analysis by Form, 2025 and 2035
  • Figure 36: Western Europe Market Y-o-Y Growth Comparison by Form, 2025 to 2035
  • Figure 37: Western Europe Market Attractiveness Analysis by Form
  • Figure 38: Western Europe Market Value Share and BPS Analysis by Nature, 2025 and 2035
  • Figure 39: Western Europe Market Y-o-Y Growth Comparison by Nature, 2025 to 2035
  • Figure 40: Western Europe Market Attractiveness Analysis by Nature
  • Figure 41: Eastern Europe Market Value Share and BPS Analysis by Country, 2025 and 2035
  • Figure 42: Eastern Europe Market Value Share and BPS Analysis by Form, 2025 and 2035
  • Figure 43: Eastern Europe Market Y-o-Y Growth Comparison by Form, 2025 to 2035
  • Figure 44: Eastern Europe Market Attractiveness Analysis by Form
  • Figure 45: Eastern Europe Market Value Share and BPS Analysis by Nature, 2025 and 2035
  • Figure 46: Eastern Europe Market Y-o-Y Growth Comparison by Nature, 2025 to 2035
  • Figure 47: Eastern Europe Market Attractiveness Analysis by Nature
  • Figure 48: East Asia Market Value Share and BPS Analysis by Country, 2025 and 2035
  • Figure 49: East Asia Market Value Share and BPS Analysis by Form, 2025 and 2035
  • Figure 50: East Asia Market Y-o-Y Growth Comparison by Form, 2025 to 2035
  • Figure 51: East Asia Market Attractiveness Analysis by Form
  • Figure 52: East Asia Market Value Share and BPS Analysis by Nature, 2025 and 2035
  • Figure 53: East Asia Market Y-o-Y Growth Comparison by Nature, 2025 to 2035
  • Figure 54: East Asia Market Attractiveness Analysis by Nature
  • Figure 55: South Asia & Pacific Market Value Share and BPS Analysis by Country, 2025 and 2035
  • Figure 56: South Asia & Pacific Market Value Share and BPS Analysis by Form, 2025 and 2035
  • Figure 57: South Asia & Pacific Market Y-o-Y Growth Comparison by Form, 2025 to 2035
  • Figure 58: South Asia & Pacific Market Attractiveness Analysis by Form
  • Figure 59: South Asia & Pacific Market Value Share and BPS Analysis by Nature, 2025 and 2035
  • Figure 60: South Asia & Pacific Market Y-o-Y Growth Comparison by Nature, 2025 to 2035
  • Figure 61: South Asia & Pacific Market Attractiveness Analysis by Nature
  • Figure 62: Middle East and Africa Market Value Share and BPS Analysis by Country, 2025 and 2035
  • Figure 63: Middle East and Africa Market Value Share and BPS Analysis by Form, 2025 and 2035
  • Figure 64: Middle East and Africa Market Y-o-Y Growth Comparison by Form, 2025 to 2035
  • Figure 65: Middle East and Africa Market Attractiveness Analysis by Form
  • Figure 66: Middle East and Africa Market Value Share and BPS Analysis by Nature, 2025 and 2035
  • Figure 67: Middle East and Africa Market Y-o-Y Growth Comparison by Nature, 2025 to 2035
  • Figure 68: Middle East and Africa Market Attractiveness Analysis by Nature
  • Figure 69: Global Market - Tier Structure Analysis
  • Figure 70: Global Market - Company Share Analysis

Frequently Asked Questions

What is the projected size of the global amla extract market by 2035?

The global market is forecast to reach USD 101.2 billion by 2035.

What is the estimated value of the amla extract market in 2025?

In 2025, the market is expected to be valued at USD 63 billion.

What is the anticipated CAGR for the amla extract market between 2025 and 2035?

The market is projected to grow at a compound annual growth rate of 5.8% during the forecast period.

Which form is expected to lead the amla extract market in 2025?

Powdered amla extract is projected to hold the leading position, accounting for 39% of the market by form.

Which country is expected to record the fastest growth in the amla extract market?

The United Kingdom is projected to experience the highest growth, with a CAGR of 7.2% from 2025 to 2035.

Explore Similar Insights

Future Market Insights

Amla Extract Market