The global intraoral scanner market is expected to witness consistent expansion, with a valuation of USD 770.4 million in 2025, increasing from USD 744.7 million in 2024, reflecting an annual growth rate of 3.4%. By 2035, the market size is projected to reach USD 1,600 million, driven by a robust CAGR of 7.6% during 2025 to 2035. This upward trajectory is primarily attributed to the adoption of digital dentistry solutions that streamline chairside restoration procedures and improve diagnostic accuracy.
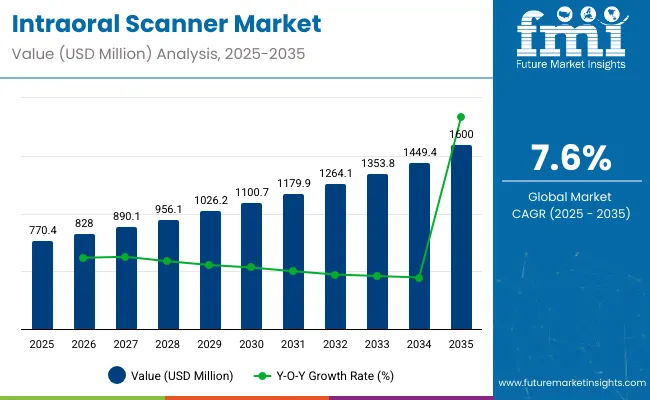
| Attributes | Key Insights |
|---|---|
| Estimated Size, 2025 | USD 770.4 million |
| Projected Size, 2035 | USD 11,600 million |
| Value-based CAGR (2025 to 2035) | 7.60% |
Among modalities, open system scanners are set to dominate with a projected 97.2% market share in 2025, favored for their adaptability to various CAD/CAM platforms, enabling dental practitioners to choose compatible software and lab partners. In contrast, closed systems remain limited in market penetration due to interoperability constraints.
Dental clinics are poised to remain the leading end-user category in 2025, accounting for an estimated 37.1% market share, driven by the widespread shift towards digital impression systems and single-visit restorations. The growing emphasis on workflow efficiency, precision, and patient comfort further fuels this segment’s demand.
At IDS 2025 on February 12, 2025, Dentsply Sirona officially unveiled its Primescan 2 intraoral scanner, featuring cloud-native architecture, AI-powered enhancements, and wireless capability fully integrated with its DS Core platform, enabling real-time data access and streamlined digital workflows.
The system introduces integrated near-infrared and fluorescence-based caries detection, smart data compression reducing bandwidth needs by 50%, and SureSmile simulations accelerated by up to 90%, alongside an ergonomic Primescan 2 Cart and reusable steel sleeves for enhanced hygiene and mobility. This launch has been verified by Dentsply Sirona’s official press release (dentsplysirona.com) and covered by Institute of Digital Dentistry (instituteofdigitaldentistry.com) and Inside Dental Hygiene (insidedentalhygiene.com).
The North American and European markets are likely to maintain dominance due to early technology adoption and supportive reimbursement frameworks. Meanwhile, Asia Pacific is projected to exhibit rapid growth, attributed to improving dental infrastructure and growing patient awareness regarding digital dental procedures.
Leading companies in the dental technology space are integrating smart technologies such as artificial intelligence, cloud-based software, wireless connectivity, and enhanced imaging systems into intraoral scanners. These innovations are improving diagnostic accuracy, streamlining digital workflows, and enhancing patient experiences. As dental practices increasingly adopt digital tools, these smart intraoral scanners are setting new standards for efficiency and clinical precision.
Government regulations in the intraoral scanner market are essential for ensuring patient safety, device accuracy, data security, and compliance with medical standards. These regulations guide manufacturers and dental professionals in the safe development, marketing, and clinical use of intraoral scanners across global markets.
Open System modalities are projected to hold a commanding 97.2% share in 2025, driven by flexibility with multiple CAD/CAM systems. Dental Clinics are anticipated to dominate the end-user segment with a 37.1% market share, backed by expanding adoption in routine oral diagnostics and patient-specific treatment planning.
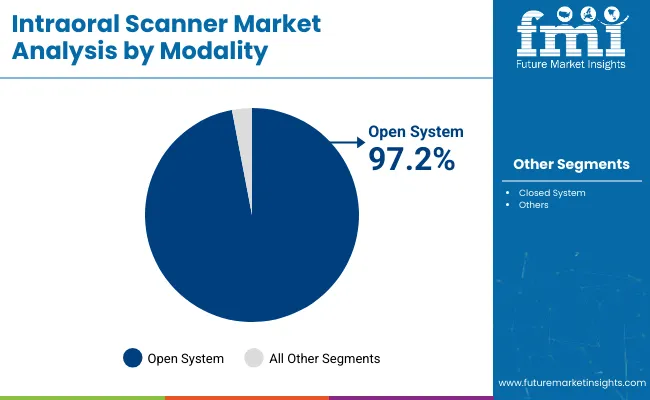
Open System modalities lead the market, accounting for a 97.2% market share in 2025, reflecting their unparalleled adaptability and wide compatibility with various dental CAD/CAM systems. These scanners allow seamless integration with software platforms from multiple manufacturers, offering dental professionals greater freedom in choosing design and milling solutions. Their popularity is further bolstered by the need for customized prosthetic design, multi-lab collaborations, and cross-system functionality essential in modern dental workflows.
Open systems also reduce vendor lock-in risks, enabling cost-efficient upgrades and faster technological adoption. In 2024, several leading scanner brands introduced enhanced open models featuring AI-driven image stitching and real-time 3D modeling. The ability to connect with third-party design software and milling units supports better clinical outcomes and personalized dentistry. As dental practices increasingly embrace digital transformation, open systems remain the preferred choice for ensuring scalability, system compatibility, and innovation alignment in advanced oral healthcare settings.
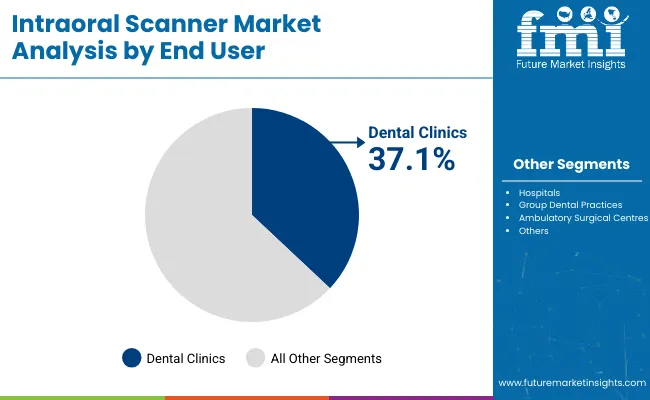
Dental Clinics are expected to dominate the end-user segment with a 37.1% market share in 2025, fueled by rising demand for chairside diagnostics and same-day restorations. Clinics, especially in urban and semi-urban regions, are adopting intraoral scanners to improve diagnostic precision, patient comfort, and treatment turnaround time. These devices allow high-resolution imaging, facilitating immediate digital impressions that eliminate the need for messy conventional molds. Growing emphasis on aesthetic dentistry, implant planning, and orthodontics in dental clinics accelerates scanner deployment.
In 2024, multiple global dental chains upgraded their equipment portfolios with intraoral scanners supporting cloud data storage and remote consultation capabilities. Furthermore, competitive service differentiation drives clinics to invest in the latest scanning technologies, enhancing patient engagement and operational efficiency. Training programs for dentists on digital scanning methods also contribute to higher clinic-based adoption. As patient expectations shift towards quicker, pain-free diagnostics, dental clinics will sustain their position as the top consumer category.
The emergence of small and portable intraoral scanners is bringing about a paradigm change in the use of dental technology. These handheld gadgets meet the need for chairside solutions that are portable and flexible. This mobility enhances the patient experience and the efficient use of resources in dental clinics.
The adaptability of portable scanners improves operational effectiveness by allowing practitioners to move between operatories easily, decreasing downtime, and increasing patient throughput, all of which contribute to increased revenue generation and practice scalability.
In September 2023, Neoss Group, a leading developer in dental implant solutions, proudly unveiled its portable and easy-to-use wireless intraoral scanner, NeoScan 2000. This comes after the successful introduction of the NeoScan™ 1000 last year.
Intraoral scanning technology is revolutionizing data analysis by automating complex procedures through the integration of AI and ML. These scanners promote a data-driven approach to dental care by improving diagnosis accuracy and treatment planning through AI algorithms. This sophisticated automation puts dental offices at the forefront of technological advancement and enhances diagnostic capabilities.
By strategically integrating AI and ML, progressive dentistry practices can improve patient outcomes and strengthen their market position. This is in line with the industry's trend towards data-driven decision-making.
In June 2023, DentalMonitoring, a France-based artificial intelligence (AI) startup, introduced ScanAssist, an AI-guided orthodontic scanner. The device makes the patient experience enjoyable and engaging by using AI-guided instructions and real-time feedback to assist patients in finishing their scans.
Manufacturing oral scanning devices with features to improve the patient experience is a strategic opportunity. Companies that use aspects such as virtual reality distraction tactics, real-time therapeutic visualizations, and patient-friendly interfaces differentiate their offerings in a competitive market.
This patient-centric strategy increases overall patient satisfaction and portrays firms as customer-focused innovators, possibly influencing purchase decisions and encouraging favorable word-of-mouth recommendations within the dentistry industry.
| Attributes | Details |
|---|---|
| Trends |
|
| Opportunities |
|
| Challenges |
|
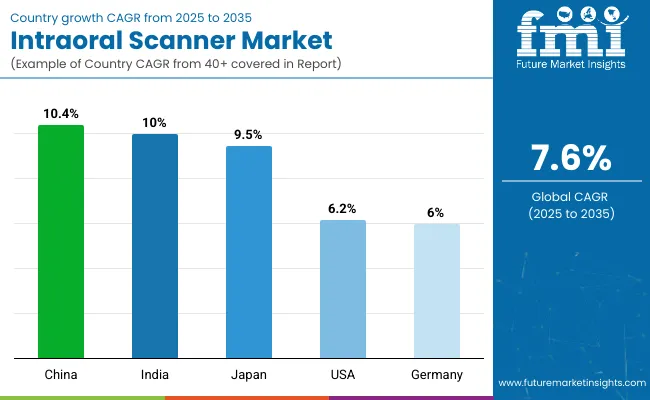
| Country | Value CAGR (2025 to 2035) |
|---|---|
| United States | 6.2% |
| Germany | 6.0% |
| China | 10.4% |
| India | 10.0% |
| Japan | 9.5% |
The demand for intraoral scanners in the United States is predicted to rise at a 6.2% CAGR through 2035. The key factors are:
Germany's intraoral scanner market size is projected to surge at a 6.0% CAGR through 2035. The key drivers are:
The demand for intraoral scanners in China is estimated to thrive at a 10.4% CAGR through 2035. The key factors are:
India's intraoral scanner market growth is predicted at a 10.0% CAGR through 2035. The key drivers are:
The demand for intraoral scanners in Japan is estimated to surge at a 9.5% CAGR through 2035. The key factors are:
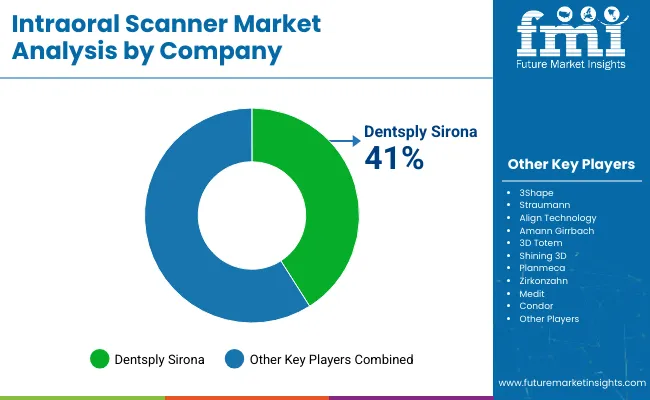
The intraoral scanner market is highly competitive, with prominent competitors striving for market dominance and differentiation in a fast-expanding dental technology industry. Well-known international firms like Dentsply Sirona, Align Technology, and 3Shape use calculated risks to gain a competitive advantage.
These market leaders make large R&D investments to launch state-of-the-art technology to attract dentists seeking creative and effective solutions.
| Report Attributes | Details |
|---|---|
| Market Size (2025) | USD 770.4 million |
| Projected Market Size (2035) | USD 11,600 million |
| CAGR (2025 to 2035) | 7.60% |
| Base Year for Estimation | 2024 |
| Historical Period | 2020 to 2024 |
| Projection Period | 2025 to 2035 |
| Quantitative Units | USD Million (Value) & Thousand Units (Volume) |
| Product Type (Segment 1) | Intraoral Scanners, Benchtop Intraoral Scanners, Stand-Alone CAD/CAM Scanners, 3D Handheld Scanners, Intraoral Cameras, Intraoral Sensors, Stand-Alone Software |
| Modality (Segment 2) | Closed System, Open System |
| End User (Segment 3) | Hospitals, Dental Clinics, Group Dental Practices, Ambulatory Surgical Centres |
| Regions Covered | North America, Latin America, Western Europe, Eastern Europe, Asia Pacific (APAC), Middle East & Africa (MEA), Japan |
| Countries Covered | United States, Canada, Mexico, Brazil, Germany, United Kingdom, France, Italy, China, Japan, South Korea, India, ASEAN Countries, GCC Countries, South Africa |
| Key Players influencing the Market | Dentsply Sirona, 3Shape, Straumann, Align Technology, Amann Girrbach, 3D Totem, Shining 3D, Planmeca, Zirkonzahn, Medit, Condor |
| Additional Attributes | Dollar sales, share, Increasing demand for digital dentistry solutions, Expansion of chairside CAD/CAM systems in clinics, Surge in adoption of open system intraoral scanners, Focus on reducing patient discomfort, Rising preference for real-time 3D imaging, High demand in aesthetic dental procedures. |
The intraoral scanner market is valued at USD 770.4 million in 2025.
The intraoral scanner market size is estimated to increase at a 7.6% CAGR through 2035.
The intraoral scanner market is anticipated to be worth USD 1,600 million by 2035.
Open system intraoral sensors witness high demand in the industry.
The intraoral scanner market in China is predicted to rise at a 10.4% CAGR through 2035.
Table 1: Global Market Value (US$ Million) Forecast by Region, 2019 to 2034
Table 2: Global Market Value (US$ Million) Forecast by Product, 2019 to 2034
Table 3: Global Market Value (US$ Million) Forecast by Modality, 2019 to 2034
Table 4: Global Market Value (US$ Million) Forecast by End User , 2019 to 2034
Table 5: North America Market Value (US$ Million) Forecast by Country, 2019 to 2034
Table 6: North America Market Value (US$ Million) Forecast by Product, 2019 to 2034
Table 7: North America Market Value (US$ Million) Forecast by Modality, 2019 to 2034
Table 8: North America Market Value (US$ Million) Forecast by End User , 2019 to 2034
Table 9: Latin America Market Value (US$ Million) Forecast by Country, 2019 to 2034
Table 10: Latin America Market Value (US$ Million) Forecast by Product, 2019 to 2034
Table 11: Latin America Market Value (US$ Million) Forecast by Modality, 2019 to 2034
Table 12: Latin America Market Value (US$ Million) Forecast by End User , 2019 to 2034
Table 13: Western Europe Market Value (US$ Million) Forecast by Country, 2019 to 2034
Table 14: Western Europe Market Value (US$ Million) Forecast by Product, 2019 to 2034
Table 15: Western Europe Market Value (US$ Million) Forecast by Modality, 2019 to 2034
Table 16: Western Europe Market Value (US$ Million) Forecast by End User , 2019 to 2034
Table 17: Eastern Europe Market Value (US$ Million) Forecast by Country, 2019 to 2034
Table 18: Eastern Europe Market Value (US$ Million) Forecast by Product, 2019 to 2034
Table 19: Eastern Europe Market Value (US$ Million) Forecast by Modality, 2019 to 2034
Table 20: Eastern Europe Market Value (US$ Million) Forecast by End User , 2019 to 2034
Table 21: South Asia and Pacific Market Value (US$ Million) Forecast by Country, 2019 to 2034
Table 22: South Asia and Pacific Market Value (US$ Million) Forecast by Product, 2019 to 2034
Table 23: South Asia and Pacific Market Value (US$ Million) Forecast by Modality, 2019 to 2034
Table 24: South Asia and Pacific Market Value (US$ Million) Forecast by End User , 2019 to 2034
Table 25: East Asia Market Value (US$ Million) Forecast by Country, 2019 to 2034
Table 26: East Asia Market Value (US$ Million) Forecast by Product, 2019 to 2034
Table 27: East Asia Market Value (US$ Million) Forecast by Modality, 2019 to 2034
Table 28: East Asia Market Value (US$ Million) Forecast by End User , 2019 to 2034
Table 29: Middle East and Africa Market Value (US$ Million) Forecast by Country, 2019 to 2034
Table 30: Middle East and Africa Market Value (US$ Million) Forecast by Product, 2019 to 2034
Table 31: Middle East and Africa Market Value (US$ Million) Forecast by Modality, 2019 to 2034
Table 32: Middle East and Africa Market Value (US$ Million) Forecast by End User , 2019 to 2034
Figure 1: Global Market Value (US$ Million) by Product, 2024 to 2034
Figure 2: Global Market Value (US$ Million) by Modality, 2024 to 2034
Figure 3: Global Market Value (US$ Million) by End User , 2024 to 2034
Figure 4: Global Market Value (US$ Million) by Region, 2024 to 2034
Figure 5: Global Market Value (US$ Million) Analysis by Region, 2019 to 2034
Figure 6: Global Market Value Share (%) and BPS Analysis by Region, 2024 to 2034
Figure 7: Global Market Y-o-Y Growth (%) Projections by Region, 2024 to 2034
Figure 8: Global Market Value (US$ Million) Analysis by Product, 2019 to 2034
Figure 9: Global Market Value Share (%) and BPS Analysis by Product, 2024 to 2034
Figure 10: Global Market Y-o-Y Growth (%) Projections by Product, 2024 to 2034
Figure 11: Global Market Value (US$ Million) Analysis by Modality, 2019 to 2034
Figure 12: Global Market Value Share (%) and BPS Analysis by Modality, 2024 to 2034
Figure 13: Global Market Y-o-Y Growth (%) Projections by Modality, 2024 to 2034
Figure 14: Global Market Value (US$ Million) Analysis by End User , 2019 to 2034
Figure 15: Global Market Value Share (%) and BPS Analysis by End User , 2024 to 2034
Figure 16: Global Market Y-o-Y Growth (%) Projections by End User , 2024 to 2034
Figure 17: Global Market Attractiveness by Product, 2024 to 2034
Figure 18: Global Market Attractiveness by Modality, 2024 to 2034
Figure 19: Global Market Attractiveness by End User , 2024 to 2034
Figure 20: Global Market Attractiveness by Region, 2024 to 2034
Figure 21: North America Market Value (US$ Million) by Product, 2024 to 2034
Figure 22: North America Market Value (US$ Million) by Modality, 2024 to 2034
Figure 23: North America Market Value (US$ Million) by End User , 2024 to 2034
Figure 24: North America Market Value (US$ Million) by Country, 2024 to 2034
Figure 25: North America Market Value (US$ Million) Analysis by Country, 2019 to 2034
Figure 26: North America Market Value Share (%) and BPS Analysis by Country, 2024 to 2034
Figure 27: North America Market Y-o-Y Growth (%) Projections by Country, 2024 to 2034
Figure 28: North America Market Value (US$ Million) Analysis by Product, 2019 to 2034
Figure 29: North America Market Value Share (%) and BPS Analysis by Product, 2024 to 2034
Figure 30: North America Market Y-o-Y Growth (%) Projections by Product, 2024 to 2034
Figure 31: North America Market Value (US$ Million) Analysis by Modality, 2019 to 2034
Figure 32: North America Market Value Share (%) and BPS Analysis by Modality, 2024 to 2034
Figure 33: North America Market Y-o-Y Growth (%) Projections by Modality, 2024 to 2034
Figure 34: North America Market Value (US$ Million) Analysis by End User , 2019 to 2034
Figure 35: North America Market Value Share (%) and BPS Analysis by End User , 2024 to 2034
Figure 36: North America Market Y-o-Y Growth (%) Projections by End User , 2024 to 2034
Figure 37: North America Market Attractiveness by Product, 2024 to 2034
Figure 38: North America Market Attractiveness by Modality, 2024 to 2034
Figure 39: North America Market Attractiveness by End User , 2024 to 2034
Figure 40: North America Market Attractiveness by Country, 2024 to 2034
Figure 41: Latin America Market Value (US$ Million) by Product, 2024 to 2034
Figure 42: Latin America Market Value (US$ Million) by Modality, 2024 to 2034
Figure 43: Latin America Market Value (US$ Million) by End User , 2024 to 2034
Figure 44: Latin America Market Value (US$ Million) by Country, 2024 to 2034
Figure 45: Latin America Market Value (US$ Million) Analysis by Country, 2019 to 2034
Figure 46: Latin America Market Value Share (%) and BPS Analysis by Country, 2024 to 2034
Figure 47: Latin America Market Y-o-Y Growth (%) Projections by Country, 2024 to 2034
Figure 48: Latin America Market Value (US$ Million) Analysis by Product, 2019 to 2034
Figure 49: Latin America Market Value Share (%) and BPS Analysis by Product, 2024 to 2034
Figure 50: Latin America Market Y-o-Y Growth (%) Projections by Product, 2024 to 2034
Figure 51: Latin America Market Value (US$ Million) Analysis by Modality, 2019 to 2034
Figure 52: Latin America Market Value Share (%) and BPS Analysis by Modality, 2024 to 2034
Figure 53: Latin America Market Y-o-Y Growth (%) Projections by Modality, 2024 to 2034
Figure 54: Latin America Market Value (US$ Million) Analysis by End User , 2019 to 2034
Figure 55: Latin America Market Value Share (%) and BPS Analysis by End User , 2024 to 2034
Figure 56: Latin America Market Y-o-Y Growth (%) Projections by End User , 2024 to 2034
Figure 57: Latin America Market Attractiveness by Product, 2024 to 2034
Figure 58: Latin America Market Attractiveness by Modality, 2024 to 2034
Figure 59: Latin America Market Attractiveness by End User , 2024 to 2034
Figure 60: Latin America Market Attractiveness by Country, 2024 to 2034
Figure 61: Western Europe Market Value (US$ Million) by Product, 2024 to 2034
Figure 62: Western Europe Market Value (US$ Million) by Modality, 2024 to 2034
Figure 63: Western Europe Market Value (US$ Million) by End User , 2024 to 2034
Figure 64: Western Europe Market Value (US$ Million) by Country, 2024 to 2034
Figure 65: Western Europe Market Value (US$ Million) Analysis by Country, 2019 to 2034
Figure 66: Western Europe Market Value Share (%) and BPS Analysis by Country, 2024 to 2034
Figure 67: Western Europe Market Y-o-Y Growth (%) Projections by Country, 2024 to 2034
Figure 68: Western Europe Market Value (US$ Million) Analysis by Product, 2019 to 2034
Figure 69: Western Europe Market Value Share (%) and BPS Analysis by Product, 2024 to 2034
Figure 70: Western Europe Market Y-o-Y Growth (%) Projections by Product, 2024 to 2034
Figure 71: Western Europe Market Value (US$ Million) Analysis by Modality, 2019 to 2034
Figure 72: Western Europe Market Value Share (%) and BPS Analysis by Modality, 2024 to 2034
Figure 73: Western Europe Market Y-o-Y Growth (%) Projections by Modality, 2024 to 2034
Figure 74: Western Europe Market Value (US$ Million) Analysis by End User , 2019 to 2034
Figure 75: Western Europe Market Value Share (%) and BPS Analysis by End User , 2024 to 2034
Figure 76: Western Europe Market Y-o-Y Growth (%) Projections by End User , 2024 to 2034
Figure 77: Western Europe Market Attractiveness by Product, 2024 to 2034
Figure 78: Western Europe Market Attractiveness by Modality, 2024 to 2034
Figure 79: Western Europe Market Attractiveness by End User , 2024 to 2034
Figure 80: Western Europe Market Attractiveness by Country, 2024 to 2034
Figure 81: Eastern Europe Market Value (US$ Million) by Product, 2024 to 2034
Figure 82: Eastern Europe Market Value (US$ Million) by Modality, 2024 to 2034
Figure 83: Eastern Europe Market Value (US$ Million) by End User , 2024 to 2034
Figure 84: Eastern Europe Market Value (US$ Million) by Country, 2024 to 2034
Figure 85: Eastern Europe Market Value (US$ Million) Analysis by Country, 2019 to 2034
Figure 86: Eastern Europe Market Value Share (%) and BPS Analysis by Country, 2024 to 2034
Figure 87: Eastern Europe Market Y-o-Y Growth (%) Projections by Country, 2024 to 2034
Figure 88: Eastern Europe Market Value (US$ Million) Analysis by Product, 2019 to 2034
Figure 89: Eastern Europe Market Value Share (%) and BPS Analysis by Product, 2024 to 2034
Figure 90: Eastern Europe Market Y-o-Y Growth (%) Projections by Product, 2024 to 2034
Figure 91: Eastern Europe Market Value (US$ Million) Analysis by Modality, 2019 to 2034
Figure 92: Eastern Europe Market Value Share (%) and BPS Analysis by Modality, 2024 to 2034
Figure 93: Eastern Europe Market Y-o-Y Growth (%) Projections by Modality, 2024 to 2034
Figure 94: Eastern Europe Market Value (US$ Million) Analysis by End User , 2019 to 2034
Figure 95: Eastern Europe Market Value Share (%) and BPS Analysis by End User , 2024 to 2034
Figure 96: Eastern Europe Market Y-o-Y Growth (%) Projections by End User , 2024 to 2034
Figure 97: Eastern Europe Market Attractiveness by Product, 2024 to 2034
Figure 98: Eastern Europe Market Attractiveness by Modality, 2024 to 2034
Figure 99: Eastern Europe Market Attractiveness by End User , 2024 to 2034
Figure 100: Eastern Europe Market Attractiveness by Country, 2024 to 2034
Figure 101: South Asia and Pacific Market Value (US$ Million) by Product, 2024 to 2034
Figure 102: South Asia and Pacific Market Value (US$ Million) by Modality, 2024 to 2034
Figure 103: South Asia and Pacific Market Value (US$ Million) by End User , 2024 to 2034
Figure 104: South Asia and Pacific Market Value (US$ Million) by Country, 2024 to 2034
Figure 105: South Asia and Pacific Market Value (US$ Million) Analysis by Country, 2019 to 2034
Figure 106: South Asia and Pacific Market Value Share (%) and BPS Analysis by Country, 2024 to 2034
Figure 107: South Asia and Pacific Market Y-o-Y Growth (%) Projections by Country, 2024 to 2034
Figure 108: South Asia and Pacific Market Value (US$ Million) Analysis by Product, 2019 to 2034
Figure 109: South Asia and Pacific Market Value Share (%) and BPS Analysis by Product, 2024 to 2034
Figure 110: South Asia and Pacific Market Y-o-Y Growth (%) Projections by Product, 2024 to 2034
Figure 111: South Asia and Pacific Market Value (US$ Million) Analysis by Modality, 2019 to 2034
Figure 112: South Asia and Pacific Market Value Share (%) and BPS Analysis by Modality, 2024 to 2034
Figure 113: South Asia and Pacific Market Y-o-Y Growth (%) Projections by Modality, 2024 to 2034
Figure 114: South Asia and Pacific Market Value (US$ Million) Analysis by End User , 2019 to 2034
Figure 115: South Asia and Pacific Market Value Share (%) and BPS Analysis by End User , 2024 to 2034
Figure 116: South Asia and Pacific Market Y-o-Y Growth (%) Projections by End User , 2024 to 2034
Figure 117: South Asia and Pacific Market Attractiveness by Product, 2024 to 2034
Figure 118: South Asia and Pacific Market Attractiveness by Modality, 2024 to 2034
Figure 119: South Asia and Pacific Market Attractiveness by End User , 2024 to 2034
Figure 120: South Asia and Pacific Market Attractiveness by Country, 2024 to 2034
Figure 121: East Asia Market Value (US$ Million) by Product, 2024 to 2034
Figure 122: East Asia Market Value (US$ Million) by Modality, 2024 to 2034
Figure 123: East Asia Market Value (US$ Million) by End User , 2024 to 2034
Figure 124: East Asia Market Value (US$ Million) by Country, 2024 to 2034
Figure 125: East Asia Market Value (US$ Million) Analysis by Country, 2019 to 2034
Figure 126: East Asia Market Value Share (%) and BPS Analysis by Country, 2024 to 2034
Figure 127: East Asia Market Y-o-Y Growth (%) Projections by Country, 2024 to 2034
Figure 128: East Asia Market Value (US$ Million) Analysis by Product, 2019 to 2034
Figure 129: East Asia Market Value Share (%) and BPS Analysis by Product, 2024 to 2034
Figure 130: East Asia Market Y-o-Y Growth (%) Projections by Product, 2024 to 2034
Figure 131: East Asia Market Value (US$ Million) Analysis by Modality, 2019 to 2034
Figure 132: East Asia Market Value Share (%) and BPS Analysis by Modality, 2024 to 2034
Figure 133: East Asia Market Y-o-Y Growth (%) Projections by Modality, 2024 to 2034
Figure 134: East Asia Market Value (US$ Million) Analysis by End User , 2019 to 2034
Figure 135: East Asia Market Value Share (%) and BPS Analysis by End User , 2024 to 2034
Figure 136: East Asia Market Y-o-Y Growth (%) Projections by End User , 2024 to 2034
Figure 137: East Asia Market Attractiveness by Product, 2024 to 2034
Figure 138: East Asia Market Attractiveness by Modality, 2024 to 2034
Figure 139: East Asia Market Attractiveness by End User , 2024 to 2034
Figure 140: East Asia Market Attractiveness by Country, 2024 to 2034
Figure 141: Middle East and Africa Market Value (US$ Million) by Product, 2024 to 2034
Figure 142: Middle East and Africa Market Value (US$ Million) by Modality, 2024 to 2034
Figure 143: Middle East and Africa Market Value (US$ Million) by End User , 2024 to 2034
Figure 144: Middle East and Africa Market Value (US$ Million) by Country, 2024 to 2034
Figure 145: Middle East and Africa Market Value (US$ Million) Analysis by Country, 2019 to 2034
Figure 146: Middle East and Africa Market Value Share (%) and BPS Analysis by Country, 2024 to 2034
Figure 147: Middle East and Africa Market Y-o-Y Growth (%) Projections by Country, 2024 to 2034
Figure 148: Middle East and Africa Market Value (US$ Million) Analysis by Product, 2019 to 2034
Figure 149: Middle East and Africa Market Value Share (%) and BPS Analysis by Product, 2024 to 2034
Figure 150: Middle East and Africa Market Y-o-Y Growth (%) Projections by Product, 2024 to 2034
Figure 151: Middle East and Africa Market Value (US$ Million) Analysis by Modality, 2019 to 2034
Figure 152: Middle East and Africa Market Value Share (%) and BPS Analysis by Modality, 2024 to 2034
Figure 153: Middle East and Africa Market Y-o-Y Growth (%) Projections by Modality, 2024 to 2034
Figure 154: Middle East and Africa Market Value (US$ Million) Analysis by End User , 2019 to 2034
Figure 155: Middle East and Africa Market Value Share (%) and BPS Analysis by End User , 2024 to 2034
Figure 156: Middle East and Africa Market Y-o-Y Growth (%) Projections by End User , 2024 to 2034
Figure 157: Middle East and Africa Market Attractiveness by Product, 2024 to 2034
Figure 158: Middle East and Africa Market Attractiveness by Modality, 2024 to 2034
Figure 159: Middle East and Africa Market Attractiveness by End User , 2024 to 2034
Figure 160: Middle East and Africa Market Attractiveness by Country, 2024 to 2034


Full Research Suite comprises of:
Market outlook & trends analysis
Interviews & case studies
Strategic recommendations
Vendor profiles & capabilities analysis
5-year forecasts
8 regions and 60+ country-level data splits
Market segment data splits
12 months of continuous data updates
DELIVERED AS:
PDF EXCEL ONLINE
Global Intraoral IOL Scanner Market Analysis – Size, Share & Forecast 2024-2034
3D Scanners Market Size and Share Forecast Outlook 2025 to 2035
Barcode Scanner Market Size and Share Forecast Outlook 2025 to 2035
Mineral Scanner Market Size and Share Forecast Outlook 2025 to 2035
Baggage Scanner Market Growth, Trends & Forecast 2025 to 2035
Vehicle Scanner Market Growth – Trends & Forecast 2024-2034
Thermal Scanner Market Growth – Trends & Forecast 2020-2030
3D Laser Scanner Market Growth - Trends & Forecast 2025 to 2035
Micro-CT Scanners Market
Narcotics Scanner Market Size and Share Forecast Outlook 2025 to 2035
Full Body Scanner Market Analysis - Size, Share & Forecast 2025 to 2035
Safety Laser Scanner Market Size and Share Forecast Outlook 2025 to 2035
Mobile LiDAR Scanner Market Size and Share Forecast Outlook 2025 to 2035
Robotic X-ray Scanner Market Size and Share Forecast Outlook 2025 to 2035
Polygon Mirror Scanner Motor Market Size and Share Forecast Outlook 2025 to 2035
Industrial Fixed Scanner Market Size and Share Forecast Outlook 2025 to 2035
Handheld Retinal Scanners Market
In-Counter Barcode Scanners Market Size and Share Forecast Outlook 2025 to 2035
Industrial Barcode Scanners Market Analysis - Size and Share Forecast Outlook 2025 to 2035
Handheld Ultrasound Scanner Market Analysis – Trends & Forecast 2024-2034

Thank you!
You will receive an email from our Business Development Manager. Please be sure to check your SPAM/JUNK folder too.
Chat With
MaRIA