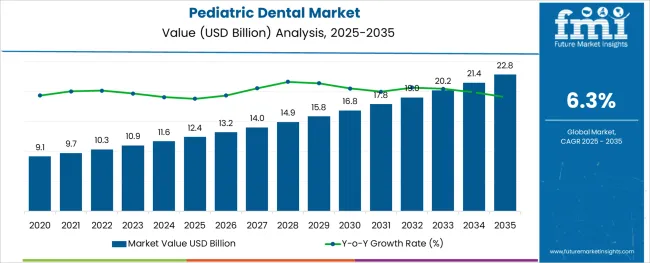
The Pediatric Dental Market is estimated to be valued at USD 12.4 billion in 2025 and is projected to reach USD 22.8 billion by 2035, registering a compound annual growth rate (CAGR) of 6.3% over the forecast period.

The alginic acid market is undergoing consistent growth, propelled by rising demand from food processing, pharmaceutical formulations, and cosmetic applications. A growing focus on natural and sustainable ingredients in manufacturing processes has positioned alginic acid as a preferred biopolymer across industries.
The market is further supported by its diverse functional benefits, including water retention, gelling, and stabilizing properties, which make it indispensable in high-performance formulations. Increased regulatory acceptance of alginates as safe additives and the push towards cleaner labeling in food and personal care products have reinforced their adoption.
Ongoing innovation in extraction technologies and the utilization of algae as a renewable resource are paving the way for cost-effective production and expanded applications, ensuring sustained market expansion in the coming years.
The market is segmented by Disease Type, Type, and Procedure and region. By Disease Type, the market is divided into Dental Caries, Enamel Disorders, and Other Disease Types. In terms of Type, the market is classified into Primary and Permanent. Based on Procedure, the market is segmented into Tooth-Colored Fillings, Pulpotomies, Stainless Steel Crowns, Dental Cleaning, and Other Procedures. Regionally, the market is classified into North America, Latin America, Western Europe, Eastern Europe, Balkan & Baltic Countries, Russia & Belarus, Central Asia, East Asia, South Asia & Pacific, and the Middle East & Africa.
When segmented by salts, sodium alginate is expected to command 27.5% of the market revenue in 2025, marking it as the leading subsegment in this category. This leadership has been driven by its superior solubility, ease of incorporation into formulations, and versatility in a wide range of applications.
Its ability to form stable gels and maintain viscosity under varying conditions has made it highly sought after in both food and pharmaceutical sectors. Manufacturers have prioritized sodium alginate due to its consistent performance, cost-effectiveness, and regulatory acceptance, which have collectively strengthened its position.
The segment’s prominence has also been enhanced by its adaptability to evolving consumer preferences for plant-derived and sustainable ingredients, reinforcing its market share.
Segmented by end user industry, the food industry is projected to hold 33.0% of the market revenue in 2025, positioning it as the most prominent sector. This dominance has been shaped by the industry’s increasing reliance on alginic acid and its derivatives to deliver desirable textures, stabilize emulsions, and improve shelf life of processed foods.
As consumer demand for clean label and natural additives has intensified, the food sector has responded by integrating alginates into bakery, dairy, and confectionery products. Enhanced production efficiency and compliance with food safety standards have further encouraged widespread use.
The segment’s leadership has also been supported by product differentiation strategies where alginates contribute to premium quality and innovation, securing their role in modern food formulations.
When analyzed by functionality, thickening agents are forecast to account for 29.0% of the market revenue in 2025, establishing themselves as the dominant functional category. This preeminence has been underpinned by the growing need for consistent texture and viscosity in a wide array of end products.
Alginic acid’s natural origin and high efficiency in creating uniform, stable thickness without altering taste or color have solidified its appeal. The demand for thickeners in both edible and topical applications has expanded, with manufacturers leveraging its rheological properties to meet performance and regulatory requirements.
The functionality’s leading share has also been reinforced by the ability to deliver cost savings through lower dosages and its compatibility with other ingredients, securing its position as an indispensable component in formulation strategies.
As per the Pediatric Dental industry research by Future Market Insights - a market research and competitive intelligence provider, historically, from 2020 to 2024, the market value of the Pediatric Dental industry increased at around 6.2% CAGR, wherein, countries such as the USA, UK, China, Japan, and South Korea held a significant share in the global market. Owing to this, the pediatric dental market is projected to grow at a CAGR of 7.4% over the coming 10 years.
The advancement in technology of dental operations can be credited to the pediatric dental market's growth. Some of the children develop a dental fear that necessitates sedation dentistry as a safe and effective treatment option. Nitrous oxide is a type of general anesthesia that is increasingly being utilized in children's dentistry.
Pain-free mouth injections are used in pediatric dentistry to enhance the patient experience. The instruments and approaches are used to assist children to feel less pain and have less dental fear. This approach provides for faster treatments and higher patient cooperation.
Many people prefer a minimally invasive technique because of its advantages. CariVu, varnish, dental sealants, fluoride, and digital X-rays are examples of chemicals that can either intervene before restorative treatment or avoid dental disorders entirely. One of the noticeable developments in pediatric dentistry is the shift toward preventative care.
The American Academy of Pediatric Dentistry (AAPD) predicts that the growing number of pediatric dentists in America will boost by more than 60% within the next decade. Based on AAPD, the overall number of pediatric dentists practicing in the USA has roughly doubled since 2001. Dental work as a pediatric dentist is anticipated to remain solid in the years to come, hence the industry's growth.
Over the projection period, Asia Pacific is expected to be the fastest-growing regional market. In the recent past, dental problems have gained significant attention in the Asia-Pacific countries. The surge in urbanization has led to the increasing expenditure of people on dental health. Besides, major players' investments in developing countries like China and India have boosted consumer confidence. In addition, the increasing prevalence of oral health diseases is expected to drive regional market expansion in the next years.

With a market share of more than 35% in 2024, the USA dominated the pediatric dental market. The vast patient base needed to fix varied dental health issues has ensured the success of dental work throughout the globe, like in the USA, and has contributed to the development of the healthcare ecosystem in many countries. According to Richmond Dental and Medical, the USA has 196,000 dentists. With the constant surge in the number of dental practitioners, the market in the country is expected to flourish in the forthcoming years.
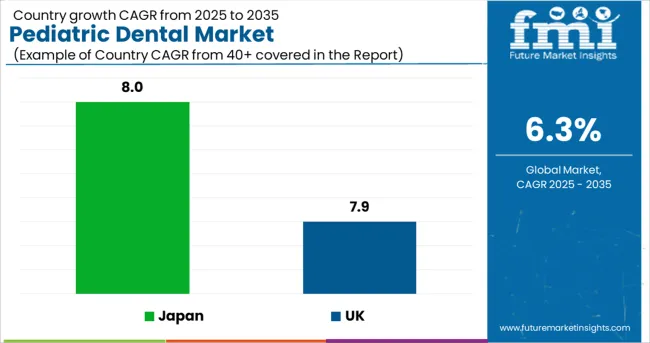
The market in the UK is expected to reach a valuation of USD 22.8 Billion by 2035. From 2025 to 2035, the market in the country is expected to gross an absolute dollar opportunity of USD 561 Million, growing at a CAGR of 7.9%.
In Japan, the market is projected to reach USD 848 Million by 2035, growing at a CAGR of 8% from 2025 to 2035. During the forecast period, the market is expected to gross an absolute dollar opportunity of USD 457 Million.
With a share of revenue of more than 35% in 2024, the dental caries category led the market. The disarray among deciduous teeth is the result of more substantial dental problems. Infections, persistent pain, and other symptoms arise from dental caries in children. The condition of a kid's teeth at an early age affects his ability to discover social and emotional control. The need for treatment is likely to increase, as children get older. It will only be necessary to apply the remedy periodically to avoid an unhealthy lifestyle, and the affliction is projected to grow with future generations.
Dentists prefer to apply diet fluoride supplementation and fluoride varnish to the teeth of children who are at significant risk of dental caries as a preventive measure. Fluoride supplementation should be taken exactly as dental practitioners recommend. Early Childhood development of caries is a sugar-driven, multifactorial, bacterial-mediated kind of caries that causes phasic demineralization and remineralization of hard dental tissue. The therapy of early childhood caries (ECC) is expected to drive market expansion.
With a market share of more than 30% in 2024, the dental cleaning (prophylaxis) category led the market. The increase in the number of dental procedures carried out in dental facilities and hospitals is due to the rise in the number of dental prophylaxis treatments. Plaque that is untreatable through mass tooth brushing is removed with dental prophylaxis. The teeth must be cleaned at recurring intervals of about 8 to 16 weeks. This is more frequent for patients unable to clean their teeth themselves.
A yearly mouth debridement may be needed due to the accumulation of tartar. Hand tools, such as a micro-ultrasonic scaler are used during the procedure. Various antimicrobial treatments, periodontal disinfection, desensitizing gels, and full-mouth debridements are a few of the dental procedures available. Demand for such procedures is rising, due chiefly to a rise in oral hygiene problems, which will boost the segment's growth.
Malocclusion is a global dental issue that is on the rise. The most frequent dental problems encountered in children that are significantly associated with malocclusion are pulpal, dental trauma, dental caries, periapical lesions, oral habits, and developmental abnormalities. The segment's growth is expected to be boosted by the diagnosis and treatment of the condition.
In young toddlers with primary teeth, dental trauma is a regular occurrence. The greater physical mobility that comes with learning to walk and run is a big reason for this. Mandibular primary teeth are less vulnerable to trauma than anterior maxillary primary teeth. The most prevalent types of primary tooth injuries include luxation, avulsion, and crown fracture. The segment's expansion is likely to be fueled by the growing problem of dental trauma.

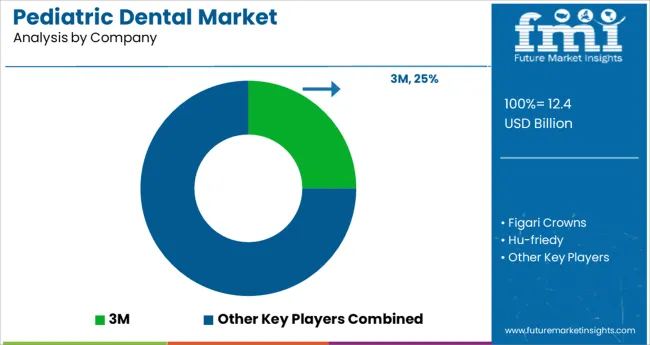
The market is fiercely competitive, with a large number of domestic and international companies. The key players operating in the market are 3M, Hu-Friedy Mfg. Co., LLC, Kinder Krowns, Figaro Crowns, Inc., Acero Crowns, Sprig Oral Health Technologies, Inc., Edelweiss Dentistry Products GmbH, SML, Cheng Crowns, and Dentsply Sirona.
Some of the recent developments of key Pediatric Dental providers are as follows:
Similarly, recent developments related to companies in Pediatric Dental Market have been tracked by the team at Future Market Insights, which are available in the full report.
The global pediatric dental market is estimated to be valued at USD 12.4 billion in 2025.
It is projected to reach USD 22.8 billion by 2035.
The market is expected to grow at a 6.3% CAGR between 2025 and 2035.
The key product types are dental caries, enamel disorders and other disease types.
primary segment is expected to dominate with a 55.0% industry share in 2025.


Full Research Suite comprises of:
Market outlook & trends analysis
Interviews & case studies
Strategic recommendations
Vendor profiles & capabilities analysis
5-year forecasts
8 regions and 60+ country-level data splits
Market segment data splits
12 months of continuous data updates
DELIVERED AS:
PDF EXCEL ONLINE
Pediatric Measuring Devices Market Size and Share Forecast Outlook 2025 to 2035
Pediatric Supplement Market - Size, Share, and Forecast Outlook 2025 to 2035
Pediatric Tube Feeding Market Analysis by Formula Type, Feeding Method, Form, Specific Needs, Dietary Preference, Age, Distribution Channel and Region Through 2035
Pediatric Home Healthcare Market - Growth & Demand Trends 2025 to 2035
Pediatric Obesity Management Market Analysis by Drug Class, Route of Administration, Distribution Channel and Region: Forecast for 2025 to 2035
Pediatric Heart Valve Repair and Replacement Analysis by Product, Induction, End Users and Region-2025 to 2035
Pediatric Nutrition Market – Growth, Demand & Child Health Trends
Global Pediatric Diabetes Therapeutic Market Analysis – Size, Share & Forecast 2024-2034
Global Pediatric Clinical Trial Market Analysis – Size, Share & Forecast 2024-2034
Pediatric Vitrectomy Market
Pediatric Nasal Cannula Market
Adult and Pediatric Hemoconcentrators Market Size and Share Forecast Outlook 2025 to 2035
Calcium Gluconate Demand Analysis - Size Share and Forecast Outlook 2025 to 2035
Dental Implant and Prosthetic Market Size and Share Forecast Outlook 2025 to 2035
Dental Imaging Equipment Market Forecast and Outlook 2025 to 2035
Dental Wounds Treatment Market Size and Share Forecast Outlook 2025 to 2035
Dental Radiometer Market Size and Share Forecast Outlook 2025 to 2035
Dental Anaesthetic Market Size and Share Forecast Outlook 2025 to 2035
Dental Diamond Bur Market Size and Share Forecast Outlook 2025 to 2035
Dental Laboratory Market Size and Share Forecast Outlook 2025 to 2035

Thank you!
You will receive an email from our Business Development Manager. Please be sure to check your SPAM/JUNK folder too.
Chat With
MaRIA