Pediatric Measuring Devices Market Size and Share Forecast Outlook 2025 to 2035

The Pediatric Measuring Devices Market is estimated to be valued at USD 1391.4 million in 2025 and is projected to reach USD 2119.7 million by 2035, registering a compound annual growth rate (CAGR) of 4.3% over the forecast period.
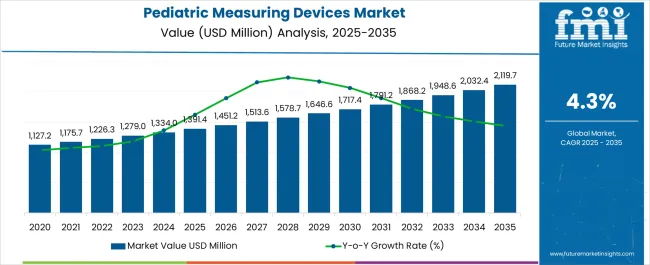
Quick Stats for Pediatric Measuring Devices Market

  • Pediatric Measuring Devices Market Value (2025): USD 1391.4 million
  • Pediatric Measuring Devices Market Forecast Value (2035): USD 2119.7 million
  • Pediatric Measuring Devices Market Forecast CAGR: 4.3%
  • Leading Segment in Pediatric Measuring Devices Market in 2025: Infantometer (28.9%)
  • Key Growth Regions in Pediatric Measuring Devices Market: North America, Asia-Pacific, Europe
  • Top Key Players in Pediatric Measuring Devices Market: Seca GmbH & Co. KG, Natus Medical Incorporated, Hill-Rom Holdings, Inc., Medtronic plc, GE Healthcare, Philips Healthcare, Welch Allyn, Inc., Masimo Corporation, Drägerwerk AG & Co. KGaA, Invacare Corporation, Smiths Medical, Cardinal Health, Inc., Omron Healthcare, Inc.

Pediatric Measuring Devices Market Market Value Analysis

Pediatric Measuring Devices Market Key Takeaways

Metric Value
Pediatric Measuring Devices Market Estimated Value in (2025 E) USD 1391.4 million
Pediatric Measuring Devices Market Forecast Value in (2035 F) USD 2119.7 million
Forecast CAGR (2025 to 2035) 4.3%

Why is the Pediatric Measuring Devices Market Growing?

The Pediatric Measuring Devices market is experiencing steady growth, driven by increasing demand for accurate and efficient measurement tools in pediatric healthcare settings. Rising awareness of child health monitoring, early diagnosis, and nutritional assessments is fueling adoption in hospitals, clinics, and research institutions. Technological advancements in electronic measurement devices, data integration, and mobile-enabled systems are improving precision, reducing errors, and enabling real-time monitoring of pediatric growth parameters.

The integration of user-friendly interfaces and digital recording capabilities supports healthcare professionals in capturing and tracking critical patient information efficiently. Growing investments in pediatric healthcare infrastructure, particularly in emerging markets, along with government initiatives for child health and nutrition monitoring, are further boosting market expansion.

The focus on portable, scalable, and versatile measurement solutions has encouraged the adoption of devices suitable for both clinical and home settings As healthcare providers increasingly prioritize accurate, standardized, and automated measurement solutions, the Pediatric Measuring Devices market is expected to maintain consistent growth over the coming decade.

Segmental Analysis

The pediatric measuring devices market is segmented by device type, technology type, configuration type, end user type, and geographic regions. By device type, pediatric measuring devices market is divided into Infantometer, Mobile Measuring Mat, Height Measuring Rods, Head Circumference Measuring Tape, Stadiometer, and Others. In terms of technology type, pediatric measuring devices market is classified into Electronic Pediatric Measuring Device and Mechanical Pediatric Measuring Device. Based on configuration type, pediatric measuring devices market is segmented into Mobile, Bench-Top, Wall-Mounted, and Floor-Standing. By end user type, pediatric measuring devices market is segmented into Hospitals, Clinics, and Others. Regionally, the pediatric measuring devices industry is classified into North America, Latin America, Western Europe, Eastern Europe, Balkan & Baltic Countries, Russia & Belarus, Central Asia, East Asia, South Asia & Pacific, and the Middle East & Africa.
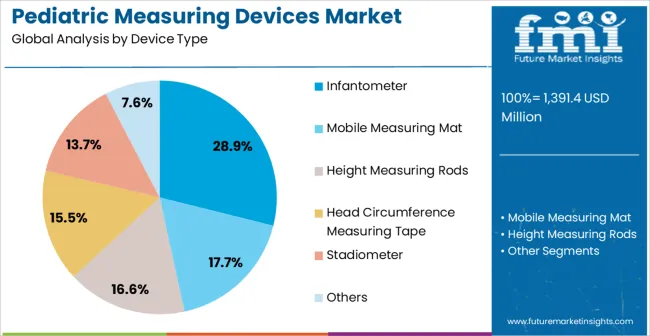
Insights into the Infantometer Device Type Segment

Pediatric Measuring Devices Market Analysis By Device Type

The infantometer device type segment is projected to hold 28.9% of the market revenue in 2025, establishing it as the leading device type. Its prominence is being driven by the critical need to measure infant length accurately for clinical assessment, growth monitoring, and early detection of developmental anomalies. Infantometers provide precise readings and are designed for safe and comfortable use in hospital, clinic, and research environments.

The ability to deliver consistent, reliable measurements without complex calibration requirements has reinforced preference among healthcare providers. Integration with electronic data recording systems further enhances utility, enabling efficient tracking of pediatric growth over time.

Advances in design, safety features, and portability have expanded the applicability of infantometers beyond traditional hospital settings As pediatric healthcare continues to emphasize early intervention and standardized growth assessments, the infantometer segment is expected to maintain its leading position, driven by accuracy, reliability, and ease of use.
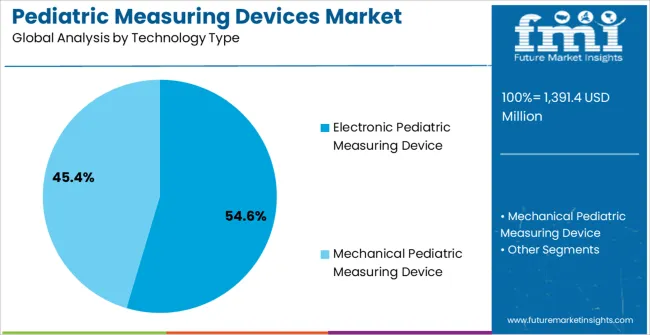
Insights into the Electronic Pediatric Measuring Device Technology Type Segment

Pediatric Measuring Devices Market Analysis By Technology Type

The electronic pediatric measuring device technology segment is anticipated to account for 54.6% of the market revenue in 2025, making it the leading technology type. Growth is being driven by the demand for precise, automated, and digitally integrated measurement tools that minimize human error and enhance data reliability. Electronic devices enable seamless recording, storage, and analysis of pediatric growth metrics, supporting clinical decision-making and long-term patient tracking.

Advancements in sensor technology, digital interfaces, and connectivity features have improved measurement speed, accuracy, and ease of use. The integration of electronic devices with hospital information systems allows real-time data access, trend analysis, and reporting, further strengthening adoption.

Increased focus on quality healthcare delivery, compliance with pediatric care standards, and the need for standardized measurement protocols are key factors supporting the growth of electronic measurement solutions As healthcare facilities continue to adopt digital solutions to improve patient outcomes and operational efficiency, the electronic pediatric measuring device segment is expected to remain the market leader.
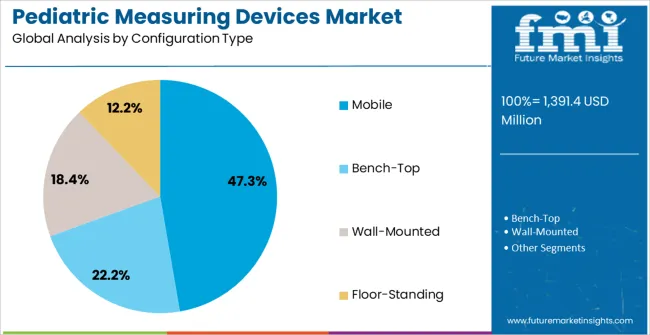
Insights into the Mobile Configuration Type Segment

Pediatric Measuring Devices Market Analysis By Configuration Type

The mobile configuration type segment is projected to hold 47.3% of the market revenue in 2025, establishing it as the leading configuration. Its prominence is being driven by the growing need for portable, flexible, and easy-to-use measurement solutions that can be employed in clinical, home, and field settings. Mobile devices allow healthcare providers to conduct pediatric assessments with minimal space and infrastructure requirements, enhancing accessibility and convenience.

Integration with electronic recording systems and mobile applications enables real-time data capture, remote monitoring, and trend analysis, improving decision-making and patient care. The portability of mobile configurations supports outreach programs, community health initiatives, and home-based monitoring, broadening the use cases beyond traditional healthcare facilities.

Advances in battery life, ergonomic design, and user-friendly interfaces have further reinforced adoption As pediatric healthcare increasingly emphasizes accessibility, efficiency, and continuous monitoring, the mobile configuration segment is expected to maintain its leadership, supported by technological innovation and rising demand for versatile measurement solutions.

Market Overview

Pediatric Measuring Devices: Market Insights

Pediatric measuring device is used to carry out health diagnosis of the infants and children below 18 years. These devices are intended to be used as treatment and care for infants. Pediatric measuring devices are specifically designed for children and proves to be a challenging task for manufacturers as infants and new born babies have a flexible body structure.

Pediatric measuring devices have vast application in hospitals, clinics, infants care center, and are used by doctors, pediatricians and other child specialists which increases the demand in pediatric measuring devices market. Various pediatric measuring devices are available in the market that are used to detect distinct disease conditions such as overweight, underweight, short stature, restricted growth.

Pediatric measuring devices are used to reassure the wellbeing of children by measuring, plotting and interpreting growth patterns in infants as well as toddlers. On the basis of device type, pediatric measuring devices are broadly categorized into five types including infantometer, mobile measuring mat, height measuring rods, head circumference measuring tape, stadiometer (infant measuring board).

These measuring devices is further categorized on the basis of technology that includes mechanical and electronic measuring devices for pediatrics. Pediatric measuring devices are also available in different configurations majorly including mobile, tabletop, wall-mounted, and floor-standing. These devices should be well calibrated before carrying out any measurements.

Specific regulations for using digital electronic scales and other measuring devices for infants have been made by the regional regulatory which is mandatory to be followed while using any of the pediatric measuring device. With the rising rate of child birth the demand for pediatric measuring devices is increasing and thus contribute majorly to the revenue generation in pediatric measuring devices market.

These Pediatric Measuring devices are broadly used to diagnose health conditions of infants and toddlers. Pediatric Measuring devices market on the other hand is gaining profit due to rising incidence of premature births coupled with introduction of innovative pediatric measuring devices in the market.

Birth deformities is one of the main reason which drives the sales of pediatric measuring devices. Increased technological innovations in the pediatric devices market tend to propel the growth of pediatric measuring devices market across the globe.

Pediatric Measuring devices also find increased application in disease areas including mainly including nephrology and hypertension. This is further anticipated to drive the demand for pediatric measuring devices and thereby increasing revenue generation in pediatric measuring devices market.
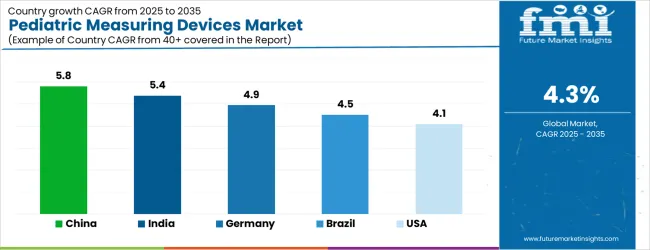
Analysis of Pediatric Measuring Devices Market By Key Countries

Pediatric Measuring Devices Market Cagr Analysis By Country

Country CAGR
China 5.8%
India 5.4%
Germany 4.9%
Brazil 4.5%
USA 4.1%
UK 3.7%
Japan 3.2%

Country-wise Analysis

The Pediatric Measuring Devices Market is expected to register a CAGR of 4.3% during the forecast period, exhibiting varied country level momentum. China leads with the highest CAGR of 5.8%, followed by India at 5.4%. Developed markets such as Germany, France, and the UK continue to expand steadily, while the USA is likely to grow at consistent rates. Japan posts the lowest CAGR at 3.2%, yet still underscores a broadly positive trajectory for the global Pediatric Measuring Devices Market. In 2024, Germany held a dominant revenue in the Western Europe market and is expected to grow with a CAGR of 4.9%. The USA Pediatric Measuring Devices Market is estimated to be valued at USD 476.4 million in 2025 and is anticipated to reach a valuation of USD 476.4 million by 2035. Sales are projected to rise at a CAGR of 0.0% over the forecast period between 2025 and 2035. While Japan and South Korea markets are estimated to be valued at USD 71.0 million and USD 46.7 million respectively in 2025.
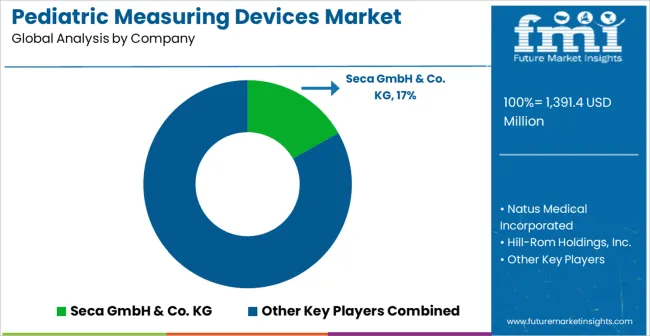
Key Players in the Pediatric Measuring Devices Market

Pediatric Measuring Devices Market Analysis By Company

  • Seca GmbH & Co. KG
  • Natus Medical Incorporated
  • Hill-Rom Holdings, Inc.
  • Medtronic plc
  • GE Healthcare
  • Philips Healthcare
  • Welch Allyn, Inc.
  • Masimo Corporation
  • Drägerwerk AG & Co. KGaA
  • Invacare Corporation
  • Smiths Medical
  • Cardinal Health, Inc.
  • Omron Healthcare, Inc.

Scope of the Report

Item Value
Quantitative Units USD 1391.4 Million
Device Type Infantometer, Mobile Measuring Mat, Height Measuring Rods, Head Circumference Measuring Tape, Stadiometer, and Others
Technology Type Electronic Pediatric Measuring Device and Mechanical Pediatric Measuring Device
Configuration Type Mobile, Bench-Top, Wall-Mounted, and Floor-Standing
End User Type Hospitals, Clinics, and Others
Regions Covered North America, Europe, Asia-Pacific, Latin America, Middle East & Africa
Country Covered United States, Canada, Germany, France, United Kingdom, China, Japan, India, Brazil, South Africa
Key Companies Profiled Seca GmbH & Co. KG, Natus Medical Incorporated, Hill-Rom Holdings, Inc., Medtronic plc, GE Healthcare, Philips Healthcare, Welch Allyn, Inc., Masimo Corporation, Drägerwerk AG & Co. KGaA, Invacare Corporation, Smiths Medical, Cardinal Health, Inc., and Omron Healthcare, Inc.

Pediatric Measuring Devices Market by Segments

Device Type:

  • Infantometer
  • Mobile Measuring Mat
  • Height Measuring Rods
  • Head Circumference Measuring Tape
  • Stadiometer
  • Others

Technology Type:

  • Electronic Pediatric Measuring Device
  • Mechanical Pediatric Measuring Device

Configuration Type:

  • Mobile
  • Bench-Top
  • Wall-Mounted
  • Floor-Standing

End User Type:

  • Hospitals
  • Clinics
  • Others

Region:

  • North America
    • USA
    • Canada
    • Mexico
  • Latin America
    • Brazil
    • Chile
    • Rest of Latin America
  • Western Europe
    • Germany
    • UK
    • Italy
    • Spain
    • France
    • Nordic
    • BENELUX
    • Rest of Western Europe
  • Eastern Europe
    • Russia
    • Poland
    • Hungary
    • Balkan & Baltic
    • Rest of Eastern Europe
  • East Asia
    • China
    • Japan
    • South Korea
  • South Asia and Pacific
    • India
    • ASEAN
    • Australia & New Zealand
    • Rest of South Asia and Pacific
  • Middle East & Africa
    • Kingdom of Saudi Arabia
    • Other GCC Countries
    • Turkiye
    • South Africa
    • Other African Union
    • Rest of Middle East & Africa

Table of Content

  1. Executive Summary
    • Global Market Outlook
    • Demand-side Trends
    • Supply-side Trends
    • Technology Roadmap Analysis
    • Analysis and Recommendations
  2. Market Overview
    • Market Coverage / Taxonomy
    • Market Definition / Scope / Limitations
  3. Market Background
    • Market Dynamics
      • Drivers
      • Restraints
      • Opportunity
      • Trends
    • Scenario Forecast
      • Demand in Optimistic Scenario
      • Demand in Likely Scenario
      • Demand in Conservative Scenario
    • Opportunity Map Analysis
    • Product Life Cycle Analysis
    • Supply Chain Analysis
    • Investment Feasibility Matrix
    • Value Chain Analysis
    • PESTLE and Porter’s Analysis
    • Regulatory Landscape
    • Regional Parent Market Outlook
    • Production and Consumption Statistics
    • Import and Export Statistics
  4. Global Market Analysis 2020 to 2024 and Forecast, 2025 to 2035
    • Historical Market Size Value (USD Million) Analysis, 2020 to 2024
    • Current and Future Market Size Value (USD Million) Projections, 2025 to 2035
      • Y-o-Y Growth Trend Analysis
      • Absolute $ Opportunity Analysis
  5. Global Market Pricing Analysis 2020 to 2024 and Forecast 2025 to 2035
  6. Global Market Analysis 2020 to 2024 and Forecast 2025 to 2035, By Device Type
    • Introduction / Key Findings
    • Historical Market Size Value (USD Million) Analysis By Device Type , 2020 to 2024
    • Current and Future Market Size Value (USD Million) Analysis and Forecast By Device Type , 2025 to 2035
      • Infantometer
      • Mobile Measuring Mat
      • Height Measuring Rods
      • Head Circumference Measuring Tape
      • Stadiometer
      • Others
    • Y-o-Y Growth Trend Analysis By Device Type , 2020 to 2024
    • Absolute $ Opportunity Analysis By Device Type , 2025 to 2035
  7. Global Market Analysis 2020 to 2024 and Forecast 2025 to 2035, By Technology Type
    • Introduction / Key Findings
    • Historical Market Size Value (USD Million) Analysis By Technology Type, 2020 to 2024
    • Current and Future Market Size Value (USD Million) Analysis and Forecast By Technology Type, 2025 to 2035
      • Electronic Pediatric Measuring Device
      • Mechanical Pediatric Measuring Device
    • Y-o-Y Growth Trend Analysis By Technology Type, 2020 to 2024
    • Absolute $ Opportunity Analysis By Technology Type, 2025 to 2035
  8. Global Market Analysis 2020 to 2024 and Forecast 2025 to 2035, By Configuration Type
    • Introduction / Key Findings
    • Historical Market Size Value (USD Million) Analysis By Configuration Type, 2020 to 2024
    • Current and Future Market Size Value (USD Million) Analysis and Forecast By Configuration Type, 2025 to 2035
      • Mobile
      • Bench-Top
      • Wall-Mounted
      • Floor-Standing
    • Y-o-Y Growth Trend Analysis By Configuration Type, 2020 to 2024
    • Absolute $ Opportunity Analysis By Configuration Type, 2025 to 2035
  9. Global Market Analysis 2020 to 2024 and Forecast 2025 to 2035, By End User Type
    • Introduction / Key Findings
    • Historical Market Size Value (USD Million) Analysis By End User Type, 2020 to 2024
    • Current and Future Market Size Value (USD Million) Analysis and Forecast By End User Type, 2025 to 2035
      • Hospitals
      • Clinics
      • Others
    • Y-o-Y Growth Trend Analysis By End User Type, 2020 to 2024
    • Absolute $ Opportunity Analysis By End User Type, 2025 to 2035
  10. Global Market Analysis 2020 to 2024 and Forecast 2025 to 2035, By Region
    • Introduction
    • Historical Market Size Value (USD Million) Analysis By Region, 2020 to 2024
    • Current Market Size Value (USD Million) Analysis and Forecast By Region, 2025 to 2035
      • North America
      • Latin America
      • Western Europe
      • Eastern Europe
      • East Asia
      • South Asia and Pacific
      • Middle East & Africa
    • Market Attractiveness Analysis By Region
  11. North America Market Analysis 2020 to 2024 and Forecast 2025 to 2035, By Country
    • Historical Market Size Value (USD Million) Trend Analysis By Market Taxonomy, 2020 to 2024
    • Market Size Value (USD Million) Forecast By Market Taxonomy, 2025 to 2035
      • By Country
        • USA
        • Canada
        • Mexico
      • By Device Type
      • By Technology Type
      • By Configuration Type
      • By End User Type
    • Market Attractiveness Analysis
      • By Country
      • By Device Type
      • By Technology Type
      • By Configuration Type
      • By End User Type
    • Key Takeaways
  12. Latin America Market Analysis 2020 to 2024 and Forecast 2025 to 2035, By Country
    • Historical Market Size Value (USD Million) Trend Analysis By Market Taxonomy, 2020 to 2024
    • Market Size Value (USD Million) Forecast By Market Taxonomy, 2025 to 2035
      • By Country
        • Brazil
        • Chile
        • Rest of Latin America
      • By Device Type
      • By Technology Type
      • By Configuration Type
      • By End User Type
    • Market Attractiveness Analysis
      • By Country
      • By Device Type
      • By Technology Type
      • By Configuration Type
      • By End User Type
    • Key Takeaways
  13. Western Europe Market Analysis 2020 to 2024 and Forecast 2025 to 2035, By Country
    • Historical Market Size Value (USD Million) Trend Analysis By Market Taxonomy, 2020 to 2024
    • Market Size Value (USD Million) Forecast By Market Taxonomy, 2025 to 2035
      • By Country
        • Germany
        • UK
        • Italy
        • Spain
        • France
        • Nordic
        • BENELUX
        • Rest of Western Europe
      • By Device Type
      • By Technology Type
      • By Configuration Type
      • By End User Type
    • Market Attractiveness Analysis
      • By Country
      • By Device Type
      • By Technology Type
      • By Configuration Type
      • By End User Type
    • Key Takeaways
  14. Eastern Europe Market Analysis 2020 to 2024 and Forecast 2025 to 2035, By Country
    • Historical Market Size Value (USD Million) Trend Analysis By Market Taxonomy, 2020 to 2024
    • Market Size Value (USD Million) Forecast By Market Taxonomy, 2025 to 2035
      • By Country
        • Russia
        • Poland
        • Hungary
        • Balkan & Baltic
        • Rest of Eastern Europe
      • By Device Type
      • By Technology Type
      • By Configuration Type
      • By End User Type
    • Market Attractiveness Analysis
      • By Country
      • By Device Type
      • By Technology Type
      • By Configuration Type
      • By End User Type
    • Key Takeaways
  15. East Asia Market Analysis 2020 to 2024 and Forecast 2025 to 2035, By Country
    • Historical Market Size Value (USD Million) Trend Analysis By Market Taxonomy, 2020 to 2024
    • Market Size Value (USD Million) Forecast By Market Taxonomy, 2025 to 2035
      • By Country
        • China
        • Japan
        • South Korea
      • By Device Type
      • By Technology Type
      • By Configuration Type
      • By End User Type
    • Market Attractiveness Analysis
      • By Country
      • By Device Type
      • By Technology Type
      • By Configuration Type
      • By End User Type
    • Key Takeaways
  16. South Asia and Pacific Market Analysis 2020 to 2024 and Forecast 2025 to 2035, By Country
    • Historical Market Size Value (USD Million) Trend Analysis By Market Taxonomy, 2020 to 2024
    • Market Size Value (USD Million) Forecast By Market Taxonomy, 2025 to 2035
      • By Country
        • India
        • ASEAN
        • Australia & New Zealand
        • Rest of South Asia and Pacific
      • By Device Type
      • By Technology Type
      • By Configuration Type
      • By End User Type
    • Market Attractiveness Analysis
      • By Country
      • By Device Type
      • By Technology Type
      • By Configuration Type
      • By End User Type
    • Key Takeaways
  17. Middle East & Africa Market Analysis 2020 to 2024 and Forecast 2025 to 2035, By Country
    • Historical Market Size Value (USD Million) Trend Analysis By Market Taxonomy, 2020 to 2024
    • Market Size Value (USD Million) Forecast By Market Taxonomy, 2025 to 2035
      • By Country
        • Kingdom of Saudi Arabia
        • Other GCC Countries
        • Turkiye
        • South Africa
        • Other African Union
        • Rest of Middle East & Africa
      • By Device Type
      • By Technology Type
      • By Configuration Type
      • By End User Type
    • Market Attractiveness Analysis
      • By Country
      • By Device Type
      • By Technology Type
      • By Configuration Type
      • By End User Type
    • Key Takeaways
  18. Key Countries Market Analysis
    • USA
      • Pricing Analysis
      • Market Share Analysis, 2024
        • By Device Type
        • By Technology Type
        • By Configuration Type
        • By End User Type
    • Canada
      • Pricing Analysis
      • Market Share Analysis, 2024
        • By Device Type
        • By Technology Type
        • By Configuration Type
        • By End User Type
    • Mexico
      • Pricing Analysis
      • Market Share Analysis, 2024
        • By Device Type
        • By Technology Type
        • By Configuration Type
        • By End User Type
    • Brazil
      • Pricing Analysis
      • Market Share Analysis, 2024
        • By Device Type
        • By Technology Type
        • By Configuration Type
        • By End User Type
    • Chile
      • Pricing Analysis
      • Market Share Analysis, 2024
        • By Device Type
        • By Technology Type
        • By Configuration Type
        • By End User Type
    • Germany
      • Pricing Analysis
      • Market Share Analysis, 2024
        • By Device Type
        • By Technology Type
        • By Configuration Type
        • By End User Type
    • UK
      • Pricing Analysis
      • Market Share Analysis, 2024
        • By Device Type
        • By Technology Type
        • By Configuration Type
        • By End User Type
    • Italy
      • Pricing Analysis
      • Market Share Analysis, 2024
        • By Device Type
        • By Technology Type
        • By Configuration Type
        • By End User Type
    • Spain
      • Pricing Analysis
      • Market Share Analysis, 2024
        • By Device Type
        • By Technology Type
        • By Configuration Type
        • By End User Type
    • France
      • Pricing Analysis
      • Market Share Analysis, 2024
        • By Device Type
        • By Technology Type
        • By Configuration Type
        • By End User Type
    • India
      • Pricing Analysis
      • Market Share Analysis, 2024
        • By Device Type
        • By Technology Type
        • By Configuration Type
        • By End User Type
    • ASEAN
      • Pricing Analysis
      • Market Share Analysis, 2024
        • By Device Type
        • By Technology Type
        • By Configuration Type
        • By End User Type
    • Australia & New Zealand
      • Pricing Analysis
      • Market Share Analysis, 2024
        • By Device Type
        • By Technology Type
        • By Configuration Type
        • By End User Type
    • China
      • Pricing Analysis
      • Market Share Analysis, 2024
        • By Device Type
        • By Technology Type
        • By Configuration Type
        • By End User Type
    • Japan
      • Pricing Analysis
      • Market Share Analysis, 2024
        • By Device Type
        • By Technology Type
        • By Configuration Type
        • By End User Type
    • South Korea
      • Pricing Analysis
      • Market Share Analysis, 2024
        • By Device Type
        • By Technology Type
        • By Configuration Type
        • By End User Type
    • Russia
      • Pricing Analysis
      • Market Share Analysis, 2024
        • By Device Type
        • By Technology Type
        • By Configuration Type
        • By End User Type
    • Poland
      • Pricing Analysis
      • Market Share Analysis, 2024
        • By Device Type
        • By Technology Type
        • By Configuration Type
        • By End User Type
    • Hungary
      • Pricing Analysis
      • Market Share Analysis, 2024
        • By Device Type
        • By Technology Type
        • By Configuration Type
        • By End User Type
    • Kingdom of Saudi Arabia
      • Pricing Analysis
      • Market Share Analysis, 2024
        • By Device Type
        • By Technology Type
        • By Configuration Type
        • By End User Type
    • Turkiye
      • Pricing Analysis
      • Market Share Analysis, 2024
        • By Device Type
        • By Technology Type
        • By Configuration Type
        • By End User Type
    • South Africa
      • Pricing Analysis
      • Market Share Analysis, 2024
        • By Device Type
        • By Technology Type
        • By Configuration Type
        • By End User Type
  19. Market Structure Analysis
    • Competition Dashboard
    • Competition Benchmarking
    • Market Share Analysis of Top Players
      • By Regional
      • By Device Type
      • By Technology Type
      • By Configuration Type
      • By End User Type
  20. Competition Analysis
    • Competition Deep Dive
      • Seca GmbH & Co. KG
        • Overview
        • Product Portfolio
        • Profitability by Market Segments (Product/Age /Sales Channel/Region)
        • Sales Footprint
        • Strategy Overview
          • Marketing Strategy
          • Product Strategy
          • Channel Strategy
      • Natus Medical Incorporated
      • Hill-Rom Holdings, Inc.
      • Medtronic plc
      • GE Healthcare
      • Philips Healthcare
      • Welch Allyn, Inc.
      • Masimo Corporation
      • Drägerwerk AG & Co. KGaA
      • Invacare Corporation
      • Smiths Medical
      • Cardinal Health, Inc.
      • Omron Healthcare, Inc.
  21. Assumptions & Acronyms Used
  22. Research Methodology

List of Tables

  • Table 1: Global Market Value (USD Million) Forecast by Region, 2020-2035
  • Table 2: Global Market Value (USD Million) Forecast by Device Type , 2020-2035
  • Table 3: Global Market Value (USD Million) Forecast by Technology Type, 2020-2035
  • Table 4: Global Market Value (USD Million) Forecast by Configuration Type, 2020-2035
  • Table 5: Global Market Value (USD Million) Forecast by End User Type, 2020-2035
  • Table 6: North America Market Value (USD Million) Forecast by Country, 2020-2035
  • Table 7: North America Market Value (USD Million) Forecast by Device Type , 2020-2035
  • Table 8: North America Market Value (USD Million) Forecast by Technology Type, 2020-2035
  • Table 9: North America Market Value (USD Million) Forecast by Configuration Type, 2020-2035
  • Table 10: North America Market Value (USD Million) Forecast by End User Type, 2020-2035
  • Table 11: Latin America Market Value (USD Million) Forecast by Country, 2020-2035
  • Table 12: Latin America Market Value (USD Million) Forecast by Device Type , 2020-2035
  • Table 13: Latin America Market Value (USD Million) Forecast by Technology Type, 2020-2035
  • Table 14: Latin America Market Value (USD Million) Forecast by Configuration Type, 2020-2035
  • Table 15: Latin America Market Value (USD Million) Forecast by End User Type, 2020-2035
  • Table 16: Western Europe Market Value (USD Million) Forecast by Country, 2020-2035
  • Table 17: Western Europe Market Value (USD Million) Forecast by Device Type , 2020-2035
  • Table 18: Western Europe Market Value (USD Million) Forecast by Technology Type, 2020-2035
  • Table 19: Western Europe Market Value (USD Million) Forecast by Configuration Type, 2020-2035
  • Table 20: Western Europe Market Value (USD Million) Forecast by End User Type, 2020-2035
  • Table 21: Eastern Europe Market Value (USD Million) Forecast by Country, 2020-2035
  • Table 22: Eastern Europe Market Value (USD Million) Forecast by Device Type , 2020-2035
  • Table 23: Eastern Europe Market Value (USD Million) Forecast by Technology Type, 2020-2035
  • Table 24: Eastern Europe Market Value (USD Million) Forecast by Configuration Type, 2020-2035
  • Table 25: Eastern Europe Market Value (USD Million) Forecast by End User Type, 2020-2035
  • Table 26: East Asia Market Value (USD Million) Forecast by Country, 2020-2035
  • Table 27: East Asia Market Value (USD Million) Forecast by Device Type , 2020-2035
  • Table 28: East Asia Market Value (USD Million) Forecast by Technology Type, 2020-2035
  • Table 29: East Asia Market Value (USD Million) Forecast by Configuration Type, 2020-2035
  • Table 30: East Asia Market Value (USD Million) Forecast by End User Type, 2020-2035
  • Table 31: South Asia and Pacific Market Value (USD Million) Forecast by Country, 2020-2035
  • Table 32: South Asia and Pacific Market Value (USD Million) Forecast by Device Type , 2020-2035
  • Table 33: South Asia and Pacific Market Value (USD Million) Forecast by Technology Type, 2020-2035
  • Table 34: South Asia and Pacific Market Value (USD Million) Forecast by Configuration Type, 2020-2035
  • Table 35: South Asia and Pacific Market Value (USD Million) Forecast by End User Type, 2020-2035
  • Table 36: Middle East & Africa Market Value (USD Million) Forecast by Country, 2020-2035
  • Table 37: Middle East & Africa Market Value (USD Million) Forecast by Device Type , 2020-2035
  • Table 38: Middle East & Africa Market Value (USD Million) Forecast by Technology Type, 2020-2035
  • Table 39: Middle East & Africa Market Value (USD Million) Forecast by Configuration Type, 2020-2035
  • Table 40: Middle East & Africa Market Value (USD Million) Forecast by End User Type, 2020-2035

List of Figures

  • Figure 1: Global Market Pricing Analysis
  • Figure 2: Global Market Value (USD Million) Forecast 2020-2035
  • Figure 3: Global Market Value Share and BPS Analysis by Device Type , 2025 and 2035
  • Figure 4: Global Market Y-o-Y Growth Comparison by Device Type , 2025-2035
  • Figure 5: Global Market Attractiveness Analysis by Device Type
  • Figure 6: Global Market Value Share and BPS Analysis by Technology Type, 2025 and 2035
  • Figure 7: Global Market Y-o-Y Growth Comparison by Technology Type, 2025-2035
  • Figure 8: Global Market Attractiveness Analysis by Technology Type
  • Figure 9: Global Market Value Share and BPS Analysis by Configuration Type, 2025 and 2035
  • Figure 10: Global Market Y-o-Y Growth Comparison by Configuration Type, 2025-2035
  • Figure 11: Global Market Attractiveness Analysis by Configuration Type
  • Figure 12: Global Market Value Share and BPS Analysis by End User Type, 2025 and 2035
  • Figure 13: Global Market Y-o-Y Growth Comparison by End User Type, 2025-2035
  • Figure 14: Global Market Attractiveness Analysis by End User Type
  • Figure 15: Global Market Value (USD Million) Share and BPS Analysis by Region, 2025 and 2035
  • Figure 16: Global Market Y-o-Y Growth Comparison by Region, 2025-2035
  • Figure 17: Global Market Attractiveness Analysis by Region
  • Figure 18: North America Market Incremental Dollar Opportunity, 2025-2035
  • Figure 19: Latin America Market Incremental Dollar Opportunity, 2025-2035
  • Figure 20: Western Europe Market Incremental Dollar Opportunity, 2025-2035
  • Figure 21: Eastern Europe Market Incremental Dollar Opportunity, 2025-2035
  • Figure 22: East Asia Market Incremental Dollar Opportunity, 2025-2035
  • Figure 23: South Asia and Pacific Market Incremental Dollar Opportunity, 2025-2035
  • Figure 24: Middle East & Africa Market Incremental Dollar Opportunity, 2025-2035
  • Figure 25: North America Market Value Share and BPS Analysis by Country, 2025 and 2035
  • Figure 26: North America Market Value Share and BPS Analysis by Device Type , 2025 and 2035
  • Figure 27: North America Market Y-o-Y Growth Comparison by Device Type , 2025-2035
  • Figure 28: North America Market Attractiveness Analysis by Device Type
  • Figure 29: North America Market Value Share and BPS Analysis by Technology Type, 2025 and 2035
  • Figure 30: North America Market Y-o-Y Growth Comparison by Technology Type, 2025-2035
  • Figure 31: North America Market Attractiveness Analysis by Technology Type
  • Figure 32: North America Market Value Share and BPS Analysis by Configuration Type, 2025 and 2035
  • Figure 33: North America Market Y-o-Y Growth Comparison by Configuration Type, 2025-2035
  • Figure 34: North America Market Attractiveness Analysis by Configuration Type
  • Figure 35: North America Market Value Share and BPS Analysis by End User Type, 2025 and 2035
  • Figure 36: North America Market Y-o-Y Growth Comparison by End User Type, 2025-2035
  • Figure 37: North America Market Attractiveness Analysis by End User Type
  • Figure 38: Latin America Market Value Share and BPS Analysis by Country, 2025 and 2035
  • Figure 39: Latin America Market Value Share and BPS Analysis by Device Type , 2025 and 2035
  • Figure 40: Latin America Market Y-o-Y Growth Comparison by Device Type , 2025-2035
  • Figure 41: Latin America Market Attractiveness Analysis by Device Type
  • Figure 42: Latin America Market Value Share and BPS Analysis by Technology Type, 2025 and 2035
  • Figure 43: Latin America Market Y-o-Y Growth Comparison by Technology Type, 2025-2035
  • Figure 44: Latin America Market Attractiveness Analysis by Technology Type
  • Figure 45: Latin America Market Value Share and BPS Analysis by Configuration Type, 2025 and 2035
  • Figure 46: Latin America Market Y-o-Y Growth Comparison by Configuration Type, 2025-2035
  • Figure 47: Latin America Market Attractiveness Analysis by Configuration Type
  • Figure 48: Latin America Market Value Share and BPS Analysis by End User Type, 2025 and 2035
  • Figure 49: Latin America Market Y-o-Y Growth Comparison by End User Type, 2025-2035
  • Figure 50: Latin America Market Attractiveness Analysis by End User Type
  • Figure 51: Western Europe Market Value Share and BPS Analysis by Country, 2025 and 2035
  • Figure 52: Western Europe Market Value Share and BPS Analysis by Device Type , 2025 and 2035
  • Figure 53: Western Europe Market Y-o-Y Growth Comparison by Device Type , 2025-2035
  • Figure 54: Western Europe Market Attractiveness Analysis by Device Type
  • Figure 55: Western Europe Market Value Share and BPS Analysis by Technology Type, 2025 and 2035
  • Figure 56: Western Europe Market Y-o-Y Growth Comparison by Technology Type, 2025-2035
  • Figure 57: Western Europe Market Attractiveness Analysis by Technology Type
  • Figure 58: Western Europe Market Value Share and BPS Analysis by Configuration Type, 2025 and 2035
  • Figure 59: Western Europe Market Y-o-Y Growth Comparison by Configuration Type, 2025-2035
  • Figure 60: Western Europe Market Attractiveness Analysis by Configuration Type
  • Figure 61: Western Europe Market Value Share and BPS Analysis by End User Type, 2025 and 2035
  • Figure 62: Western Europe Market Y-o-Y Growth Comparison by End User Type, 2025-2035
  • Figure 63: Western Europe Market Attractiveness Analysis by End User Type
  • Figure 64: Eastern Europe Market Value Share and BPS Analysis by Country, 2025 and 2035
  • Figure 65: Eastern Europe Market Value Share and BPS Analysis by Device Type , 2025 and 2035
  • Figure 66: Eastern Europe Market Y-o-Y Growth Comparison by Device Type , 2025-2035
  • Figure 67: Eastern Europe Market Attractiveness Analysis by Device Type
  • Figure 68: Eastern Europe Market Value Share and BPS Analysis by Technology Type, 2025 and 2035
  • Figure 69: Eastern Europe Market Y-o-Y Growth Comparison by Technology Type, 2025-2035
  • Figure 70: Eastern Europe Market Attractiveness Analysis by Technology Type
  • Figure 71: Eastern Europe Market Value Share and BPS Analysis by Configuration Type, 2025 and 2035
  • Figure 72: Eastern Europe Market Y-o-Y Growth Comparison by Configuration Type, 2025-2035
  • Figure 73: Eastern Europe Market Attractiveness Analysis by Configuration Type
  • Figure 74: Eastern Europe Market Value Share and BPS Analysis by End User Type, 2025 and 2035
  • Figure 75: Eastern Europe Market Y-o-Y Growth Comparison by End User Type, 2025-2035
  • Figure 76: Eastern Europe Market Attractiveness Analysis by End User Type
  • Figure 77: East Asia Market Value Share and BPS Analysis by Country, 2025 and 2035
  • Figure 78: East Asia Market Value Share and BPS Analysis by Device Type , 2025 and 2035
  • Figure 79: East Asia Market Y-o-Y Growth Comparison by Device Type , 2025-2035
  • Figure 80: East Asia Market Attractiveness Analysis by Device Type
  • Figure 81: East Asia Market Value Share and BPS Analysis by Technology Type, 2025 and 2035
  • Figure 82: East Asia Market Y-o-Y Growth Comparison by Technology Type, 2025-2035
  • Figure 83: East Asia Market Attractiveness Analysis by Technology Type
  • Figure 84: East Asia Market Value Share and BPS Analysis by Configuration Type, 2025 and 2035
  • Figure 85: East Asia Market Y-o-Y Growth Comparison by Configuration Type, 2025-2035
  • Figure 86: East Asia Market Attractiveness Analysis by Configuration Type
  • Figure 87: East Asia Market Value Share and BPS Analysis by End User Type, 2025 and 2035
  • Figure 88: East Asia Market Y-o-Y Growth Comparison by End User Type, 2025-2035
  • Figure 89: East Asia Market Attractiveness Analysis by End User Type
  • Figure 90: South Asia and Pacific Market Value Share and BPS Analysis by Country, 2025 and 2035
  • Figure 91: South Asia and Pacific Market Value Share and BPS Analysis by Device Type , 2025 and 2035
  • Figure 92: South Asia and Pacific Market Y-o-Y Growth Comparison by Device Type , 2025-2035
  • Figure 93: South Asia and Pacific Market Attractiveness Analysis by Device Type
  • Figure 94: South Asia and Pacific Market Value Share and BPS Analysis by Technology Type, 2025 and 2035
  • Figure 95: South Asia and Pacific Market Y-o-Y Growth Comparison by Technology Type, 2025-2035
  • Figure 96: South Asia and Pacific Market Attractiveness Analysis by Technology Type
  • Figure 97: South Asia and Pacific Market Value Share and BPS Analysis by Configuration Type, 2025 and 2035
  • Figure 98: South Asia and Pacific Market Y-o-Y Growth Comparison by Configuration Type, 2025-2035
  • Figure 99: South Asia and Pacific Market Attractiveness Analysis by Configuration Type
  • Figure 100: South Asia and Pacific Market Value Share and BPS Analysis by End User Type, 2025 and 2035
  • Figure 101: South Asia and Pacific Market Y-o-Y Growth Comparison by End User Type, 2025-2035
  • Figure 102: South Asia and Pacific Market Attractiveness Analysis by End User Type
  • Figure 103: Middle East & Africa Market Value Share and BPS Analysis by Country, 2025 and 2035
  • Figure 104: Middle East & Africa Market Value Share and BPS Analysis by Device Type , 2025 and 2035
  • Figure 105: Middle East & Africa Market Y-o-Y Growth Comparison by Device Type , 2025-2035
  • Figure 106: Middle East & Africa Market Attractiveness Analysis by Device Type
  • Figure 107: Middle East & Africa Market Value Share and BPS Analysis by Technology Type, 2025 and 2035
  • Figure 108: Middle East & Africa Market Y-o-Y Growth Comparison by Technology Type, 2025-2035
  • Figure 109: Middle East & Africa Market Attractiveness Analysis by Technology Type
  • Figure 110: Middle East & Africa Market Value Share and BPS Analysis by Configuration Type, 2025 and 2035
  • Figure 111: Middle East & Africa Market Y-o-Y Growth Comparison by Configuration Type, 2025-2035
  • Figure 112: Middle East & Africa Market Attractiveness Analysis by Configuration Type
  • Figure 113: Middle East & Africa Market Value Share and BPS Analysis by End User Type, 2025 and 2035
  • Figure 114: Middle East & Africa Market Y-o-Y Growth Comparison by End User Type, 2025-2035
  • Figure 115: Middle East & Africa Market Attractiveness Analysis by End User Type
  • Figure 116: Global Market - Tier Structure Analysis
  • Figure 117: Global Market - Company Share Analysis

Frequently Asked Questions

How big is the pediatric measuring devices market in 2025?

The global pediatric measuring devices market is estimated to be valued at USD 1,391.4 million in 2025.

What will be the size of pediatric measuring devices market in 2035?

The market size for the pediatric measuring devices market is projected to reach USD 2,119.7 million by 2035.

How much will be the pediatric measuring devices market growth between 2025 and 2035?

The pediatric measuring devices market is expected to grow at a 4.3% CAGR between 2025 and 2035.

What are the key product types in the pediatric measuring devices market?

The key product types in pediatric measuring devices market are infantometer, mobile measuring mat, height measuring rods, head circumference measuring tape, stadiometer and others.

Which technology type segment to contribute significant share in the pediatric measuring devices market in 2025?

In terms of technology type, electronic pediatric measuring device segment to command 54.6% share in the pediatric measuring devices market in 2025.

Explore Similar Insights

Future Market Insights

Pediatric Measuring Devices Market

Chat With MaRIA

Chat With

MaRIA

Hi There, I am MaRIA, Your Market Research Intelligence Assistant. How may I help you?