

- Market Size (2026)
- USD 3.6 Bn
- Forecast (2036)
- USD 5.3 Bn
- CAGR (2026 to 2036)
- 4.0%
Pediatric Obesity Management Market Size, Market Forecast and Outlook By FMI
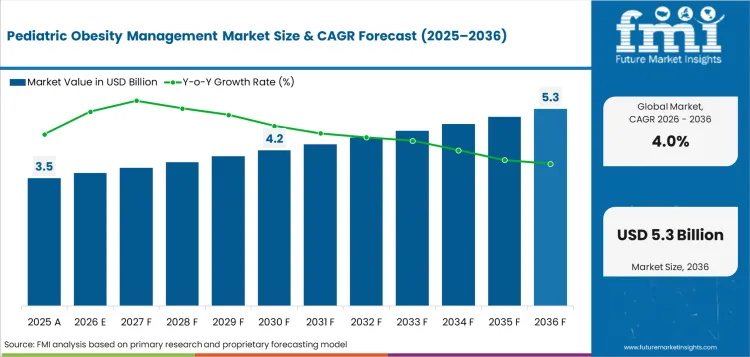
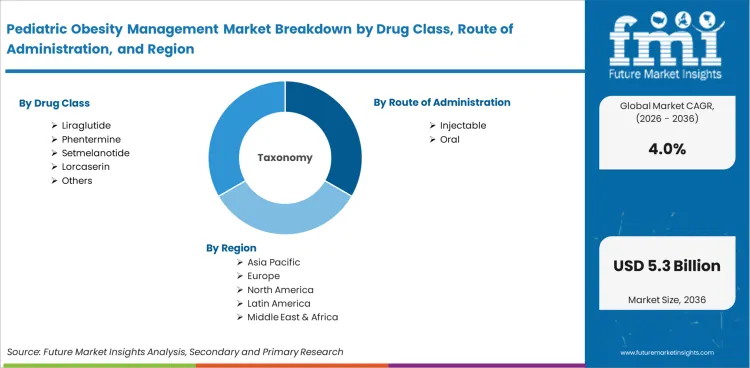
The pediatric obesity management market was valued at USD 3.5 billion in 2025. The market is set to reach USD 3.6 billion by 2026-end and grow at a CAGR of 4.0% between 2026-2036 to reach USD 5.3 billion by 2036. Liraglutide will dominate with a 34.7% share, while Injectable will lead with a 52.1% share.
Summary of the Pediatric Obesity Management Market
- Demand and Growth Drivers
- Rising global childhood obesity prevalence, accelerated by sedentary lifestyle patterns and processed food consumption, is expanding the clinically identified patient population that meets criteria for pharmacological weight management intervention.
- FDA and EMA approval of GLP-1 receptor agonists for adolescent obesity has created a pharmaceutical treatment category where behavioral intervention alone previously defined the standard of care.
- Growing recognition among pediatricians and pediatric endocrinologists that childhood obesity is a chronic medical condition requiring multi modal treatment is increasing referral rates for pharmacotherapy and surgical evaluation.
- Product and Segment View
- Liraglutide holds 34.7% of the Drug Class segment in 2026, reflecting its established regulatory approval for adolescent weight management and growing prescriber familiarity with GLP-1 receptor agonist use in pediatric populations.
- Hospitals account for 51.9% of the Care Setting segment, reflecting the specialist pediatric endocrinology and obesity medicine setting where treatment initiation, dose titration, and monitoring are primarily conducted.
- Hospital Pharmacies at 48.5% of the Distribution Channel segment reflects the primary age group and clinical presentation driving pediatric obesity pharmacotherapy demand.
- Geography and Competitive Outlook
- China leads growth at 5.2% CAGR through 2036, reflecting rapid increases in childhood obesity prevalence driven by dietary shifts, growing awareness among pediatricians, and expanding access to specialized pediatric weight management programs.
- The USA at 4.8% reflects the highest childhood obesity prevalence among major markets, established pediatric endocrinology infrastructure, and the most advanced payer coverage framework for pediatric obesity pharmacotherapy.
- Companies with approved GLP-1 receptor agonists for adolescent use, combined with digital health monitoring platforms and pediatric clinical evidence programs, are positioned to capture the majority of market revenue as treatment adoption expands.
- Analyst Opinion
- Sabyasachi Ghosh, Principal Consultant at FMI says, 'The approval of GLP-1 receptor agonists for adolescent obesity has created a pharmaceutical market where behavioral intervention alone previously defined the treatment landscape. Companies that combine weight management pharmacotherapy with digital health monitoring, nutritional counseling integration, and pediatric dosing optimization will capture the largest share of this emerging treatment category as payer coverage expands and clinical guidelines incorporate pharmacotherapy recommendations.'
- The pediatric obesity management market is transitioning toward more structured procurement and supply chain relationships.
- Adoption is increasing due to evolving regulatory requirements and commercial benchmarks.
- Demand is further supported by evolving standards across North America, Europe, and East Asia.
Key Takeaways, Market Size, and Forecast
- The pediatric obesity management market was valued at USD 3.53 billion in 2025.
- By 2036, the Pediatric Obesity Management Market is expected to be worth USD 5.33 billion.
- From 2026 to 2036, the market is projected to expand at a CAGR of 4%.
- The market is projected to create an incremental opportunity of USD 1.73 billion between 2026 and 2036.
- In 2026, Liraglutide is expected to account for 34.7% of the Drug Class, driven by FDA approval of GLP-1 receptor agonists for adolescent obesity, combined with growing clinical recognition of childhood obesity as a treatable medical condition requiring pharmacological intervention.
- China (5.2%) and USA (4.8%) are two of the fastest growing markets in the world.
Pediatric Obesity Management Market Definition
The pediatric obesity management market encompasses pharmaceutical products, medical devices, and clinical program services used to treat obesity in children and adolescents. Treatment categories include GLP-1 receptor agonists, lipase inhibitors, sympathomimetic agents, bariatric surgery devices, and structured weight management programs.
Pediatric Obesity Management Market Inclusions
Market scope covers all commercially marketed pediatric obesity management products categorized by Drug Class, Route of Administration, Distribution Channel, Age Group, Care Setting, Treatment Type. Revenue sizing spans the 2026 to 2036 forecast period.
Pediatric Obesity Management Market Exclusions
The scope does not include adult obesity treatments used off label in pediatric populations without regulatory approval, general nutritional supplements, fitness equipment, or school based obesity prevention programs without pharmaceutical or medical device components.
Pediatric Obesity Management Market Research Methodology
- Primary Research: FMI analysts conducted interviews with manufacturers, specialists, and participants across key markets.
- Desk Research: Combined industry databases, regulatory filings, publications, and manufacturer disclosures.
- Market Sizing and Forecasting: Bottom up aggregation across segments, applications, and regions with adoption curve modeling.
- Data Validation: Cross checked quarterly against statistics, trade data, and reported figures.
Why is the Pediatric Obesity Management Market Growing?
- The global prevalence of childhood obesity in excess of 150 million children is a large and expanding addressable population, but the low rate of pharmacological treatment in this population suggests considerable room for growth.
- As clinical guidelines evolve to recommend pharmacotherapy as a part of pediatric obesity management in combination with dietary, behavioral, and physical activity interventions, prescriber willingness to initiate drug therapy is increasing.
- China is witnessing the fastest growth at a CAGR of 5.2% due to the rapid rise in childhood obesity prevalence, expanding specialist capacity, and government health programs targeting pediatric metabolic conditions..
The pediatric obesity management market is expanding as pharmacotherapy gains clinical acceptance for adolescent weight management. Liraglutide accounts for 34.7% of the drug class segment, reflecting its established position as the first GLP-1 receptor agonist approved for adolescent obesity management. Semaglutide, orlistat, and phentermine/topiramate serve additional treatment roles, with semaglutide expected to capture growing share as pediatric approval expands and clinical evidence accumulates.
The treatment rate gap between diagnosed childhood obesity and pharmacological intervention represents the primary growth opportunity. Clinical guidelines have historically emphasized behavioral and lifestyle interventions for pediatric obesity, with pharmacotherapy reserved for severe cases. The approval and clinical success of GLP-1 receptor agonists in adolescents is shifting clinical practice toward earlier pharmacological intervention, though prescriber adoption varies significantly across specialties and geographies.
Payer coverage expansion is essential for market growth. Insurance coverage for pediatric obesity pharmacotherapy remains inconsistent, with many payers classifying weight management drugs as lifestyle medications with limited or no coverage. Clinical evidence demonstrating reduction in obesity related comorbidities and long term health economic benefits is gradually supporting payer formulary inclusion. Patient assistance programs and manufacturer copay support bridge coverage gaps during the transition toward broader reimbursement.
Market Segmentation Analysis
- Liraglutide holds 34.7% of the Drug Class segment.
- Hospitals accounts for 51.9% of the Care Setting segment.
- Hospital Pharmacies at 48.5% of the Distribution Channel segment reflects functional preferences.
The pediatric obesity management market is segmented by Drug Class, Route of Administration, Distribution Channel, Age Group, Care Setting, Treatment Type.
Insights into the Liraglutide Drug Class Segment
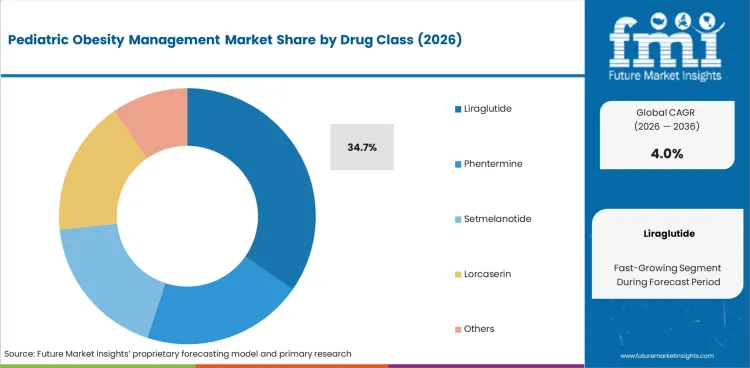
In 2026, Liraglutide is expected to account for 34.7% of the Drug Class segment. This reflects sustained demand where liraglutide has demonstrated consistent performance. Sub segments are differentiated by specifications and pricing. Procurement decisions prioritize reliability, compliance, and quality.
Insights into the Hospitals Care Setting Segment
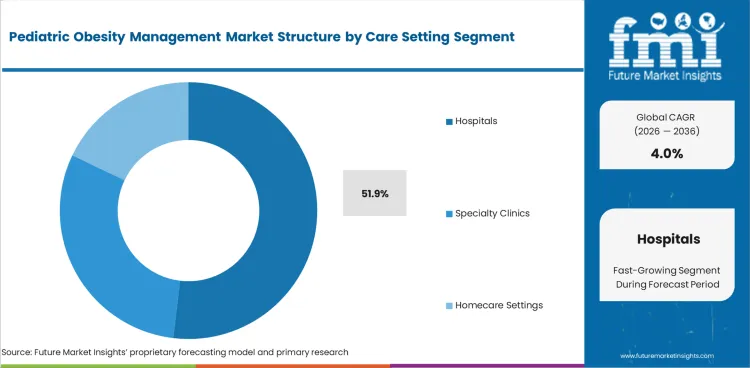
Hospitals accounts for 51.9% of the Care Setting segment. Growth is supported by expanding markets and standardization. Buyers prioritize performance, cost considerations, and support.
Pediatric Obesity Management Market Drivers, Restraints, and Opportunities
- Regulatory frameworks create a structured demand for compliant products.
- Margin risk from cost pressures and supply constraints.
- Application expansion opens up new doors for incremental growth.
The pediatric obesity management market is driven by changing requirements, regulatory mandates and competitive dynamics.
Childhood Obesity Prevalence Growth
The ongoing global rise in childhood obesity rates is driving demand, due to dietary changes favoring processed and calorie dense foods, less physical activity and sedentary screen based entertainment. Childhood obesity rates have more than doubled in the past three decades, creating a large and growing addressable patient population for pharmacological intervention, according to WHO data.
Payer Coverage Limitations and Affordability Barriers
Pediatric obesity pharmacotherapy is constrained by inconsistent insurance coverage. Many commercial and government payers consider weight management drugs to be lifestyle medications and provide little to no formulary coverage for them. GLP-1 receptor agonists are costly, with annual treatment costs exceeding USD 10,000, which place a substantial out of pocket burden on families without coverage and limit the adoption of treatment to well insured or affluent populations.
Clinical Guideline Evolution and Prescriber Adoption
Adoption is growing as clinical guidelines evolve to recommend pharmacotherapy as a part of treatment for pediatric obesity, in addition to behavioral interventions. Guidelines from the American Academy of Pediatrics and European Society for Paediatric Endocrinology have been updated to include pharmacotherapy for adolescents with severe obesity, which has increased prescriber willingness to begin drug therapy.
GLP-1 Pipeline Expansion and Pediatric Indication Development
Growth is driven by continued clinical development of next generation GLP-1 receptor agonists and combination therapies for pediatric weight management. Clinical trials of semaglutide and tirzepatide in adolescents are anticipated to extend the therapeutic armamentarium . More efficacious agents may yield greater weight loss and promote broader clinical application.
Analysis of Pediatric Obesity Management Market By Key Countries
.webp "Top Country Growth Comparison Pediatric Obesity Management Market Cagr (2026 2036)")
| Country | CAGR |
|---|---|
| USA | 4.8% |
| UK | 4.5% |
| France | 4.2% |
| Germany | 4.3% |
| Italy | 3.8% |
| South Korea | 4.6% |
| Japan | 3.7% |
| China | 5.2% |
| Australia - New Zealand | 4.1% |
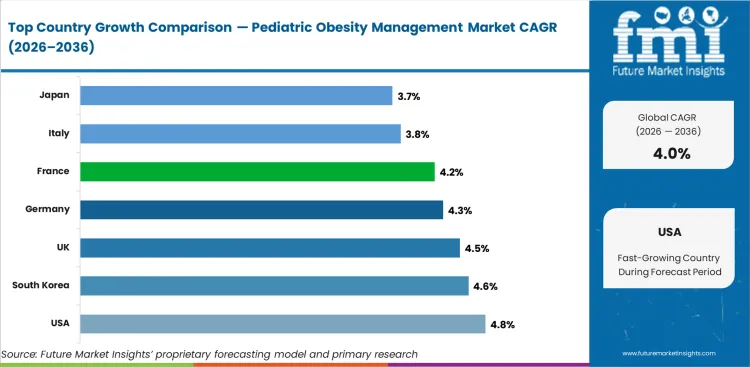
- China is leading with 5.2% CAGR till 2036.
- USA 4.8% demand steady.
- UK (4.5%) shows steady demand.
The global pediatric obesity management market is projected to grow at 4% CAGR from 2026 to 2036, covering more than 30 countries.
Demand Outlook for Pediatric Obesity Management Market in the United States
The United States is expected to grow at 4.8% CAGR through 2036. The US has the highest childhood obesity prevalence among developed markets, with the American Academy of Pediatrics updated guidelines recommending GLP-1 receptor agonist pharmacotherapy for adolescents with severe obesity providing clinical endorsement that is gradually expanding prescriber willingness and insurance coverage.
- Highest childhood obesity prevalence creates the largest addressable patient population.
- AAP guideline update endorses pharmacotherapy, increasing prescriber willingness.
- Insurance coverage expansion for obesity medications improves treatment accessibility.
Future Outlook for Pediatric Obesity Management Market in the United Kingdom
The United Kingdom is expected to grow at 4.5% CAGR through 2036. NICE guidelines for managing overweight and obesity in children are evolving to incorporate pharmacotherapy recommendations, with NHS specialist weight management services in Tier 3 and Tier 4 providing structured referral pathways for adolescents who meet criteria for pharmaceutical intervention.
- NICE guideline evolution incorporates pharmacotherapy for pediatric obesity.
- NHS Tier 3 and 4 weight management services provide structured referral pathways.
- Growing childhood obesity prevalence sustains public health investment in treatment.
Opportunity Analysis of Pediatric Obesity Management Market in Germany
Germany is expected to grow at 4.3% CAGR through 2036. German pediatric endocrinology networks and statutory health insurance coverage create the clinical infrastructure for pharmacotherapy adoption, with the German Obesity Society (DAG) guidelines supporting a multi disciplinary treatment approach that increasingly includes pharmacological options for adolescents with severe obesity.
- Pediatric endocrinology networks support structured weight management.
- DAG guidelines increasingly support pharmacological intervention.
- Statutory health insurance framework enables potential coverage expansion.
In-depth Analysis of Pediatric Obesity Management Market in China
China is expected to grow at 5.2% CAGR through 2036. China's childhood obesity prevalence has tripled in two decades, creating the fastest growing pediatric obesity population globally. Government childhood health programs, pediatric endocrinology capacity expansion, and growing parental awareness that childhood obesity requires medical intervention are creating conditions for pharmacotherapy market development.
- Tripling of childhood obesity prevalence creates rapidly expanding patient population.
- Government childhood health programs address pediatric metabolic conditions.
- Growing parental awareness supports medical intervention acceptance.
Sales Analysis of Pediatric Obesity Management Market in South Korea
South Korea is expected to grow at 4.6% CAGR through 2036. South Korea's childhood obesity rates are rising alongside changing dietary patterns and sedentary lifestyles, with Korean Endocrine Society treatment recommendations and growing pediatric specialist capacity supporting structured weight management programs that may incorporate pharmacotherapy as approved indications expand.
- Rising childhood obesity rates expand the addressable treatment population.
- Korean Endocrine Society recommendations guide treatment approaches.
- Pediatric specialist capacity growth supports comprehensive weight management.
In-depth Analysis of Pediatric Obesity Management Market in Australia and New Zealand
Australia and New Zealand is expected to grow at 4.1% CAGR through 2036. Australian childhood obesity prevalence, though lower than the US, sustains demand for structured pediatric weight management programs, with Royal Australasian College of Physicians guidelines and state government children's health initiatives supporting a multi modal treatment approach.
- RACP guidelines support multi modal pediatric obesity treatment.
- State government children's health initiatives fund weight management programs.
- PBS listing of approved weight management medications would accelerate market growth.
Competitive Landscape and Strategic Positioning
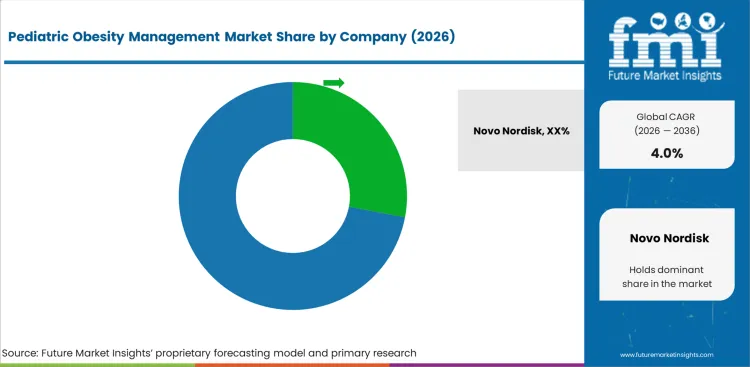
- Novo Nordisk maintains the strongest position through capability and portfolio breadth.
- Eli Lilly and Company, Medtronic plc, WW International compete through specialization and expertise.
- Emerging players focus on niche applications and differentiation.
Novo Nordisk holds the strongest competitive position through technical capability, established relationships, and portfolio breadth.
Eli Lilly and Company, Medtronic plc, WW International compete through specialized capabilities, application expertise, and targeted market strategies.
Barriers to entry include technical expertise, regulatory compliance, established relationships, and capital requirements.
Strategic priorities include cost optimization, geographic expansion, portfolio extension, and customer retention investment.
Key Companies in the Pediatric Obesity Management Market
Key global companies leading the pediatric obesity management market include:
- Novo Nordisk, Eli Lilly and Company, Medtronic plc, WW International maintain strong positions through integrated capabilities.
- Nestlé Health Science, Johnson & Johnson (Ethicon), Allurion Technologies compete through regional specialization.
- Pfizer, Bristol-Myers Squibb, Abbott Laboratories, Medifast, F. Hoffmann-La Roche Ltd, Vivus, Inc., Sanofi, Nestlé, Danone, Kraft Heinz, Amgen, Merck, Cigna are establishing presence through niche focus.
Competitive Benchmarking: Pediatric Obesity Management Market
| Company | Drug Portfolio | Clinical Evidence | Pediatric Expertise | Market Access |
|---|---|---|---|---|
| Novo Nordisk | High | High | Strong | Global |
| Eli Lilly and Company | High | High | Strong | Global |
| Medtronic plc | High | High | Strong | Global |
| WW International | Medium | High | Moderate | Global |
| Nestlé Health Science | Medium | Medium | Moderate | Regional |
| Johnson & Johnson (Ethicon) | Medium | Medium | Moderate | Regional |
| Allurion Technologies | Low | Medium | Low | Regional |
| Pfizer | Low | Medium | Low | Niche |
| Bristol-Myers Squibb | Low | Medium | Low | Niche |
| Abbott Laboratories | Low | Medium | Low | Niche |
Source: Future Market Insights competitive analysis, 2026.
Key Developments in Pediatric Obesity Management Market
- In 2025, Novo Nordisk expanded its obesity care portfolio across key markets by advancing the commercialization of Wegovy® and broadening access to GLP-1 therapies for chronic weight management.
- In 2025, Eli Lilly and Company invested in manufacturing capacity expansion to support rising demand from the China market, strengthening global production infrastructure for its incretin-based metabolic therapies.
Key Players in the Pediatric Obesity Management Market
Major Global Players
- Novo Nordisk
- Eli Lilly and Company
- Medtronic plc
- WW International
- Nestlé Health Science
- Johnson & Johnson (Ethicon)
- Allurion Technologies
Emerging Players/Startups
- Pfizer
- Bristol-Myers Squibb
- Abbott Laboratories
- Medifast
- F. Hoffmann-La Roche Ltd
- Vivus, Inc.
- Sanofi
- Nestlé
- Danone
- Kraft Heinz
- Amgen
- Merck
- Cigna
Report Scope and Coverage
| Parameter | Details |
|---|---|
| Quantitative Units | USD 3.60 billion to USD 5.33 billion, at a CAGR of 4% |
| Market Definition | The pediatric obesity management market encompasses commercially traded products categorized by Drug Class, Route of Administration, Distribution Channel, Age Group, Care Setting, Treatment Type. |
| Regions Covered | North America, Latin America, Europe, East Asia, South Asia and Pacific, Middle East and Africa |
| Countries Covered | USA, UK, France, Germany, Italy, South Korea, Japan, China, Australia - New Zealand, 30 plus countries |
| Key Companies Profiled | Novo Nordisk, Eli Lilly and Company, Medtronic plc, WW International, Nestlé Health Science, Johnson & Johnson (Ethicon), Allurion Technologies, Pfizer, Bristol-Myers Squibb, Abbott Laboratories, Medifast, F. Hoffmann-La Roche Ltd, Vivus, Inc., Sanofi, Nestlé, Danone, Kraft Heinz, Amgen, Merck, Cigna |
| Forecast Period | 2026 to 2036 |
| Approach | Hybrid bottom up and top down methodology starting with verified transaction data, projecting adoption velocity across segments and regions. |
Segmentation
Pediatric Obesity Management Market Segmented by Drug Class:
- Liraglutide
- GLP-1 Receptor Agonist Therapy
- Appetite Regulation Treatment
- Phentermine
- Short-Term Weight Loss Drug
- Sympathomimetic Appetite Suppressant
- Setmelanotide
- MC4R Agonist Therapy
- Genetic Obesity Disorder Treatment
- Lorcaserin
- Serotonin Receptor Agonist
- Weight Management Therapy
- Others
- Emerging Anti-Obesity Drugs
- Combination Pharmacotherapies
Pediatric Obesity Management Market Segmented by Route of Administration:
- Injectable
- Subcutaneous GLP-1 Injections
- Long-Acting Hormonal Therapies
- Oral
- Tablet-Based Weight Management Drugs
- Daily Dose Medications
Pediatric Obesity Management Market Segmented by Distribution Channel:
- Hospital Pharmacies
- Pediatric Specialty Hospitals
- Endocrinology Departments
- Retail Pharmacies
- Community Pharmacies
- Prescription Refill Services
- Online Pharmacies
- E-Pharmacy Pediatric Medications
- Home Delivery Services
Pediatric Obesity Management Market Segmented by Age Group:
- Adolescents (12-18 Years)
- Teen Obesity Management Programs
- Lifestyle & Pharmacological Treatment
- Children (6-12 Years)
- School-Age Intervention Programs
- Nutritional Therapy
- Early Childhood (2-5 Years)
- Parental Guided Nutrition Plans
- Behavioral Therapy
Pediatric Obesity Management Market Segmented by Care Setting:
- Hospitals
- Pediatric Endocrinology Units
- Multidisciplinary Obesity Clinics
- Specialty Clinics
- Weight Management Clinics
- Pediatric Nutrition Centers
- Homecare Settings
- Telehealth Monitoring
- Family-Based Lifestyle Programs
Pediatric Obesity Management Market Segmented by Treatment Type:
- Lifestyle & Behavioral Therapy
- Dietary Intervention Programs
- Physical Activity & Exercise Plans
- Pharmacotherapy
- Prescription Weight Management Drugs
- Hormonal & Metabolic Treatments
- Surgical Treatment
- Bariatric Surgery (Adolescents)
- Minimally Invasive Weight Loss Procedures
Pediatric Obesity Management Market by Region:
- North America
- USA
- Canada
- Mexico
- Latin America
- Brazil
- Chile
- Rest of Latin America
- Western Europe
- Germany
- UK
- Italy
- Spain
- France
- Nordic
- BENELUX
- Rest of Western Europe
- Eastern Europe
- Russia
- Poland
- Hungary
- Balkan & Baltic
- Rest of Eastern Europe
- East Asia
- China
- Japan
- South Korea
- South Asia and Pacific
- India
- ASEAN
- Australia & New Zealand
- Rest of South Asia and Pacific
- Middle East & Africa
- Kingdom of Saudi Arabia
- Other GCC Countries
- Turkiye
- South Africa
- Other African Union
- Rest of Middle East & Africa
Research Sources and Bibliography
- 1. World Health Organization. (2025). WHO Childhood Obesity Surveillance Initiative Report. WHO.
- 2. American Academy of Pediatrics. (2025). AAP Clinical Practice Guideline: Evaluation and Treatment of Childhood Obesity. AAP.
- 3. European Medicines Agency. (2024). EMA Pediatric Investigation Plans: Obesity Treatment. EMA.
- 4. USA Food and Drug Administration. (2025). FDA Approved Drug Products: Pediatric Obesity Indications. FDA.
- 5. World Obesity Federation. (2025). World Obesity Atlas: Childhood Obesity Projections. WOF.
This bibliography is provided for reader reference. The full Future Market Insights report contains the complete reference list with publication dates, URLs, and supporting data for all cited works.
This Report Addresses
- Estimating market size and revenue from 2026 to 2036.
- Segmentation by product, application, end use, and region.
- Insights about more than 30 regional markets.
- Technology, manufacturing, and supply chain analysis.
- Competitive landscape assessment.
- Investment opportunity identification.
- Supply chain and distribution analysis.
- Data delivery in PDF and Excel formats.
Frequently Asked Questions
What is the global market demand for Pediatric Obesity Management Market in 2026?
In 2026, the global pediatric obesity management market is expected to be worth USD 3.60 billion.
How big will the Pediatric Obesity Management Market be in 2036?
By 2036, the pediatric obesity management market is expected to reach USD 5.33 billion.
How much is demand for Pediatric Obesity Management Market expected to grow between 2026 and 2036?
Between 2026 and 2036, demand is expected to grow at a CAGR of 4%.
Which Drug Class is expected to lead in the Pediatric Obesity Management Market in 2026?
Liraglutide is expected to account for 34.7% of the Drug Class segment in 2026.
What is causing demand to rise in China in the Pediatric Obesity Management Market?
China is expected to grow at 5.2% CAGR through 2036, supported by domestic scale and favorable conditions.
What is causing demand to rise in USA in the Pediatric Obesity Management Market?
USA is expected to grow at 4.8% CAGR through 2036, driven by established infrastructure and investment.
What does this report mean by 'Pediatric Obesity Management Market definition'?
The pediatric obesity management market includes all commercially traded products categorized by Drug Class, Route of Administration, Distribution Channel, Age Group, Care Setting, Treatment Type.
How does FMI make the Pediatric Obesity Management Market forecast?
Forecasting uses a hybrid bottom up and top down approach, starting with verified data and validating against industry statistics.
Preview the report firsthand - request a free sample
Get SampleGet the brochure for pricing and purchase details.
Get PDFTable of Content
- Executive Summary
- Global Market Outlook
- Demand-side Trends
- Supply-side Trends
- Technology Roadmap Analysis
- Analysis and Recommendations
- Market Overview
- Market Coverage / Taxonomy
- Market Definition / Scope / Limitations
- Research Methodology
- Chapter Orientation
- Analytical Lens and Working Hypotheses
- Market Structure, Signals, and Trend Drivers
- Benchmarking and Cross-market Comparability
- Market Sizing, Forecasting, and Opportunity Mapping
- Research Design and Evidence Framework
- Desk Research Programme (Secondary Evidence)
- Company Annual and Sustainability Reports
- Peer-reviewed Journals and Academic Literature
- Corporate Websites, Product Literature, and Technical Notes
- Earnings Decks and Investor Briefings
- Statutory Filings and Regulatory Disclosures
- Technical White Papers and Standards Notes
- Trade Journals, Industry Magazines, and Analyst Briefs
- Conference Proceedings, Webinars, and Seminar Materials
- Government Statistics Portals and Public Data Releases
- Press Releases and Reputable Media Coverage
- Specialist Newsletters and Curated Briefings
- Sector Databases and Reference Repositories
- FMI Internal Proprietary Databases and Historical Market Datasets
- Subscription Datasets and Paid Sources
- Social Channels, Communities, and Digital Listening Inputs
- Additional Desk Sources
- Expert Input and Fieldwork (Primary Evidence)
- Primary Modes
- Qualitative Interviews and Expert Elicitation
- Quantitative Surveys and Structured Data Capture
- Blended Approach
- Why Primary Evidence is Used
- Field Techniques
- Interviews
- Surveys
- Focus Groups
- Observational and In-context Research
- Social and Community Interactions
- Stakeholder Universe Engaged
- C-suite Leaders
- Board Members
- Presidents and Vice Presidents
- R&D and Innovation Heads
- Technical Specialists
- Domain Subject-matter Experts
- Scientists
- Physicians and Other Healthcare Professionals
- Governance, Ethics, and Data Stewardship
- Research Ethics
- Data Integrity and Handling
- Primary Modes
- Tooling, Models, and Reference Databases
- Desk Research Programme (Secondary Evidence)
- Data Engineering and Model Build
- Data Acquisition and Ingestion
- Cleaning, Normalisation, and Verification
- Synthesis, Triangulation, and Analysis
- Quality Assurance and Audit Trail
- Market Background
- Market Dynamics
- Drivers
- Restraints
- Opportunity
- Trends
- Scenario Forecast
- Demand in Optimistic Scenario
- Demand in Likely Scenario
- Demand in Conservative Scenario
- Opportunity Map Analysis
- Product Life Cycle Analysis
- Supply Chain Analysis
- Investment Feasibility Matrix
- Value Chain Analysis
- PESTLE and Porter’s Analysis
- Regulatory Landscape
- Regional Parent Market Outlook
- Production and Consumption Statistics
- Import and Export Statistics
- Market Dynamics
- Global Market Analysis 2021 to 2025 and Forecast, 2026 to 2036
- Historical Market Size Value (USD Million) Analysis, 2021 to 2025
- Current and Future Market Size Value (USD Million) Projections, 2026 to 2036
- Y-o-Y Growth Trend Analysis
- Absolute $ Opportunity Analysis
- Global Market Pricing Analysis 2021 to 2025 and Forecast 2026 to 2036
- Global Market Analysis 2021 to 2025 and Forecast 2026 to 2036, By Drug Class
- Introduction / Key Findings
- Historical Market Size Value (USD Million) Analysis By Drug Class , 2021 to 2025
- Current and Future Market Size Value (USD Million) Analysis and Forecast By Drug Class , 2026 to 2036
- Liraglutide
- GLP-1 Receptor Agonist Therapy
- Appetite Regulation Treatment
- Phentermine
- Short-Term Weight Loss Drug
- Sympathomimetic Appetite Suppressant
- Setmelanotide
- MC4R Agonist Therapy
- Genetic Obesity Disorder Treatment
- Lorcaserin
- Serotonin Receptor Agonist
- Weight Management Therapy
- Others
- Emerging Anti-Obesity Drugs
- Combination Pharmacotherapies
- Liraglutide
- Y-o-Y Growth Trend Analysis By Drug Class , 2021 to 2025
- Absolute $ Opportunity Analysis By Drug Class , 2026 to 2036
- Global Market Analysis 2021 to 2025 and Forecast 2026 to 2036, By Route of Administration
- Introduction / Key Findings
- Historical Market Size Value (USD Million) Analysis By Route of Administration, 2021 to 2025
- Current and Future Market Size Value (USD Million) Analysis and Forecast By Route of Administration, 2026 to 2036
- Injectable
- Subcutaneous GLP-1 Injections
- Long-Acting Hormonal Therapies
- Oral
- Tablet-Based Weight Management Drugs
- Daily Dose Medications
- Injectable
- Y-o-Y Growth Trend Analysis By Route of Administration, 2021 to 2025
- Absolute $ Opportunity Analysis By Route of Administration, 2026 to 2036
- Global Market Analysis 2021 to 2025 and Forecast 2026 to 2036, By Distribution Channel
- Introduction / Key Findings
- Historical Market Size Value (USD Million) Analysis By Distribution Channel, 2021 to 2025
- Current and Future Market Size Value (USD Million) Analysis and Forecast By Distribution Channel, 2026 to 2036
- Hospital Pharmacies
- Pediatric Specialty Hospitals
- Endocrinology Departments
- Retail Pharmacies
- Community Pharmacies
- Prescription Refill Services
- Online Pharmacies
- E-Pharmacy Pediatric Medications
- Home Delivery Services
- Hospital Pharmacies
- Y-o-Y Growth Trend Analysis By Distribution Channel, 2021 to 2025
- Absolute $ Opportunity Analysis By Distribution Channel, 2026 to 2036
- Global Market Analysis 2021 to 2025 and Forecast 2026 to 2036, By Age Group
- Introduction / Key Findings
- Historical Market Size Value (USD Million) Analysis By Age Group, 2021 to 2025
- Current and Future Market Size Value (USD Million) Analysis and Forecast By Age Group, 2026 to 2036
- Adolescents (12–18 Years)
- Teen Obesity Management Programs
- Lifestyle & Pharmacological Treatment
- Children (6–12 Years)
- School-Age Intervention Programs
- Nutritional Therapy
- Early Childhood (2–5 Years)
- Parental Guided Nutrition Plans
- Behavioral Therapy
- Adolescents (12–18 Years)
- Y-o-Y Growth Trend Analysis By Age Group, 2021 to 2025
- Absolute $ Opportunity Analysis By Age Group, 2026 to 2036
- Global Market Analysis 2021 to 2025 and Forecast 2026 to 2036, By Care Setting
- Introduction / Key Findings
- Historical Market Size Value (USD Million) Analysis By Care Setting, 2021 to 2025
- Current and Future Market Size Value (USD Million) Analysis and Forecast By Care Setting, 2026 to 2036
- Hospitals
- Pediatric Endocrinology Value (USD Million)s
- Multidisciplinary Obesity Clinics
- Specialty Clinics
- Weight Management Clinics
- Pediatric Nutrition Centers
- Homecare Settings
- Telehealth Monitoring
- Family-Based Lifestyle Programs
- Hospitals
- Y-o-Y Growth Trend Analysis By Care Setting, 2021 to 2025
- Absolute $ Opportunity Analysis By Care Setting, 2026 to 2036
- Global Market Analysis 2021 to 2025 and Forecast 2026 to 2036, By Treatment Type
- Introduction / Key Findings
- Historical Market Size Value (USD Million) Analysis By Treatment Type, 2021 to 2025
- Current and Future Market Size Value (USD Million) Analysis and Forecast By Treatment Type, 2026 to 2036
- Lifestyle & Behavioral Therapy
- Dietary Intervention Programs
- Physical Activity & Exercise Plans
- Pharmacotherapy
- Prescription Weight Management Drugs
- Hormonal & Metabolic Treatments
- Surgical Treatment
- Bariatric Surgery (Adolescents)
- Minimally Invasive Weight Loss Procedures
- Lifestyle & Behavioral Therapy
- Y-o-Y Growth Trend Analysis By Treatment Type, 2021 to 2025
- Absolute $ Opportunity Analysis By Treatment Type, 2026 to 2036
- Global Market Analysis 2021 to 2025 and Forecast 2026 to 2036, By Region
- Introduction
- Historical Market Size Value (USD Million) Analysis By Region, 2021 to 2025
- Current Market Size Value (USD Million) Analysis and Forecast By Region, 2026 to 2036
- North America
- Latin America
- Western Europe
- Eastern Europe
- East Asia
- South Asia and Pacific
- Middle East & Africa
- Market Attractiveness Analysis By Region
- North America Market Analysis 2021 to 2025 and Forecast 2026 to 2036, By Country
- Historical Market Size Value (USD Million) Trend Analysis By Market Taxonomy, 2021 to 2025
- Market Size Value (USD Million) Forecast By Market Taxonomy, 2026 to 2036
- By Country
- USA
- Canada
- Mexico
- By Drug Class
- By Route of Administration
- By Distribution Channel
- By Age Group
- By Care Setting
- By Treatment Type
- By Country
- Market Attractiveness Analysis
- By Country
- By Drug Class
- By Route of Administration
- By Distribution Channel
- By Age Group
- By Care Setting
- By Treatment Type
- Key Takeaways
- Latin America Market Analysis 2021 to 2025 and Forecast 2026 to 2036, By Country
- Historical Market Size Value (USD Million) Trend Analysis By Market Taxonomy, 2021 to 2025
- Market Size Value (USD Million) Forecast By Market Taxonomy, 2026 to 2036
- By Country
- Brazil
- Chile
- Rest of Latin America
- By Drug Class
- By Route of Administration
- By Distribution Channel
- By Age Group
- By Care Setting
- By Treatment Type
- By Country
- Market Attractiveness Analysis
- By Country
- By Drug Class
- By Route of Administration
- By Distribution Channel
- By Age Group
- By Care Setting
- By Treatment Type
- Key Takeaways
- Western Europe Market Analysis 2021 to 2025 and Forecast 2026 to 2036, By Country
- Historical Market Size Value (USD Million) Trend Analysis By Market Taxonomy, 2021 to 2025
- Market Size Value (USD Million) Forecast By Market Taxonomy, 2026 to 2036
- By Country
- Germany
- UK
- Italy
- Spain
- France
- Nordic
- BENELUX
- Rest of Western Europe
- By Drug Class
- By Route of Administration
- By Distribution Channel
- By Age Group
- By Care Setting
- By Treatment Type
- By Country
- Market Attractiveness Analysis
- By Country
- By Drug Class
- By Route of Administration
- By Distribution Channel
- By Age Group
- By Care Setting
- By Treatment Type
- Key Takeaways
- Eastern Europe Market Analysis 2021 to 2025 and Forecast 2026 to 2036, By Country
- Historical Market Size Value (USD Million) Trend Analysis By Market Taxonomy, 2021 to 2025
- Market Size Value (USD Million) Forecast By Market Taxonomy, 2026 to 2036
- By Country
- Russia
- Poland
- Hungary
- Balkan & Baltic
- Rest of Eastern Europe
- By Drug Class
- By Route of Administration
- By Distribution Channel
- By Age Group
- By Care Setting
- By Treatment Type
- By Country
- Market Attractiveness Analysis
- By Country
- By Drug Class
- By Route of Administration
- By Distribution Channel
- By Age Group
- By Care Setting
- By Treatment Type
- Key Takeaways
- East Asia Market Analysis 2021 to 2025 and Forecast 2026 to 2036, By Country
- Historical Market Size Value (USD Million) Trend Analysis By Market Taxonomy, 2021 to 2025
- Market Size Value (USD Million) Forecast By Market Taxonomy, 2026 to 2036
- By Country
- China
- Japan
- South Korea
- By Drug Class
- By Route of Administration
- By Distribution Channel
- By Age Group
- By Care Setting
- By Treatment Type
- By Country
- Market Attractiveness Analysis
- By Country
- By Drug Class
- By Route of Administration
- By Distribution Channel
- By Age Group
- By Care Setting
- By Treatment Type
- Key Takeaways
- South Asia and Pacific Market Analysis 2021 to 2025 and Forecast 2026 to 2036, By Country
- Historical Market Size Value (USD Million) Trend Analysis By Market Taxonomy, 2021 to 2025
- Market Size Value (USD Million) Forecast By Market Taxonomy, 2026 to 2036
- By Country
- India
- ASEAN
- Australia & New Zealand
- Rest of South Asia and Pacific
- By Drug Class
- By Route of Administration
- By Distribution Channel
- By Age Group
- By Care Setting
- By Treatment Type
- By Country
- Market Attractiveness Analysis
- By Country
- By Drug Class
- By Route of Administration
- By Distribution Channel
- By Age Group
- By Care Setting
- By Treatment Type
- Key Takeaways
- Middle East & Africa Market Analysis 2021 to 2025 and Forecast 2026 to 2036, By Country
- Historical Market Size Value (USD Million) Trend Analysis By Market Taxonomy, 2021 to 2025
- Market Size Value (USD Million) Forecast By Market Taxonomy, 2026 to 2036
- By Country
- Kingdom of Saudi Arabia
- Other GCC Countries
- Turkiye
- South Africa
- Other African Union
- Rest of Middle East & Africa
- By Drug Class
- By Route of Administration
- By Distribution Channel
- By Age Group
- By Care Setting
- By Treatment Type
- By Country
- Market Attractiveness Analysis
- By Country
- By Drug Class
- By Route of Administration
- By Distribution Channel
- By Age Group
- By Care Setting
- By Treatment Type
- Key Takeaways
- Key Countries Market Analysis
- USA
- Pricing Analysis
- Market Share Analysis, 2025
- By Drug Class
- By Route of Administration
- By Distribution Channel
- By Age Group
- By Care Setting
- By Treatment Type
- Canada
- Pricing Analysis
- Market Share Analysis, 2025
- By Drug Class
- By Route of Administration
- By Distribution Channel
- By Age Group
- By Care Setting
- By Treatment Type
- Mexico
- Pricing Analysis
- Market Share Analysis, 2025
- By Drug Class
- By Route of Administration
- By Distribution Channel
- By Age Group
- By Care Setting
- By Treatment Type
- Brazil
- Pricing Analysis
- Market Share Analysis, 2025
- By Drug Class
- By Route of Administration
- By Distribution Channel
- By Age Group
- By Care Setting
- By Treatment Type
- Chile
- Pricing Analysis
- Market Share Analysis, 2025
- By Drug Class
- By Route of Administration
- By Distribution Channel
- By Age Group
- By Care Setting
- By Treatment Type
- Germany
- Pricing Analysis
- Market Share Analysis, 2025
- By Drug Class
- By Route of Administration
- By Distribution Channel
- By Age Group
- By Care Setting
- By Treatment Type
- UK
- Pricing Analysis
- Market Share Analysis, 2025
- By Drug Class
- By Route of Administration
- By Distribution Channel
- By Age Group
- By Care Setting
- By Treatment Type
- Italy
- Pricing Analysis
- Market Share Analysis, 2025
- By Drug Class
- By Route of Administration
- By Distribution Channel
- By Age Group
- By Care Setting
- By Treatment Type
- Spain
- Pricing Analysis
- Market Share Analysis, 2025
- By Drug Class
- By Route of Administration
- By Distribution Channel
- By Age Group
- By Care Setting
- By Treatment Type
- France
- Pricing Analysis
- Market Share Analysis, 2025
- By Drug Class
- By Route of Administration
- By Distribution Channel
- By Age Group
- By Care Setting
- By Treatment Type
- India
- Pricing Analysis
- Market Share Analysis, 2025
- By Drug Class
- By Route of Administration
- By Distribution Channel
- By Age Group
- By Care Setting
- By Treatment Type
- ASEAN
- Pricing Analysis
- Market Share Analysis, 2025
- By Drug Class
- By Route of Administration
- By Distribution Channel
- By Age Group
- By Care Setting
- By Treatment Type
- Australia & New Zealand
- Pricing Analysis
- Market Share Analysis, 2025
- By Drug Class
- By Route of Administration
- By Distribution Channel
- By Age Group
- By Care Setting
- By Treatment Type
- China
- Pricing Analysis
- Market Share Analysis, 2025
- By Drug Class
- By Route of Administration
- By Distribution Channel
- By Age Group
- By Care Setting
- By Treatment Type
- Japan
- Pricing Analysis
- Market Share Analysis, 2025
- By Drug Class
- By Route of Administration
- By Distribution Channel
- By Age Group
- By Care Setting
- By Treatment Type
- South Korea
- Pricing Analysis
- Market Share Analysis, 2025
- By Drug Class
- By Route of Administration
- By Distribution Channel
- By Age Group
- By Care Setting
- By Treatment Type
- Russia
- Pricing Analysis
- Market Share Analysis, 2025
- By Drug Class
- By Route of Administration
- By Distribution Channel
- By Age Group
- By Care Setting
- By Treatment Type
- Poland
- Pricing Analysis
- Market Share Analysis, 2025
- By Drug Class
- By Route of Administration
- By Distribution Channel
- By Age Group
- By Care Setting
- By Treatment Type
- Hungary
- Pricing Analysis
- Market Share Analysis, 2025
- By Drug Class
- By Route of Administration
- By Distribution Channel
- By Age Group
- By Care Setting
- By Treatment Type
- Kingdom of Saudi Arabia
- Pricing Analysis
- Market Share Analysis, 2025
- By Drug Class
- By Route of Administration
- By Distribution Channel
- By Age Group
- By Care Setting
- By Treatment Type
- Turkiye
- Pricing Analysis
- Market Share Analysis, 2025
- By Drug Class
- By Route of Administration
- By Distribution Channel
- By Age Group
- By Care Setting
- By Treatment Type
- South Africa
- Pricing Analysis
- Market Share Analysis, 2025
- By Drug Class
- By Route of Administration
- By Distribution Channel
- By Age Group
- By Care Setting
- By Treatment Type
- USA
- Market Structure Analysis
- Competition Dashboard
- Competition Benchmarking
- Market Share Analysis of Top Players
- By Regional
- By Drug Class
- By Route of Administration
- By Distribution Channel
- By Age Group
- By Care Setting
- By Treatment Type
- Competition Analysis
- Competition Deep Dive
- Novo Nordisk
- Overview
- Product Portfolio
- Profitability by Market Segments (Product/Age /Sales Channel/Region)
- Sales Footprint
- Strategy Overview
- Marketing Strategy
- Product Strategy
- Channel Strategy
- Eli Lilly and Company
- Medtronic plc
- WW International
- Nestlé Health Science
- Johnson & Johnson (Ethicon)
- Allurion Technologies
- Pfizer
- Bristol-Myers Squibb
- Abbott Laboratories
- Medifast
- F. Hoffmann-La Roche Ltd
- Vivus, Inc.
- Sanofi
- Nestlé
- Danone
- Kraft Heinz
- Amgen
- Merck
- Cigna
- Novo Nordisk
- Competition Deep Dive
- Assumptions & Acronyms Used


