Obesity-Diabetes Drugs Market Size and Share Forecast Outlook From 2025 to 2035

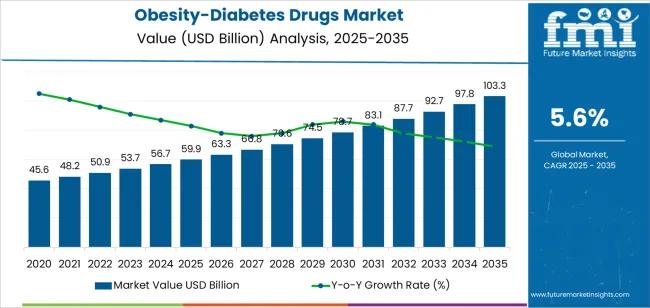
The obesity-diabetes drugs market is witnessing accelerated growth due to the rising global prevalence of metabolic disorders and increasing awareness of the interrelationship between obesity and type 2 diabetes. Clinical research publications and pharmaceutical investor briefings have emphasized the convergence of treatment protocols, with dual-benefit drugs targeting both conditions simultaneously.

This convergence has been reinforced by clinical trials showing improved glycemic control and weight reduction through combination therapies and GLP-1 receptor agonists. Healthcare systems have also intensified efforts to manage these comorbidities with early pharmacological interventions, supported by expanded reimbursement coverage and public health programs.

Additionally, pharmaceutical innovation in oral drug formulations, once-weekly injectables, and fixed-dose combinations is improving patient adherence and therapy outcomes. Future market growth is expected to be driven by the launch of novel therapies, pipeline drugs targeting dual pathways, and the increasing adoption of chronic care models in managing lifestyle diseases. Segmental strength is expected to be led by Drug Therapy, Oral Administration, and Institutional Sales, each shaped by clinical efficacy, patient convenience, and structured healthcare delivery.
Quick Stats for Obesity-Diabetes Drugs Market

  • Obesity-Diabetes Drugs Market Industry Value (2025): USD 59.9 billion
  • Obesity-Diabetes Drugs Market Forecast Value (2035): USD 103.3 billion
  • Obesity-Diabetes Drugs Market Forecast CAGR: 5.6%
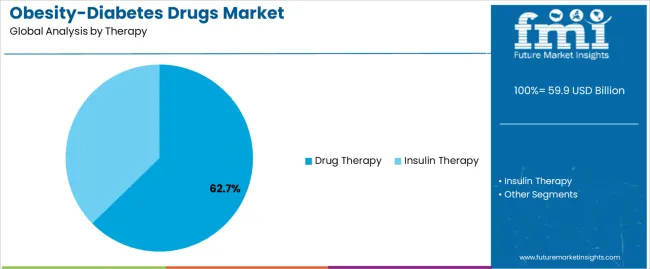
  • Leading Segment in Obesity-Diabetes Drugs Market in 2025: Drug Therapy (62.7%)
  • Key Growth Region in Obesity-Diabetes Drugs Market: North America, Asia-Pacific, Europe
  • Top Key Players in Obesity-Diabetes Drugs Market: Novo Nordisk A/S, Boehringer Ingelheim International GmbH, Eli Lilly And Company, Sanofi, Janssen Pharmaceuticals Inc., AstraZeneca, Novartis, Pfizer, Merck & Co., Inc., Takeda Pharmaceuticals, Bayer AG, Vertex Pharmaceuticals Incorporated, MannKind Corporation, Xeris Pharmaceuticals, Amphastar Pharmaceuticals, Inc., Dr. Reddy’s Laboratories, LUSOCHIMICA S.p.A., GLENMARK PHARMACEUTICALS LTD.

Obesity Diabetes Drugs Market   Market Value Analysis

Metric Value
Obesity-Diabetes Drugs Market Estimated Value in (2025 E) USD 59.9 billion
Obesity-Diabetes Drugs Market Forecast Value in (2035 F) USD 103.3 billion
Forecast CAGR (2025 to 2035) 5.6%

Segmental Analysis

The market is segmented by Therapy, Route Of Administration, and Distribution Channel and region. By Therapy, the market is divided into Drug Therapy and Insulin Therapy. In terms of Route Of Administration, the market is classified into Oral Administration, Nasal Administration, and Parenteral Administration. Based on Distribution Channel, the market is segmented into Institutional Sales and Retail Sales. Regionally, the market is classified into North America, Latin America, Western Europe, Eastern Europe, Balkan & Baltic Countries, Russia & Belarus, Central Asia, East Asia, South Asia & Pacific, and the Middle East & Africa.
Insights into the Therapy Segment: Drug Therapy

Obesity Diabetes Drugs Market Analysis By Therapy

The Drug Therapy segment is projected to account for 62.7% of the obesity-diabetes drugs market revenue in 2025, asserting its dominance as the leading therapeutic approach. This growth has been supported by the clinical effectiveness of pharmacological interventions in controlling weight and blood glucose levels simultaneously.

Healthcare providers have increasingly prescribed pharmacotherapy as the frontline treatment for patients with overlapping metabolic conditions, particularly when lifestyle interventions have shown limited results. The development and regulatory approval of multi-target drugs, including GLP-1 receptor agonists and SGLT2 inhibitors, have expanded the therapeutic landscape and boosted adoption rates.

Furthermore, treatment guidelines from leading medical associations have incorporated drug therapy into standard care protocols, driving wider clinical use. As pharmaceutical companies continue to invest in novel molecules that offer dual metabolic benefits, the Drug Therapy segment is expected to sustain its leadership position, reinforced by both clinical outcomes and growing patient demand.
Insights into the Route of Administration Segment: Oral Administration

Obesity Diabetes Drugs Market Analysis By Route Of Administration

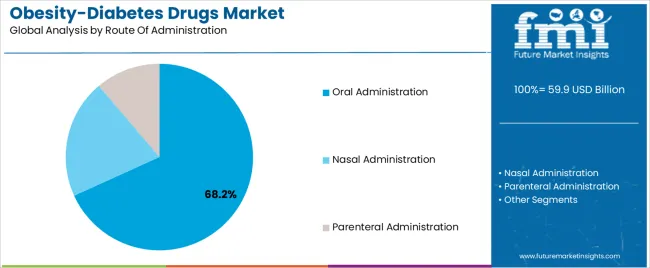
The Oral Administration segment is projected to capture 68.2% of the obesity-diabetes drugs market revenue in 2025, making it the most preferred delivery method. Growth of this segment has been attributed to the convenience, ease of use, and high patient adherence associated with oral medications.

Clinical trials and pharmacological studies have highlighted strong patient preference for oral drug regimens, particularly in chronic disease management where long-term compliance is essential. The pharmaceutical industry has prioritized the development of oral formulations that combine multiple therapeutic agents, enabling simplified dosing schedules and reduced pill burden.

Additionally, oral drugs have been cost-effective for healthcare systems, especially in primary care settings, which has increased their accessibility through public and private insurance programs. As new oral agents with favorable safety profiles and improved efficacy reach the market, and as digital health tools support medication adherence, the Oral Administration segment is expected to remain the primary route of therapy in this space.
Insights into the Distribution Channel Segment: Institutional Sales

Obesity Diabetes Drugs Market Analysis By Distribution Channel

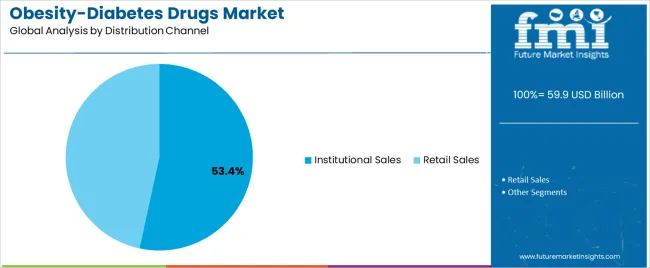
The Institutional Sales segment is projected to contribute 53.4% of the obesity-diabetes drugs market revenue in 2025, holding its position as the dominant distribution channel. This growth has been driven by the structured and large-scale procurement models used by hospitals, clinics, and government health programs.

Institutional buyers have favored obesity-diabetes drug procurement for formulary inclusion due to increasing hospitalizations linked to metabolic complications and the need for immediate intervention. Public health agencies and insurance-backed programs have bulk-purchased medications for distribution through national or regional healthcare systems, contributing to predictable and large-volume sales.

Moreover, institutional channels have enabled better control over prescription protocols, ensuring that therapies align with clinical guidelines and treatment algorithms. As integrated healthcare systems expand and centralized purchasing grows in both developed and emerging markets, Institutional Sales are expected to maintain a significant role in driving drug access and adoption across healthcare facilities.

Top Obesity-Diabetes Drugs Market Dynamics and Industry Trends

Product Portfolio Expansion by Receiving Approval for New and Existing Drugs

Growing number of obesity diabetes cases has brought new opportunities for key players in the industry to expand their product portfolio by receiving approval for their drugs in the industry. For instance, in May 2025, Eli Lilly and Company received approval from the United States Food and Drug Administration (FDA) for their Mounjaro drug which is a GLP-1 receptor agonist and is indicated for improving the glycemic controls in adults with type 2 diabetes.

Rising Prevalence of Obese People Augments the Demand for Obesity-Diabetes Drugs

Individuals sitting for long continuous hours in front of screen, reduced number of physical activities, and the increased accessibility and consumption of wide range of unhealthy food items are some of the major reasons contributing to increase in number of people suffering from obesity diabetes. For instance, according to a press released by the Economic Times in April 2025, poor and unhealthy diet has contributed to over 45.6 million cases of type 2 diabetes in the year 2020 which represented over 70.0% of new diagnosis globally.

Emerging Trends in Personalized Nutrition and Functional Supplements

The landscape of obesity diabetes drugs is rapidly evolving, driven by increasing number of people following sedentary lifestyle and opting for products that can aid them in management of their obesity-diabetes. In order to reach more number of people seeking for the treatment and expand their customer base many of the key players operating in the industry are focusing on strategic collaboration for raising awareness of the disease through new diabetic awareness program.

There is also growing preference for personalized medicines that are tailored to individual needs, reflecting a shift in the approach to obesity-diabetes management. Recognizing that one-size-fits-all is not the way to go, more consumers and manufacturers are gravitating toward personalized obesity-diabetes drugs.

Comparison of Historical vs Forecast Outlook for Obesity-Diabetes Drugs Sales (2020 to 2024 vs 2025 to 2035)

Global obesity-diabetes drugs sales increased at a CAGR of 3.9% from 2020 to 2025. For the next ten years, projections are that expenditure on obesity-diabetes drugs will rise at 5.6% CAGR

The rising prevalence of obesity diabetes among younger population has significantly contributed to increase in demand for drugs that are effective in the management of their chronic condition. The rising prevalence has created opportunities for new players to develop and launch their new product to the industry and mark their presence in the existing concentrated industry.

For instance, in January 2025, Adipo Therapeutics, a late stage, preclinical biopharmaceutical company raised a funding of USD 1.9 million in the bridge fund round. The company has planned to invest this amount for the advancement of their asset ADPO-002, a first in class weight loss and diabetes drug.

Going forward the growing focus of emerging nations on improving the affordability of the healthcare services surges the demand for obesity-diabetes drugs in the industry. Surplus, to this, the marketing initiatives taken by pharmaceutical manufacturers for spreading awareness of obesity-diabetes in the untapped markets of the developing regions with an aim of expanding their geographical footprint in the industry further propels the industry growth.

Market Concentration in the Obesity-Diabetes Drugs Sector

The Tier 1 players in this industry dominate the industry and are expected to acquire 52.5% market share in 2025. A few of the Tier 1 players include Boehringer Ingelheim International GmbH, Eli Lilly and Company, Sanofi, Novo Nordisk A/S, AstraZeneca, Novartis, Pfizer, Merck & Co., Inc., Takeda Pharmaceuticals, Bayer AG, and Janssen Pharmaceuticals Inc. Tier 1 companies in the worldwide obesity-diabetes drugs market are using their substantial research and development skills to create novel treatments.

They make considerable investments in clinical studies to demonstrate efficacy and safety, obtain regulatory clearances, and form strategic alliances to broaden industry reach. They use aggressive marketing methods to promote their products and gain a greater piece of the profitable industry.

The Tier 2 companies in this industry include companies like Vertex Pharmaceuticals Incorporated, Mankind Corporation, Xeris Pharmaceuticals, and Amphastar Pharmaceuticals, Inc. All of them together are going to constitute an industry share of 28.3% in 2025.

Tier 2 pharmaceutical firms are adopting new drug delivery methods or specialty therapeutic areas to differentiate themselves. They want to capitalize on industry shortages by providing customized therapies or enhanced formulations. They may seek collaborations with larger companies or enter into license arrangements to have access to the resources and expertise required for product development as well as commercialization.

Analysis of Top Countries Using and Regulating Obesity-Diabetes Drugs

The following table shows the estimated growth rates of the top three markets. China and India are set to exhibit high obesity-diabetes drugs consumption, recording CAGRs of 5.7% and 6.4%, respectively, through 2035.

Countries CAGR 2025 to 2035
The United States 4.7%
China 5.7%
Germany 3.8%
The United Kingdom 4.0%
India 6.4%

United States to Retain Dominance in Obesity-Diabetes Drugs Sales

The obesity-diabetes drugs industry in the United States held a market share of 24.8% and is projected to exhibit a CAGR of 4.7% during the assessment period.

The growing number of people following sedentary lifestyle in the country is majorly contributing to the growth of the industry in the country. The support of healthcare insurance coverage extended by the government of the United States, propels the growth of the industry.

For instance, according to an article published by the National Archives and Records Administration in March 2025, The Office of the Federal Register (OFR) of the National Archives and Records Administration (NARA) have expanded the healthcare coverage nationwide and have lowered the healthcare cost for Americans. They also have a vision of preventing and reducing the pervasiveness of diabetes across the United States by 2035.

Demand Outlook for Obesity-Diabetes Drugs in Germany

Obesity-diabetes drugs market held a industry share of 3.7% in Germany and is calculated to rise at a value CAGR of 3.8% during the forecast period.

The ageing population of the country along with increasing number of young populations following sedentary lifestyle contribute to the rising prevalence of obesity-diabetic patients. For instance, according to an article published by Deutsches Zentrum fur Diabetesforschung in February 2020, an approximate of 7.2% of the population in Germany is suffering from diabetes among which more common is type 2 diabetes.

The growing prognosis has contributed to the growing demand for trained experts and the establishment of new specialized centers in the country, which is ultimately escalating the demand for obesity-diabetes drugs in the industry.

Rising Popularity of Obesity-Diabetes Drugs in China

Consumption of obesity-diabetes drugs in Japan is projected to increase at a value CAGR of 5.7% over the next ten years. By 2035, the industry size is forecasted to reach USD 9,458.8 million, with a current share of 9.4% in the global industry in 2025.

The increasing number of people consuming unhealthy diet with their limited focus on performing physical activities have majorly contributed to increase in number of overweight and obese population in China. Such factors put Chinese population at the increased risk of type 2 diabetes.

For instance, according to the statistics published by World Health Organization (WHO), more than one-third of the Chinese adult population is overweight, while 7% of adults are obese, which puts them at the risk of developing type 2 diabetes.

Obesity-Diabetes Drugs Industry Analysis by Top Investment Segments

Popularity of Drug Therapy due to Ease of Consumption

Segment Drug Therapy (Therapy Type)
Value Share (2025) 55.9%

The ability of drug therapy to aid patients in controlling the blood sugar levels in an effective manner has attributed to its increased industry share. Its safety and tolerance in among all age groups has further contributed to its increased industry share. For instance, according to an article published by National Library of Medicine in January 2024, metformin remains the preferred first line pharmacological drug for the treatment of type 2 diabetes.

Institutional Sales Lead Obesity-Diabetes Drugs Sales

Segment Institutional Sales (Sale Channel)
Value Share (2025) 39.7%

Institutional sales channel accounted for a significant industry share and dominated the industry. The segment is anticipated to advance at 4.7% CAGR during the projection period.

The institutional segment consists of sub-segment including hospitals, specialty clinics and others. The hospital segment accounted for the major share of the industry owing to the increasing number of patients suffering from obesity-diabetes contributing to increase in number of footfall of patients to the hospital.
Key Obesity-Diabetes Drugs Market Players and Competitive Outlook

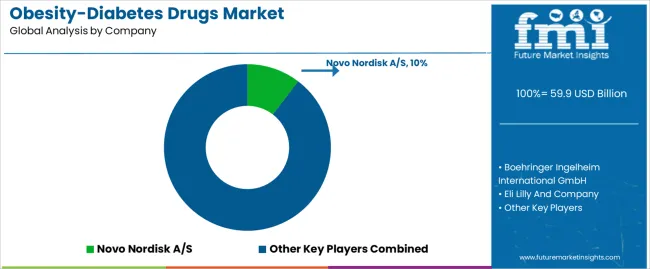
Obesity Diabetes Drugs Market Analysis By Company

In the dynamic landscape of the obesity-diabetes drugs market, key companies operating in the industry are focusing on research and development and launch of new products to the industry. The major aim of these players is to expand their product portfolio and strengthen their product portfolio in the industry. Many of the players are also focusing on strategic acquisitions for expansion of their product portfolio.

For instance

  • In January 2025, GLENMARK PHARMACEUTICALS LTD., launched Lirafit, an anti-diabetic biosimilar of Liraglutide in India. These biosimilar product is indicated for improving the glycemic controls in adult patients suffering from type 2 diabetes mellitus.
  • In November 2024, Novo Nordisk A/S received marketing authorization of Wegovy from the European Medicines Agency’s Committee for Medicinal Products for Human Use (CHMP). It is a semiglutide injection indicated for the chronic weight management in adults living with obesity or weight related comorbidity such as type 2 diabetes.

Leading Obesity-Diabetes Drugs Brands by Market Share

  • Boehringer Ingelheim International GmbH.
  • Eli Lilly and Company
  • Sanofi
  • Vertex Pharmaceuticals Incorporated
  • Novo Nordisk A/S
  • AstraZeneca
  • MannKind Corporation
  • Xeris Pharmaceuticals
  • Amphastar Pharmaceuticals, Inc.
  • Novartis
  • Bayer AG
  • GLENMARK PHARMACEUTICALS LTD.
  • Others

Top Investment Segments Studied in the Obesity-Diabetes Drugs Market

By Therapy:

As per product type, the industry has been categorized into drug therapy (Meglitinides, sulfonylureas, Dipeptidyl-peptidase 4 (DPP-4) inhibitors, biguanides, thiazolidinediones, alpha-glucosidase inhibitors, sodium-glucose co-transporter 2 (SGLT2) inhibitors, bile acid sequestrants and GLP-1 receptor agonists), and insulin therapy (rapid acting insulin, short acting insulin, intermediate acting insulin, long acting insulin and biphasic insulin.

By Route of Administration:

This segment is further categorized into oral administration, nasal administration and parenteral administration (subcutaneous, intramuscular and intravenous).

By Distribution Channel:

Different sales channels include Institutional sales (hospitals, specialty clinics, and others), retail sales (retail pharmacies, and drug stores) and online pharmacy.

By Region:

Industry analysis has been carried out in key countries of North America, Latin America, Europe, East Asia, South Asia, Oceania, and the Middle East & Africa.

Frequently Asked Questions

How big is the obesity-diabetes drugs market in 2025?

The global obesity-diabetes drugs market is estimated to be valued at USD 59.9 billion in 2025.

What will be the size of obesity-diabetes drugs market in 2035?

The market size for the obesity-diabetes drugs market is projected to reach USD 103.3 billion by 2035.

How much will be the obesity-diabetes drugs market growth between 2025 and 2035?

The obesity-diabetes drugs market is expected to grow at a 5.6% CAGR between 2025 and 2035.

What are the key product types in the obesity-diabetes drugs market?

The key product types in obesity-diabetes drugs market are drug therapy, _meglitinides, _sulfonylureas, _dipeptidyl-peptidase 4 (dpp-4) inhibitors, _biguanide, _thiazolidinediones, _alpha-glucosidase inhibitors, _sodium-glucose co-transporter 2 (sglt2) inhibitors, _bile acid sequestrants, _incretin mimetic (glp-1 receptor agonists), insulin therapy, _rapid acting insulin, _short acting insulin, _intermediate acting insulin, _long acting insulin and _biphasic insulin.

Which route of administration segment to contribute significant share in the obesity-diabetes drugs market in 2025?

In terms of route of administration, oral administration segment to command 68.2% share in the obesity-diabetes drugs market in 2025.

Table of Content

  1. Executive Summary
    • Global Market Outlook
    • Demand to side Trends
    • Supply to side Trends
    • Technology Roadmap Analysis
    • Analysis and Recommendations
  2. Market Overview
    • Market Coverage / Taxonomy
    • Market Definition / Scope / Limitations
  3. Market Background
    • Market Dynamics
      • Drivers
      • Restraints
      • Opportunity
      • Trends
    • Scenario Forecast
      • Demand in Optimistic Scenario
      • Demand in Likely Scenario
      • Demand in Conservative Scenario
    • Opportunity Map Analysis
    • Product Life Cycle Analysis
    • Supply Chain Analysis
    • Investment Feasibility Matrix
    • Value Chain Analysis
    • PESTLE and Porter’s Analysis
    • Regulatory Landscape
    • Regional Parent Market Outlook
    • Production and Consumption Statistics
    • Import and Export Statistics
  4. Global Market Analysis 2020 to 2024 and Forecast, 2025 to 2035
    • Historical Market Size Value (USD Million) Analysis, 2020 to 2024
    • Current and Future Market Size Value (USD Million) Projections, 2025 to 2035
      • Y to o to Y Growth Trend Analysis
      • Absolute $ Opportunity Analysis
  5. Global Market Pricing Analysis 2020 to 2024 and Forecast 2025 to 2035
  6. Global Market Analysis 2020 to 2024 and Forecast 2025 to 2035, By Therapy
    • Introduction / Key Findings
    • Historical Market Size Value (USD Million) Analysis By Therapy , 2020 to 2024
    • Current and Future Market Size Value (USD Million) Analysis and Forecast By Therapy , 2025 to 2035
      • Drug Therapy
        • Meglitinides
        • Sulfonylureas
        • Dipeptidyl-Peptidase 4 (DPP-4) Inhibitors
        • Biguanide
        • Thiazolidinediones
        • Alpha-Glucosidase Inhibitors
        • Sodium-Glucose Co-Transporter 2 (SGLT2) Inhibitors
        • Bile Acid Sequestrants
        • Incretin Mimetic (GLP-1 Receptor Agonists)
      • Insulin Therapy
        • Rapid Acting Insulin
        • Short Acting Insulin
        • Intermediate Acting Insulin
        • Long Acting Insulin
        • Biphasic Insulin
    • Y to o to Y Growth Trend Analysis By Therapy , 2020 to 2024
    • Absolute $ Opportunity Analysis By Therapy , 2025 to 2035
  7. Global Market Analysis 2020 to 2024 and Forecast 2025 to 2035, By Route Of Administration
    • Introduction / Key Findings
    • Historical Market Size Value (USD Million) Analysis By Route Of Administration, 2020 to 2024
    • Current and Future Market Size Value (USD Million) Analysis and Forecast By Route Of Administration, 2025 to 2035
      • Oral Administration
      • Nasal Administration
      • Parenteral Administration
        • Subcutaneous
        • Intramuscular
        • Intravenous
    • Y to o to Y Growth Trend Analysis By Route Of Administration, 2020 to 2024
    • Absolute $ Opportunity Analysis By Route Of Administration, 2025 to 2035
  8. Global Market Analysis 2020 to 2024 and Forecast 2025 to 2035, By Distribution Channel
    • Introduction / Key Findings
    • Historical Market Size Value (USD Million) Analysis By Distribution Channel, 2020 to 2024
    • Current and Future Market Size Value (USD Million) Analysis and Forecast By Distribution Channel, 2025 to 2035
      • Institutional Sales
        • Hospitals
        • Specialty Clinics
        • Others
      • Retail Sales
        • Retail Pharmacies
        • Drug Stores
        • Online Pharmacies
    • Y to o to Y Growth Trend Analysis By Distribution Channel, 2020 to 2024
    • Absolute $ Opportunity Analysis By Distribution Channel, 2025 to 2035
  9. Global Market Analysis 2020 to 2024 and Forecast 2025 to 2035, By Region
    • Introduction
    • Historical Market Size Value (USD Million) Analysis By Region, 2020 to 2024
    • Current Market Size Value (USD Million) Analysis and Forecast By Region, 2025 to 2035
      • North America
      • Latin America
      • Western Europe
      • Eastern Europe
      • East Asia
      • South Asia and Pacific
      • Middle East & Africa
    • Market Attractiveness Analysis By Region
  10. North America Market Analysis 2020 to 2024 and Forecast 2025 to 2035, By Country
    • Historical Market Size Value (USD Million) Trend Analysis By Market Taxonomy, 2020 to 2024
    • Market Size Value (USD Million) Forecast By Market Taxonomy, 2025 to 2035
      • By Country
        • USA
        • Canada
        • Mexico
      • By Therapy
      • By Route Of Administration
      • By Distribution Channel
    • Market Attractiveness Analysis
      • By Country
      • By Therapy
      • By Route Of Administration
      • By Distribution Channel
    • Key Takeaways
  11. Latin America Market Analysis 2020 to 2024 and Forecast 2025 to 2035, By Country
    • Historical Market Size Value (USD Million) Trend Analysis By Market Taxonomy, 2020 to 2024
    • Market Size Value (USD Million) Forecast By Market Taxonomy, 2025 to 2035
      • By Country
        • Brazil
        • Chile
        • Rest of Latin America
      • By Therapy
      • By Route Of Administration
      • By Distribution Channel
    • Market Attractiveness Analysis
      • By Country
      • By Therapy
      • By Route Of Administration
      • By Distribution Channel
    • Key Takeaways
  12. Western Europe Market Analysis 2020 to 2024 and Forecast 2025 to 2035, By Country
    • Historical Market Size Value (USD Million) Trend Analysis By Market Taxonomy, 2020 to 2024
    • Market Size Value (USD Million) Forecast By Market Taxonomy, 2025 to 2035
      • By Country
        • Germany
        • UK
        • Italy
        • Spain
        • France
        • Nordic
        • BENELUX
        • Rest of Western Europe
      • By Therapy
      • By Route Of Administration
      • By Distribution Channel
    • Market Attractiveness Analysis
      • By Country
      • By Therapy
      • By Route Of Administration
      • By Distribution Channel
    • Key Takeaways
  13. Eastern Europe Market Analysis 2020 to 2024 and Forecast 2025 to 2035, By Country
    • Historical Market Size Value (USD Million) Trend Analysis By Market Taxonomy, 2020 to 2024
    • Market Size Value (USD Million) Forecast By Market Taxonomy, 2025 to 2035
      • By Country
        • Russia
        • Poland
        • Hungary
        • Balkan & Baltic
        • Rest of Eastern Europe
      • By Therapy
      • By Route Of Administration
      • By Distribution Channel
    • Market Attractiveness Analysis
      • By Country
      • By Therapy
      • By Route Of Administration
      • By Distribution Channel
    • Key Takeaways
  14. East Asia Market Analysis 2020 to 2024 and Forecast 2025 to 2035, By Country
    • Historical Market Size Value (USD Million) Trend Analysis By Market Taxonomy, 2020 to 2024
    • Market Size Value (USD Million) Forecast By Market Taxonomy, 2025 to 2035
      • By Country
        • China
        • Japan
        • South Korea
      • By Therapy
      • By Route Of Administration
      • By Distribution Channel
    • Market Attractiveness Analysis
      • By Country
      • By Therapy
      • By Route Of Administration
      • By Distribution Channel
    • Key Takeaways
  15. South Asia and Pacific Market Analysis 2020 to 2024 and Forecast 2025 to 2035, By Country
    • Historical Market Size Value (USD Million) Trend Analysis By Market Taxonomy, 2020 to 2024
    • Market Size Value (USD Million) Forecast By Market Taxonomy, 2025 to 2035
      • By Country
        • India
        • ASEAN
        • Australia & New Zealand
        • Rest of South Asia and Pacific
      • By Therapy
      • By Route Of Administration
      • By Distribution Channel
    • Market Attractiveness Analysis
      • By Country
      • By Therapy
      • By Route Of Administration
      • By Distribution Channel
    • Key Takeaways
  16. Middle East & Africa Market Analysis 2020 to 2024 and Forecast 2025 to 2035, By Country
    • Historical Market Size Value (USD Million) Trend Analysis By Market Taxonomy, 2020 to 2024
    • Market Size Value (USD Million) Forecast By Market Taxonomy, 2025 to 2035
      • By Country
        • Kingdom of Saudi Arabia
        • Other GCC Countries
        • Turkiye
        • South Africa
        • Other African Union
        • Rest of Middle East & Africa
      • By Therapy
      • By Route Of Administration
      • By Distribution Channel
    • Market Attractiveness Analysis
      • By Country
      • By Therapy
      • By Route Of Administration
      • By Distribution Channel
    • Key Takeaways
  17. Key Countries Market Analysis
    • USA
      • Pricing Analysis
      • Market Share Analysis, 2024
        • By Therapy
        • By Route Of Administration
        • By Distribution Channel
    • Canada
      • Pricing Analysis
      • Market Share Analysis, 2024
        • By Therapy
        • By Route Of Administration
        • By Distribution Channel
    • Mexico
      • Pricing Analysis
      • Market Share Analysis, 2024
        • By Therapy
        • By Route Of Administration
        • By Distribution Channel
    • Brazil
      • Pricing Analysis
      • Market Share Analysis, 2024
        • By Therapy
        • By Route Of Administration
        • By Distribution Channel
    • Chile
      • Pricing Analysis
      • Market Share Analysis, 2024
        • By Therapy
        • By Route Of Administration
        • By Distribution Channel
    • Germany
      • Pricing Analysis
      • Market Share Analysis, 2024
        • By Therapy
        • By Route Of Administration
        • By Distribution Channel
    • UK
      • Pricing Analysis
      • Market Share Analysis, 2024
        • By Therapy
        • By Route Of Administration
        • By Distribution Channel
    • Italy
      • Pricing Analysis
      • Market Share Analysis, 2024
        • By Therapy
        • By Route Of Administration
        • By Distribution Channel
    • Spain
      • Pricing Analysis
      • Market Share Analysis, 2024
        • By Therapy
        • By Route Of Administration
        • By Distribution Channel
    • France
      • Pricing Analysis
      • Market Share Analysis, 2024
        • By Therapy
        • By Route Of Administration
        • By Distribution Channel
    • India
      • Pricing Analysis
      • Market Share Analysis, 2024
        • By Therapy
        • By Route Of Administration
        • By Distribution Channel
    • ASEAN
      • Pricing Analysis
      • Market Share Analysis, 2024
        • By Therapy
        • By Route Of Administration
        • By Distribution Channel
    • Australia & New Zealand
      • Pricing Analysis
      • Market Share Analysis, 2024
        • By Therapy
        • By Route Of Administration
        • By Distribution Channel
    • China
      • Pricing Analysis
      • Market Share Analysis, 2024
        • By Therapy
        • By Route Of Administration
        • By Distribution Channel
    • Japan
      • Pricing Analysis
      • Market Share Analysis, 2024
        • By Therapy
        • By Route Of Administration
        • By Distribution Channel
    • South Korea
      • Pricing Analysis
      • Market Share Analysis, 2024
        • By Therapy
        • By Route Of Administration
        • By Distribution Channel
    • Russia
      • Pricing Analysis
      • Market Share Analysis, 2024
        • By Therapy
        • By Route Of Administration
        • By Distribution Channel
    • Poland
      • Pricing Analysis
      • Market Share Analysis, 2024
        • By Therapy
        • By Route Of Administration
        • By Distribution Channel
    • Hungary
      • Pricing Analysis
      • Market Share Analysis, 2024
        • By Therapy
        • By Route Of Administration
        • By Distribution Channel
    • Kingdom of Saudi Arabia
      • Pricing Analysis
      • Market Share Analysis, 2024
        • By Therapy
        • By Route Of Administration
        • By Distribution Channel
    • Turkiye
      • Pricing Analysis
      • Market Share Analysis, 2024
        • By Therapy
        • By Route Of Administration
        • By Distribution Channel
    • South Africa
      • Pricing Analysis
      • Market Share Analysis, 2024
        • By Therapy
        • By Route Of Administration
        • By Distribution Channel
  18. Market Structure Analysis
    • Competition Dashboard
    • Competition Benchmarking
    • Market Share Analysis of Top Players
      • By Regional
      • By Therapy
      • By Route Of Administration
      • By Distribution Channel
  19. Competition Analysis
    • Competition Deep Dive
      • Novo Nordisk A/S
        • Overview
        • Product Portfolio
        • Profitability by Market Segments (Product/Age /Sales Channel/Region)
        • Sales Footprint
        • Strategy Overview
          • Marketing Strategy
          • Product Strategy
          • Channel Strategy
      • Boehringer Ingelheim International GmbH
      • Eli Lilly And Company
      • Sanofi
      • Janssen Pharmaceuticals Inc.
      • AstraZeneca
      • Novartis
      • Pfizer
      • Merck & Co., Inc.
      • Takeda Pharmaceuticals
      • Bayer AG
      • Vertex Pharmaceuticals Incorporated
      • MannKind Corporation
      • Xeris Pharmaceuticals
      • Amphastar Pharmaceuticals, Inc.
      • Dr. Reddy’s Laboratories
      • LUSOCHIMICA S.p.A.
      • GLENMARK PHARMACEUTICALS LTD.
  20. Assumptions & Acronyms Used
  21. Research Methodology

List of Tables

  • Table 1: Global Market Value (USD Million) Forecast by Region, 2020 to 2035
  • Table 2: Global Market Value (USD Million) Forecast by Therapy , 2020 to 2035
  • Table 3: Global Market Value (USD Million) Forecast by Route Of Administration, 2020 to 2035
  • Table 4: Global Market Value (USD Million) Forecast by Distribution Channel, 2020 to 2035
  • Table 5: North America Market Value (USD Million) Forecast by Country, 2020 to 2035
  • Table 6: North America Market Value (USD Million) Forecast by Therapy , 2020 to 2035
  • Table 7: North America Market Value (USD Million) Forecast by Route Of Administration, 2020 to 2035
  • Table 8: North America Market Value (USD Million) Forecast by Distribution Channel, 2020 to 2035
  • Table 9: Latin America Market Value (USD Million) Forecast by Country, 2020 to 2035
  • Table 10: Latin America Market Value (USD Million) Forecast by Therapy , 2020 to 2035
  • Table 11: Latin America Market Value (USD Million) Forecast by Route Of Administration, 2020 to 2035
  • Table 12: Latin America Market Value (USD Million) Forecast by Distribution Channel, 2020 to 2035
  • Table 13: Western Europe Market Value (USD Million) Forecast by Country, 2020 to 2035
  • Table 14: Western Europe Market Value (USD Million) Forecast by Therapy , 2020 to 2035
  • Table 15: Western Europe Market Value (USD Million) Forecast by Route Of Administration, 2020 to 2035
  • Table 16: Western Europe Market Value (USD Million) Forecast by Distribution Channel, 2020 to 2035
  • Table 17: Eastern Europe Market Value (USD Million) Forecast by Country, 2020 to 2035
  • Table 18: Eastern Europe Market Value (USD Million) Forecast by Therapy , 2020 to 2035
  • Table 19: Eastern Europe Market Value (USD Million) Forecast by Route Of Administration, 2020 to 2035
  • Table 20: Eastern Europe Market Value (USD Million) Forecast by Distribution Channel, 2020 to 2035
  • Table 21: East Asia Market Value (USD Million) Forecast by Country, 2020 to 2035
  • Table 22: East Asia Market Value (USD Million) Forecast by Therapy , 2020 to 2035
  • Table 23: East Asia Market Value (USD Million) Forecast by Route Of Administration, 2020 to 2035
  • Table 24: East Asia Market Value (USD Million) Forecast by Distribution Channel, 2020 to 2035
  • Table 25: South Asia and Pacific Market Value (USD Million) Forecast by Country, 2020 to 2035
  • Table 26: South Asia and Pacific Market Value (USD Million) Forecast by Therapy , 2020 to 2035
  • Table 27: South Asia and Pacific Market Value (USD Million) Forecast by Route Of Administration, 2020 to 2035
  • Table 28: South Asia and Pacific Market Value (USD Million) Forecast by Distribution Channel, 2020 to 2035
  • Table 29: Middle East & Africa Market Value (USD Million) Forecast by Country, 2020 to 2035
  • Table 30: Middle East & Africa Market Value (USD Million) Forecast by Therapy , 2020 to 2035
  • Table 31: Middle East & Africa Market Value (USD Million) Forecast by Route Of Administration, 2020 to 2035
  • Table 32: Middle East & Africa Market Value (USD Million) Forecast by Distribution Channel, 2020 to 2035

List of Figures

  • Figure 1: Global Market Pricing Analysis
  • Figure 2: Global Market Value (USD Million) Forecast 2020-2035
  • Figure 3: Global Market Value Share and BPS Analysis by Therapy , 2025 and 2035
  • Figure 4: Global Market Y to o to Y Growth Comparison by Therapy , 2025-2035
  • Figure 5: Global Market Attractiveness Analysis by Therapy
  • Figure 6: Global Market Value Share and BPS Analysis by Route Of Administration, 2025 and 2035
  • Figure 7: Global Market Y to o to Y Growth Comparison by Route Of Administration, 2025-2035
  • Figure 8: Global Market Attractiveness Analysis by Route Of Administration
  • Figure 9: Global Market Value Share and BPS Analysis by Distribution Channel, 2025 and 2035
  • Figure 10: Global Market Y to o to Y Growth Comparison by Distribution Channel, 2025-2035
  • Figure 11: Global Market Attractiveness Analysis by Distribution Channel
  • Figure 12: Global Market Value (USD Million) Share and BPS Analysis by Region, 2025 and 2035
  • Figure 13: Global Market Y to o to Y Growth Comparison by Region, 2025-2035
  • Figure 14: Global Market Attractiveness Analysis by Region
  • Figure 15: North America Market Incremental Dollar Opportunity, 2025-2035
  • Figure 16: Latin America Market Incremental Dollar Opportunity, 2025-2035
  • Figure 17: Western Europe Market Incremental Dollar Opportunity, 2025-2035
  • Figure 18: Eastern Europe Market Incremental Dollar Opportunity, 2025-2035
  • Figure 19: East Asia Market Incremental Dollar Opportunity, 2025-2035
  • Figure 20: South Asia and Pacific Market Incremental Dollar Opportunity, 2025-2035
  • Figure 21: Middle East & Africa Market Incremental Dollar Opportunity, 2025-2035
  • Figure 22: North America Market Value Share and BPS Analysis by Country, 2025 and 2035
  • Figure 23: North America Market Value Share and BPS Analysis by Therapy , 2025 and 2035
  • Figure 24: North America Market Y to o to Y Growth Comparison by Therapy , 2025-2035
  • Figure 25: North America Market Attractiveness Analysis by Therapy
  • Figure 26: North America Market Value Share and BPS Analysis by Route Of Administration, 2025 and 2035
  • Figure 27: North America Market Y to o to Y Growth Comparison by Route Of Administration, 2025-2035
  • Figure 28: North America Market Attractiveness Analysis by Route Of Administration
  • Figure 29: North America Market Value Share and BPS Analysis by Distribution Channel, 2025 and 2035
  • Figure 30: North America Market Y to o to Y Growth Comparison by Distribution Channel, 2025-2035
  • Figure 31: North America Market Attractiveness Analysis by Distribution Channel
  • Figure 32: Latin America Market Value Share and BPS Analysis by Country, 2025 and 2035
  • Figure 33: Latin America Market Value Share and BPS Analysis by Therapy , 2025 and 2035
  • Figure 34: Latin America Market Y to o to Y Growth Comparison by Therapy , 2025-2035
  • Figure 35: Latin America Market Attractiveness Analysis by Therapy
  • Figure 36: Latin America Market Value Share and BPS Analysis by Route Of Administration, 2025 and 2035
  • Figure 37: Latin America Market Y to o to Y Growth Comparison by Route Of Administration, 2025-2035
  • Figure 38: Latin America Market Attractiveness Analysis by Route Of Administration
  • Figure 39: Latin America Market Value Share and BPS Analysis by Distribution Channel, 2025 and 2035
  • Figure 40: Latin America Market Y to o to Y Growth Comparison by Distribution Channel, 2025-2035
  • Figure 41: Latin America Market Attractiveness Analysis by Distribution Channel
  • Figure 42: Western Europe Market Value Share and BPS Analysis by Country, 2025 and 2035
  • Figure 43: Western Europe Market Value Share and BPS Analysis by Therapy , 2025 and 2035
  • Figure 44: Western Europe Market Y to o to Y Growth Comparison by Therapy , 2025-2035
  • Figure 45: Western Europe Market Attractiveness Analysis by Therapy
  • Figure 46: Western Europe Market Value Share and BPS Analysis by Route Of Administration, 2025 and 2035
  • Figure 47: Western Europe Market Y to o to Y Growth Comparison by Route Of Administration, 2025-2035
  • Figure 48: Western Europe Market Attractiveness Analysis by Route Of Administration
  • Figure 49: Western Europe Market Value Share and BPS Analysis by Distribution Channel, 2025 and 2035
  • Figure 50: Western Europe Market Y to o to Y Growth Comparison by Distribution Channel, 2025-2035
  • Figure 51: Western Europe Market Attractiveness Analysis by Distribution Channel
  • Figure 52: Eastern Europe Market Value Share and BPS Analysis by Country, 2025 and 2035
  • Figure 53: Eastern Europe Market Value Share and BPS Analysis by Therapy , 2025 and 2035
  • Figure 54: Eastern Europe Market Y to o to Y Growth Comparison by Therapy , 2025-2035
  • Figure 55: Eastern Europe Market Attractiveness Analysis by Therapy
  • Figure 56: Eastern Europe Market Value Share and BPS Analysis by Route Of Administration, 2025 and 2035
  • Figure 57: Eastern Europe Market Y to o to Y Growth Comparison by Route Of Administration, 2025-2035
  • Figure 58: Eastern Europe Market Attractiveness Analysis by Route Of Administration
  • Figure 59: Eastern Europe Market Value Share and BPS Analysis by Distribution Channel, 2025 and 2035
  • Figure 60: Eastern Europe Market Y to o to Y Growth Comparison by Distribution Channel, 2025-2035
  • Figure 61: Eastern Europe Market Attractiveness Analysis by Distribution Channel
  • Figure 62: East Asia Market Value Share and BPS Analysis by Country, 2025 and 2035
  • Figure 63: East Asia Market Value Share and BPS Analysis by Therapy , 2025 and 2035
  • Figure 64: East Asia Market Y to o to Y Growth Comparison by Therapy , 2025-2035
  • Figure 65: East Asia Market Attractiveness Analysis by Therapy
  • Figure 66: East Asia Market Value Share and BPS Analysis by Route Of Administration, 2025 and 2035
  • Figure 67: East Asia Market Y to o to Y Growth Comparison by Route Of Administration, 2025-2035
  • Figure 68: East Asia Market Attractiveness Analysis by Route Of Administration
  • Figure 69: East Asia Market Value Share and BPS Analysis by Distribution Channel, 2025 and 2035
  • Figure 70: East Asia Market Y to o to Y Growth Comparison by Distribution Channel, 2025-2035
  • Figure 71: East Asia Market Attractiveness Analysis by Distribution Channel
  • Figure 72: South Asia and Pacific Market Value Share and BPS Analysis by Country, 2025 and 2035
  • Figure 73: South Asia and Pacific Market Value Share and BPS Analysis by Therapy , 2025 and 2035
  • Figure 74: South Asia and Pacific Market Y to o to Y Growth Comparison by Therapy , 2025-2035
  • Figure 75: South Asia and Pacific Market Attractiveness Analysis by Therapy
  • Figure 76: South Asia and Pacific Market Value Share and BPS Analysis by Route Of Administration, 2025 and 2035
  • Figure 77: South Asia and Pacific Market Y to o to Y Growth Comparison by Route Of Administration, 2025-2035
  • Figure 78: South Asia and Pacific Market Attractiveness Analysis by Route Of Administration
  • Figure 79: South Asia and Pacific Market Value Share and BPS Analysis by Distribution Channel, 2025 and 2035
  • Figure 80: South Asia and Pacific Market Y to o to Y Growth Comparison by Distribution Channel, 2025-2035
  • Figure 81: South Asia and Pacific Market Attractiveness Analysis by Distribution Channel
  • Figure 82: Middle East & Africa Market Value Share and BPS Analysis by Country, 2025 and 2035
  • Figure 83: Middle East & Africa Market Value Share and BPS Analysis by Therapy , 2025 and 2035
  • Figure 84: Middle East & Africa Market Y to o to Y Growth Comparison by Therapy , 2025-2035
  • Figure 85: Middle East & Africa Market Attractiveness Analysis by Therapy
  • Figure 86: Middle East & Africa Market Value Share and BPS Analysis by Route Of Administration, 2025 and 2035
  • Figure 87: Middle East & Africa Market Y to o to Y Growth Comparison by Route Of Administration, 2025-2035
  • Figure 88: Middle East & Africa Market Attractiveness Analysis by Route Of Administration
  • Figure 89: Middle East & Africa Market Value Share and BPS Analysis by Distribution Channel, 2025 and 2035
  • Figure 90: Middle East & Africa Market Y to o to Y Growth Comparison by Distribution Channel, 2025-2035
  • Figure 91: Middle East & Africa Market Attractiveness Analysis by Distribution Channel
  • Figure 92: Global Market - Tier Structure Analysis
  • Figure 93: Global Market - Company Share Analysis
Dashboard
Dashboard
Dashboard
Dashboard
Dashboard
Dashboard

Full Research Suite comprises of:

Market outlook & trends analysis

Market outlook & trends analysis

Interviews & case studies

Interviews & case studies

Strategic recommendations

Strategic recommendations

Vendor profiles & capabilities analysis

Vendor profiles & capabilities analysis

5-year forecasts

5-year forecasts

8 regions and 60+ country-level data splits

8 regions and 60+ country-level data splits

Market segment data splits

Market segment data splits

12 months of continuous data updates

12 months of continuous data updates

DELIVERED AS:

PDF EXCEL ONLINE

Full Research Suite


$5000

$7500

$10000

Buy Report Now
Similar Industry Reports

Similar Industry Reports

Drugs Glass Packaging Market

Drugs Glass Packaging Market Analysis - Size, Share, and Forecast Outlook 2025 to 2035

Orphan Drugs Market
Orphan Drugs Market

Orphan Drugs Market Size and Share Forecast Outlook 2025 to 2035

Topical Drugs Packaging Market

Topical Drugs Packaging Market Growth & Forecast 2025 to 2035

Retinal Drugs And Biologics Market

Retinal Drugs And Biologics Market

Antiviral Drugs Market

Antiviral Drugs Market Size and Share Forecast Outlook 2025 to 2035

Cytotoxic Drugs Market

Cytotoxic Drugs Market Analysis – Growth, Trends & Forecast 2025-2035

3D Printed Drugs Market

3D Printed Drugs Market Outlook – Growth, Demand & Forecast 2025-2035

Depression Drugs Market

Depression Drugs Market

Parenteral Drugs Packaging Market

Parenteral Drugs Packaging Market

Brain Tumor Drugs Market

Brain Tumor Drugs Market Forecast & Analysis: 2025 to 2035

Infertility Drugs Market

Infertility Drugs Market Analysis - Size, Share & Forecast 2025 to 2035

Expectorant Drugs Market

Expectorant Drugs Market Trend Analysis Based on Drug, Dosage Form, Product, Distribution Channel, and Region 2025 to 2035

Cannabinoid Drugs Market

Cannabinoid Drugs Market

Clot Busting Drugs Market

Clot Busting Drugs Market Size and Share Forecast Outlook 2025 to 2035

Psychotropic Drugs Market

Psychotropic Drugs Market Growth - Industry Trends & Outlook 2025 to 2035

Critical Care Drugs Market

Critical Care Drugs Market Analysis – Trends, Demand & Forecast 2024-2034

Anti-Malarial drugs Market

Anti-Malarial drugs Market

Antimetabolite Drugs Market

Antimetabolite Drugs Market Size and Share Forecast Outlook 2025 to 2035

Fish-Oil Based Drugs Market

Fish-Oil Based Drugs Market Analysis – Trends, Share & Growth Forecast 2024-2034

Plasma-Derived Drugs Market

Plasma-Derived Drugs Market

Future Market Insights

Obesity-Diabetes Drugs Market

Chat With MaRIA

Chat With

MaRIA

Hi There, I am MaRIA, Your Market Research Intelligence Assistant. How may I help you?