Pediatric Supplement Market Size and Share Outlook Forecast 2025 to 2035

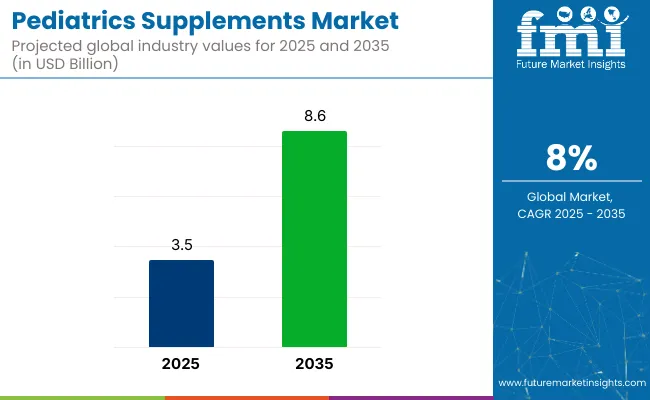
The global pediatric supplement market is valued at USD 3.5 billion in 2025 and is poised to reach USD 8.6 billion by 2035, which shows a CAGR of 8.0%. This growth is expected to be driven by rising concerns over child malnutrition, increasing preference for clean-label products, and technological advancements in supplement formulation. Additionally, manufacturers are anticipated to focus on easy-to-consume products targeting picky eaters, thereby boosting market penetration globally.
Quick Stats for pediatric supplement market

  • Market Value (2025): USD 3.5 billion
  • Forecast Value (2035): USD 8.6 billion
  • Forecast CAGR: 8.0%
  • Demographic Leader in 2025: Children (5-12 Years) (42% Market Share)
  • Top Functionality Channel: Immune Health (35% Market Share)
  • Key Growth Region: North America (USA is the fastest-growing market with 5.1% CAGR)

Pediatrics Supplements Market

Metric Value
Market Value (2025) USD 3.5 billion
Forecast Value (2035) USD 8.6 billion
CAGR (2025 to 2035) 8.0%

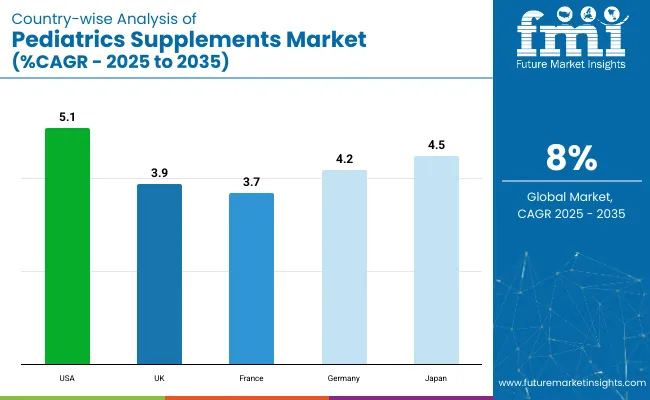
In 2025, the USA is anticipated to hold the highest CAGR at 5.1% during 2025 to 2035, due to the high adoption of nutritional supplements for children. Japan is expected to witness a CAGR of 4.5% during the forecast period, driven by rising malnutrition concerns and government initiatives. By end user demographics type, children (5-12 Years) will lead with a 42% market share, while by functionality, immune health will account for 35% of the market in 2025.

Recent innovations in the market include the development of gummy supplements, which offer a more palatable alternative to traditional formulations. These gummies are designed to appeal to children, making it easier for them to consume essential vitamins and nutrients. The market for gummy supplements is rapidly growing, driven by increased awareness of preventive care and the rising demand for child-friendly supplement options.

On the regulatory front, the USA Food and Drug Administration (FDA) has intensified efforts to ensure the safety and effectiveness of dietary supplements. In 2025, the FDA implemented significant regulatory and organizational changes, including the establishment of the Human Foods Program (HFP), aimed at modernizing the evaluation of food ingredients and dietary supplements. Additionally, the FDA has increased surveillance over new ingredients in dietary supplements, requiring manufacturers to submit evidence of safety before marketing.

The market holds a relatively niche but growing share within its broader parent markets. In the overall dietary supplements market, pediatric supplement account for approximately 8-10%, driven by rising child nutrition awareness. Within the food and beverage market, their share is around 2%, as they form a specialized segment under fortified foods and nutraceuticals.

In the healthcare and nutrition market, they contribute nearly 5%, given their role in preventive care for children. Additionally, within the functional foods market, pediatric supplement hold about 6%, reflecting increasing demand for age-targeted nutrition products with clean label and child-friendly formulations.

Pediatric Supplement Market by Top Investment Segments

The pediatric supplement market is segmented into product forms, ingredient source, end user demographics type, sales channel, functionality, and region. By product forms, the market is categorized into gummies, chewables, powders, syrups, capsules, tablets, and liquid drops. Based on ingredients source, the market is segmented into plant-based (herbal extracts, algae, etc.), animal-based (fish oil, collagen, etc.), synthetic (lab-made vitamins/minerals), and organic/natural.

By end user demographics type, the market is classified into infants (0-2 years), toddlers (2-4 years), children (5-12 years), and adolescents (13-18 years). By sales channel, the market is segmented into pharmacies, supermarkets/hypermarkets, online retail, specialty stores (health & wellness), pediatric clinics, and direct sales (MLM, subscription services).

Based on functionality, the market is categorized into immune health, bone and teeth strengthening, digestive health, cognitive development, eye health, muscle growth, and overall growth and development. Regionally, the market is segmented into North America, Latin America, Europe, South Asia, East Asia, Oceania, and the Middle East & Africa.

Gummies to Lead the Product Forms Segment with Over 28% Market Share in 2025

The gummies segment in the pediatric supplement market is projected to hold the largest share, accounting for approximately 28% in 2025.
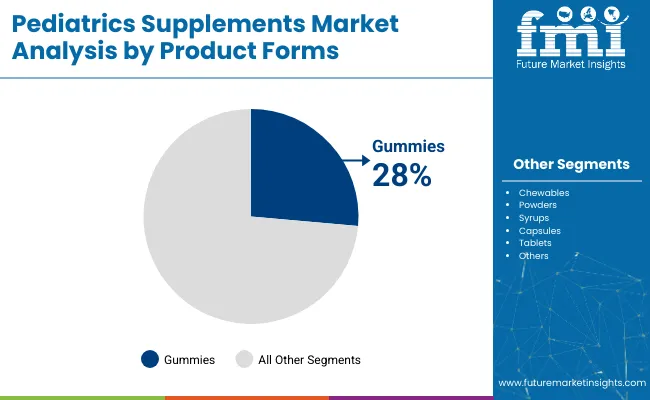
  • This dominance is driven by their palatable taste, attractive colors, and easy-to-chew texture, making them highly preferred by children and convenient for parents to administer.
  • Gummies are increasingly formulated with clean-label, allergen-free ingredients to cater to health-conscious consumers seeking safe options for their children.

Pediatrics Supplements Market Analysis By Product Forms

Plant-Based to Lead the Ingredients Source Segment with Over 34% Market Share in 2025

The plant-based segment under ingredients source is projected to hold the largest market share, estimated at around 34% in 2025.

  • Plant-based pediatric supplement are perceived as more sustainable, allergen-free, and gentle on children’s digestive systems compared to synthetic or animal-based alternatives.
  • This segment’s growth is further supported by increasing vegan trends and regulatory approvals for plant-derived ingredients.

Children (5-12 Years) to Lead the End User Demographics Segment with Over 42% Market Share in 2025

The children segment (5-12 years) is projected to hold the largest market share, estimated at approximately 42% in 2025.
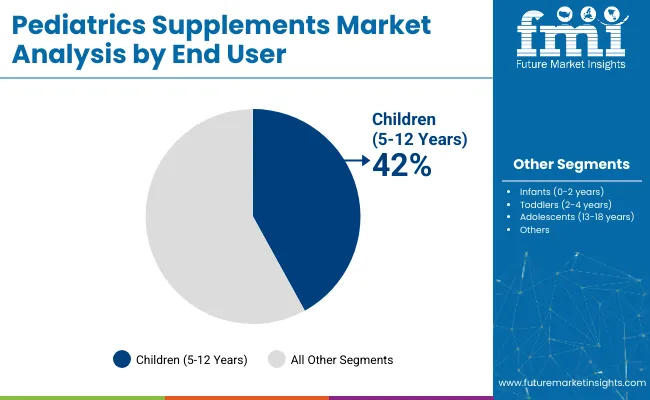
  • This dominance is driven by the high demand for supplements supporting growth, immunity, and cognitive development during primary school years.
  • Additionally, companies are launching child-friendly formulations with appealing flavors and clinically proven benefits targeting this demographic.

Pediatrics Supplements Market Analysis By End User

Online Retail to Lead the Sales Channel Segment with Over 32% Market Share in 2025

The online retail segment is projected to hold the largest market share among sales channels, holding around a 32% share in 2025.
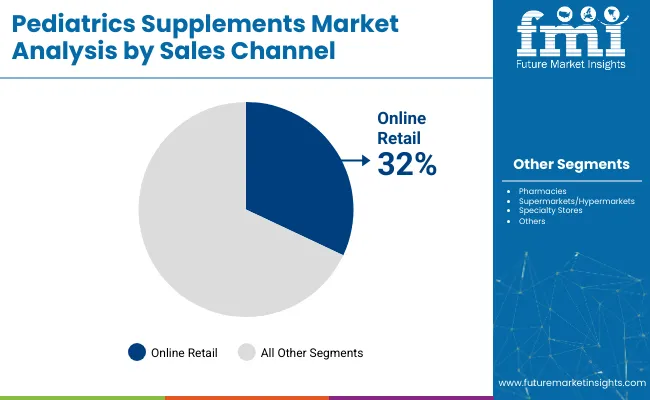
  • This growth is driven by the rising preference for convenience, wider product availability, and competitive pricing offered by online platforms.
  • Additionally, attractive discounts, subscription models, and targeted digital marketing by leading brands have boosted online sales.

Pediatrics Supplements Market Analysis By Sales Channel

Immune Health to Lead the Functionality Segment with Over 35% Market Share in 2025

The immune health segment is projected to hold the largest market share among functionalities, holding around 35% in 2025.
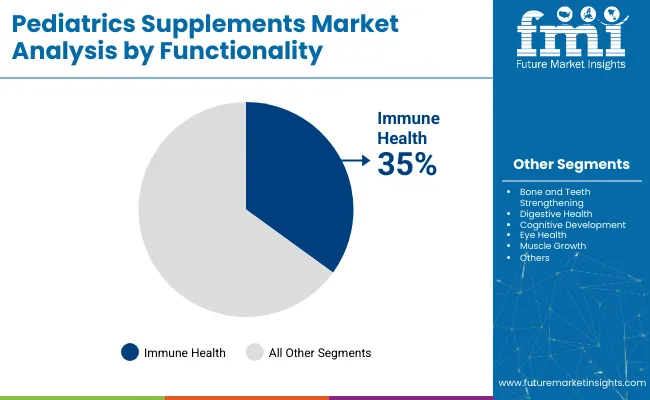
  • This dominance is driven by increasing parental focus on strengthening children's immunity to prevent common infections and illnesses, especially post-pandemic.
  • Supplements formulated with vitamins C, D, zinc, and herbal extracts are highly sought after for their proven benefits in enhancing immune response.

Pediatrics Supplements Market Analysis By Functionality

Top Pediatric Supplement Market Dynamics

The global pediatric supplement market is growing steadily, driven by rising awareness of child nutrition, increasing demand for clean-label and plant-based formulations, and advancements in personalized and age-specific supplement technologies.

Recent Trends in the Pediatric Supplement Market

  • Increasing demand for clean-label and allergen-free pediatric supplements among health-conscious parents.
  • Growing popularity of gummy and chewable supplement formats for easier consumption by children.
  • Rising adoption of plant-based and vegan ingredients in pediatric supplement formulations.
  • Integration of precision nutrition and personalized supplement solutions targeting specific child health needs.

Challenges in the Pediatric Supplement Market
  • Stringent regulatory requirements for safety and clinical validation of pediatric supplements.
  • High price sensitivity among consumers in developing markets limits premium product adoption.
  • Difficulty in ensuring palatability and taste masking for supplements with strong active ingredient flavors.
  • Rising concerns over potential side effects and overconsumption risks in young children.

Analyzing Top Countries Producing and Consuming Pediatric Supplements

Pediatrics Supplements Market Country Wise Analysis

The pediatric supplement market shows varied growth rates across key countries. The USA leads with a CAGR of 5.1%, driven by strong parental awareness and established brands. Japan follows at 4.5% CAGR, supported by functional and herbal supplement demand. Germany records a 4.2% CAGR, backed by clinical trust and organic formulations. The UK market is poised to grow at 3.9% CAGR, driven by vegan and plant-based product adoption. France shows the lowest among these, with a 3.7% CAGR, as demand rises for immunity and bone health supplements.

This report covers in depth-analysis of 40+ countries; five top-performing OECD Countries are highlighted below.

USA Pediatric Supplement Market Analysis

The USA pediatric supplement market is projected to grow at a CAGR of 5.1% from 2025 to 2035.

  • Rising demand for clean-label and allergen-free supplements.
  • High penetration of online and subscription-based supplement sales.
  • Strong presence of global players like Pfizer and Abbott.
  • The government focuses on child health programs and nutrition standards.
  • Rapid product innovations targeting picky eaters with gummies and chewables.

Pediatric Supplement Demand Analysis in the UK

The UK pediatric supplement revenue is expected to expand at a CAGR of 3.9% during the forecast period.

  • Increased adoption of plant-based and vegan supplements for children.
  • Strong retail distribution through pharmacies and supermarkets.
  • Leading brands like Bayer AG are expanding pediatric product portfolios.
  • Government campaigns promoting childhood nutrition awareness.
  • Growing e-commerce penetration with targeted pediatric supplement brands.

Pediatric Supplement Demand Analysis in Germany

Germany’s pediatric supplements revenue is forecasted to grow at a CAGR of 4.2% between 2025 and 2035.

  • High consumer trust in clinically tested and certified supplements.
  • Robust distribution network including pharmacies and health stores.
  • Strong presence of European brands with organic formulations.
  • Preference for clean-label, natural, and allergen-free products.
  • Regulatory focus on quality standards and safety certifications.

France Pediatric Supplement Market Analysis

Sales of pediatric supplement in France are projected to register a CAGR of 3.7% from 2025 to 2035.

  • Rising popularity of immunity and bone health supplements.
  • Growing preference for organic and plant-based pediatric products.
  • Expansion of online and pharmacy-based distribution channels.
  • Government regulations ensure strict labelling and formulation standards.

Japan Pediatric Supplement Market Analysis

Japan’s pediatric supplement market is anticipated to grow at a CAGR of 4.5% during the forecast period.

  • High demand for functional supplements targeting child growth and immunity.
  • Technological advancements in formulation and taste masking.
  • Preference for traditional herbal ingredients in pediatric formulations.
  • Leading local companies investing in R&D for child-focused supplements.

Leading Pediatric Supplement Manufacturers and Suppliers

The market is moderately consolidated, with key players like Pfizer, Nestlé SA, Reckitt Benckiser Group Plc, and Abbott holding significant market shares. These companies are actively investing in product innovation, strategic partnerships, and global expansion to strengthen their positions.

Pfizer continues to focus on research and development, introducing new formulations to address specific pediatric health needs. Nestlé SA is expanding its pediatric nutrition portfolio, emphasizing clean-label and plant-based products to meet evolving consumer preferences. Reckitt Benckiser Group Plc is streamlining its operations to concentrate on high-growth areas, while Abbott is enhancing its product offerings through technological advancements and strategic acquisitions.

Recent Pediatric Supplements Industry News

  • In April 2025, Pfizer advanced three new R&D programs, reflecting its commitment to innovation in various therapeutic areas.
  • In August 2024, Nestlé Health Science signed an agreement to acquire global rights to VOWST®, enhancing its portfolio in microbiome therapeutics.

Pediatric Supplement Market Report Scope

Report Attributes Details
Current Total Market Size (2025) USD 3.5 billion
Projected Market Size (2035) USD 8.6 billion
CAGR (2025 to 2035) 8.0%
Base Year for Estimation 2024
Historical Period 2020 to 2024
Projections Period 2025 to 2035
Market Analysis Parameters Revenue in USD billion/Volume in Units
By Product Forms Gummies, Chewables, Powders, Syrups, Capsules, Tablets, Liquid Drops
By Ingredients Source Plant-Based, Animal-Based, Synthetic, Organic/Natural
By End User Demographics Type Infants (0-2 years), Toddlers (2-4 years), Children (5-12 years), Adolescents (13-18 years)
By Sales Channel Pharmacies, Supermarkets/Hypermarkets, Online Retail, Specialty Stores, Pediatric Clinics, Direct Sales
By Functionality Immune Health, Bone and Teeth Strengthening, Digestive Health, Cognitive Development, Eye Health, Muscle Growth, Overall Growth and Development
Regions Covered North America, Latin America, Western Europe, Eastern Europe, East Asia, South Asia & Pacific, Middle East & Africa
Countries Covered United States, Canada, United Kingdom, Germany, France, China, Japan, South Korea, Brazil, Australia
Key Players Talbots Inc., Pfizer, Reckitt Benckiser Group Plc, Nestle SA, NuBest Nutritionals, Abbott, Olly Nutrition (acquired by Unilever), Goodbaby International Holdings Limited, TruHeight, Ajinomoto Health & Nutrition, Nutritional Growth Solutions, ChildLife Essentials, Else Nutrition Holdings Inc., Bayer, Brightchamps Tech Private Limited, Piramal Enterprises Ltd, MRO Maryruth LLC, Phytoral, Lifetrients, Omniactive, Valeant Pharmaceuticals International, Captek Softgel International Inc., Nuvamin LLC, Core Nutritionals, Nature's Craft.
Additional Attributes Dollar sales by value, market share analysis by region, and country-wise analysis.

Top Segments Studied in the Pediatric Supplement Market Report

By Product Forms:

As per product type, the industry has been categorized into Gummies, Chewables, Powders, Syrups, Capsules, Tablets, and Liquid Drops.

By Ingredients Source:

As per ingredient type, the industry has been categorized into Plant-Based (Herbal extracts, Algae, etc.), Animal-Based (Fish oil, Collagen, etc.), Synthetic (Lab-made vitamins/minerals), and Organic/Natural.

By End Users:

This segment is further categorized into Infants (0-2 years), Toddlers (2-4 years), Children (5-12 years), and Adolescents (13-18 years).

By Sales Channel:

As per the sales channel, the industry has been categorized into Pharmacies, Supermarkets/Hypermarkets, Online Retail, Specialty Stores (Health & Wellness), Pediatric Clinics, and Direct Sales (MLM, Subscription services).

By Functionality:

This segment is further categorized into Immune Health, Bone and Teeth Strengthening, Digestive Health, Cognitive Development, Eye Health, Muscle Growth, and Overall Growth & Development.

By Region:

Industry analysis has been carried out in key countries of North America, Latin America, Europe, East Asia, South Asia, Oceania, and the Middle East & Africa.

Table of Content

  1. Executive Summary
    • Global Market Outlook
    • Demand-side Trends
    • Supply-side Trends
    • Technology Roadmap Analysis
    • Analysis and Recommendations
  2. Market Overview
    • Market Coverage / Taxonomy
    • Market Definition / Scope / Limitations
  3. Market Background
    • Market Dynamics
      • Drivers
      • Restraints
      • Opportunity
      • Trends
    • Scenario Forecast
      • Demand in Optimistic Scenario
      • Demand in Likely Scenario
      • Demand in Conservative Scenario
    • Opportunity Map Analysis
    • Product Life Cycle Analysis
    • Supply Chain Analysis
      • Supply Side Participants and their Roles
        • Producers
        • Mid-Level Participants (Traders/ Agents/ Brokers)
        • Wholesalers and Distributors
      • Value Added and Value Created at Node in the Supply Chain
      • List of Raw Material Suppliers
      • List of Existing and Potential Buyer’s
    • Investment Feasibility Matrix
    • Value Chain Analysis
      • Profit Margin Analysis
      • Wholesalers and Distributors
      • Retailers
    • PESTLE and Porter’s Analysis
    • Regulatory Landscape
      • By Key Regions
      • By Key Countries
    • Regional Parent Market Outlook
    • Production and Consumption Statistics
    • Import and Export Statistics
  4. Global Market Analysis 2020 to 2024 and Forecast, 2025 to 2035
    • Historical Market Size Value (USD Billion) & Volume (Units) Analysis, 2020 to 2024
    • Current and Future Market Size Value (USD Billion) & Volume (Units) Projections, 2025 to 2035
      • Y-o-Y Growth Trend Analysis
      • Absolute $ Opportunity Analysis
  5. Global Market Pricing Analysis 2020 to 2024 and Forecast 2025 to 2035
  6. Global Market Analysis 2020 to 2024 and Forecast 2025 to 2035, By Product Forms
    • Introduction / Key Findings
    • Historical Market Size Value (USD Billion) & Volume (Units) Analysis By Product Forms, 2020 to 2024
    • Current and Future Market Size Value (USD Billion) & Volume (Units) Analysis and Forecast By Product Forms, 2025 to 2035
      • Gummies
      • Chewables
      • Powders
      • Syrups
      • Capsules
      • Tablets
      • Liquid Drops
    • Y-o-Y Growth Trend Analysis By Product Forms, 2020 to 2024
    • Absolute $ Opportunity Analysis By Product Forms, 2025 to 2035
  7. Global Market Analysis 2020 to 2024 and Forecast 2025 to 2035, By Ingredients Source
    • Introduction / Key Findings
    • Historical Market Size Value (USD Billion) & Volume (Units) Analysis By Ingredients Source, 2020 to 2024
    • Current and Future Market Size Value (USD Billion) & Volume (Units) Analysis and Forecast By Ingredients Source, 2025 to 2035
      • Plant-Based (Herbal extracts, Algae, etc.)
      • Animal-Based (Fish oil, Collagen, etc.)
      • Synthetic (Lab-made vitamins/minerals)
      • Organic/Natural
    • Y-o-Y Growth Trend Analysis By Ingredients Source, 2020 to 2024
    • Absolute $ Opportunity Analysis By Ingredients Source, 2025 to 2035
  8. Global Market Analysis 2020 to 2024 and Forecast 2025 to 2035, By End User Demographics Type
    • Introduction / Key Findings
    • Historical Market Size Value (USD Billion) & Volume (Units) Analysis By End User Demographics Type, 2020 to 2024
    • Current and Future Market Size Value (USD Billion) & Volume (Units) Analysis and Forecast By End User Demographics Type, 2025 to 2035
      • Infants (0-2 years)
      • Toddlers (2-4 years)
      • Children (5-12 years)
      • Adolescents (13-18 years)
    • Y-o-Y Growth Trend Analysis By End User Demographics Type, 2020 to 2024
    • Absolute $ Opportunity Analysis By End User Demographics Type, 2025 to 2035
  9. Global Market Analysis 2020 to 2024 and Forecast 2025 to 2035, By Sales Channel
    • Introduction / Key Findings
    • Historical Market Size Value (USD Billion) & Volume (Units) Analysis By Sales Channel, 2020 to 2024
    • Current and Future Market Size Value (USD Billion) & Volume (Units) Analysis and Forecast By Sales Channel, 2025 to 2035
      • Pharmacies
      • Supermarkets/Hypermarkets
      • Online Retail
      • Specialty Stores (Health & Wellness)
      • Pediatric Clinics
      • Direct Sales (MLM, Subscription services)
    • Y-o-Y Growth Trend Analysis By Sales Channel, 2020 to 2024
    • Absolute $ Opportunity Analysis By Sales Channel, 2025 to 2035
  10. Global Market Analysis 2020 to 2024 and Forecast 2025 to 2035, By Functionality
    • Introduction / Key Findings
    • Historical Market Size Value (USD Billion) & Volume (Units) Analysis By Functionality, 2020 to 2024
    • Current and Future Market Size Value (USD Billion) & Volume (Units) Analysis and Forecast By Functionality, 2025 to 2035
      • Immune Health
      • Bone and Teeth Strengthening
      • Digestive Health
      • Cognitive Development
      • Eye Health
      • Muscle Growth
      • Overall Growth and Development
    • Y-o-Y Growth Trend Analysis By Functionality, 2020 to 2024
    • Absolute $ Opportunity Analysis By Functionality, 2025 to 2035
  11. Global Market Analysis 2020 to 2024 and Forecast 2025 to 2035, By Region
    • Introduction
    • Historical Market Size Value (USD Billion) & Volume (Units) Analysis By Region, 2020 to 2024
    • Current Market Size Value (USD Billion) & Volume (Units) Analysis and Forecast By Region, 2025 to 2035
      • USA
      • Latin America
      • Western Europe
      • Eastern Europe
      • East Asia
      • South Asia & Pacific
      • Middle East and Africa
    • Market Attractiveness Analysis By Region
  12. USA Market Analysis 2020 to 2024 and Forecast 2025 to 2035, By Country
    • Historical Market Size Value (USD Billion) & Volume (Units) Trend Analysis By Market Taxonomy, 2020 to 2024
    • Market Size Value (USD Billion) & Volume (Units) Forecast By Market Taxonomy, 2025 to 2035
      • By Country
        • Canada
        • Brazil
        • Mexico
        • Argentina
      • By Product Forms
      • By Ingredients Source
      • By End User Demographics Type
      • By Sales Channel
      • By Functionality
    • Market Attractiveness Analysis
      • By Country
      • By Product Forms
      • By Ingredients Source
      • By End User Demographics Type
      • By Sales Channel
      • By Functionality
    • Key Takeaways
  13. Latin America Market Analysis 2020 to 2024 and Forecast 2025 to 2035, By Country
    • Historical Market Size Value (USD Billion) & Volume (Units) Trend Analysis By Market Taxonomy, 2020 to 2024
    • Market Size Value (USD Billion) & Volume (Units) Forecast By Market Taxonomy, 2025 to 2035
      • By Country
        • Brazil
        • Argentina
        • Rest of LATAM
      • By Product Forms
      • By Ingredients Source
      • By End User Demographics Type
      • By Sales Channel
      • By Functionality
    • Market Attractiveness Analysis
      • By Country
      • By Product Forms
      • By Ingredients Source
      • By End User Demographics Type
      • By Sales Channel
      • By Functionality
    • Key Takeaways
  14. Western Europe Market Analysis 2020 to 2024 and Forecast 2025 to 2035, By Country
    • Historical Market Size Value (USD Billion) & Volume (Units) Trend Analysis By Market Taxonomy, 2020 to 2024
    • Market Size Value (USD Billion) & Volume (Units) Forecast By Market Taxonomy, 2025 to 2035
      • By Country
        • Germany
        • Italy
        • France
        • UK
        • Spain
        • BENELUX
        • Nordic
        • Rest of W.Europe
      • By Product Forms
      • By Ingredients Source
      • By End User Demographics Type
      • By Sales Channel
      • By Functionality
    • Market Attractiveness Analysis
      • By Country
      • By Product Forms
      • By Ingredients Source
      • By End User Demographics Type
      • By Sales Channel
      • By Functionality
    • Key Takeaways
  15. Eastern Europe Market Analysis 2020 to 2024 and Forecast 2025 to 2035, By Country
    • Historical Market Size Value (USD Billion) & Volume (Units) Trend Analysis By Market Taxonomy, 2020 to 2024
    • Market Size Value (USD Billion) & Volume (Units) Forecast By Market Taxonomy, 2025 to 2035
      • By Country
        • Russia
        • Hungary
        • Poland
        • Balkan & Baltics
        • Rest of E. Europe
      • By Product Forms
      • By Ingredients Source
      • By End User Demographics Type
      • By Sales Channel
      • By Functionality
    • Market Attractiveness Analysis
      • By Country
      • By Product Forms
      • By Ingredients Source
      • By End User Demographics Type
      • By Sales Channel
      • By Functionality
    • Key Takeaways
  16. East Asia Market Analysis 2020 to 2024 and Forecast 2025 to 2035, By Country
    • Historical Market Size Value (USD Billion) & Volume (Units) Trend Analysis By Market Taxonomy, 2020 to 2024
    • Market Size Value (USD Billion) & Volume (Units) Forecast By Market Taxonomy, 2025 to 2035
      • By Country
        • China
        • Japan
        • South Korea
      • By Product Forms
      • By Ingredients Source
      • By End User Demographics Type
      • By Sales Channel
      • By Functionality
    • Market Attractiveness Analysis
      • By Country
      • By Product Forms
      • By Ingredients Source
      • By End User Demographics Type
      • By Sales Channel
      • By Functionality
    • Key Takeaways
  17. South Asia & Pacific Market Analysis 2020 to 2024 and Forecast 2025 to 2035, By Country
    • Historical Market Size Value (USD Billion) & Volume (Units) Trend Analysis By Market Taxonomy, 2020 to 2024
    • Market Size Value (USD Billion) & Volume (Units) Forecast By Market Taxonomy, 2025 to 2035
      • By Country
        • India
        • Australia & New Zealand
        • ASEAN
        • Rest of SAP
      • By Product Forms
      • By Ingredients Source
      • By End User Demographics Type
      • By Sales Channel
      • By Functionality
    • Market Attractiveness Analysis
      • By Country
      • By Product Forms
      • By Ingredients Source
      • By End User Demographics Type
      • By Sales Channel
      • By Functionality
    • Key Takeaways
  18. Middle East and Africa Market Analysis 2020 to 2024 and Forecast 2025 to 2035, By Country
    • Historical Market Size Value (USD Billion) & Volume (Units) Trend Analysis By Market Taxonomy, 2020 to 2024
    • Market Size Value (USD Billion) & Volume (Units) Forecast By Market Taxonomy, 2025 to 2035
      • By Country
        • GCC Countries
        • Northern Africa
        • South Africa
        • Turkiye
        • Rest of MEA
      • By Product Forms
      • By Ingredients Source
      • By End User Demographics Type
      • By Sales Channel
      • By Functionality
    • Market Attractiveness Analysis
      • By Country
      • By Product Forms
      • By Ingredients Source
      • By End User Demographics Type
      • By Sales Channel
      • By Functionality
    • Key Takeaways
  19. Key Countries Market Analysis
    • USA
      • Pricing Analysis
      • Market Share Analysis, 2024
        • By Product Forms
        • By Ingredients Source
        • By End User Demographics Type
        • By Sales Channel
        • By Functionality
    • Canada
      • Pricing Analysis
      • Market Share Analysis, 2024
        • By Product Forms
        • By Ingredients Source
        • By End User Demographics Type
        • By Sales Channel
        • By Functionality
    • Brazil
      • Pricing Analysis
      • Market Share Analysis, 2024
        • By Product Forms
        • By Ingredients Source
        • By End User Demographics Type
        • By Sales Channel
        • By Functionality
    • Mexico
      • Pricing Analysis
      • Market Share Analysis, 2024
        • By Product Forms
        • By Ingredients Source
        • By End User Demographics Type
        • By Sales Channel
        • By Functionality
    • Argentina
      • Pricing Analysis
      • Market Share Analysis, 2024
        • By Product Forms
        • By Ingredients Source
        • By End User Demographics Type
        • By Sales Channel
        • By Functionality
  20. Market Structure Analysis
    • Competition Dashboard
    • Competition Benchmarking
    • Market Share Analysis of Top Players
      • By Regional
      • By Product Forms
      • By Ingredients Source
      • By End User Demographics Type
      • By Sales Channel
      • By Functionality
  21. Competition Analysis
    • Competition Deep Dive
      • Talbots Inc.
        • Overview
        • Product Portfolio
        • Profitability by Market Segments (Product/Age /Sales Channel/Region)
        • Sales Footprint
        • Strategy Overview
          • Marketing Strategy
          • Product Strategy
          • Channel Strategy
      • Pfizer
        • Overview
        • Product Portfolio
        • Profitability by Market Segments (Product/Age /Sales Channel/Region)
        • Sales Footprint
        • Strategy Overview
          • Marketing Strategy
          • Product Strategy
          • Channel Strategy
      • Reckitt Benckiser Group Plc
        • Overview
        • Product Portfolio
        • Profitability by Market Segments (Product/Age /Sales Channel/Region)
        • Sales Footprint
        • Strategy Overview
          • Marketing Strategy
          • Product Strategy
          • Channel Strategy
      • Nestle SA
        • Overview
        • Product Portfolio
        • Profitability by Market Segments (Product/Age /Sales Channel/Region)
        • Sales Footprint
        • Strategy Overview
          • Marketing Strategy
          • Product Strategy
          • Channel Strategy
      • NuBest Nutritionals
        • Overview
        • Product Portfolio
        • Profitability by Market Segments (Product/Age /Sales Channel/Region)
        • Sales Footprint
        • Strategy Overview
          • Marketing Strategy
          • Product Strategy
          • Channel Strategy
      • Abbott
        • Overview
        • Product Portfolio
        • Profitability by Market Segments (Product/Age /Sales Channel/Region)
        • Sales Footprint
        • Strategy Overview
          • Marketing Strategy
          • Product Strategy
          • Channel Strategy
      • Olly Nutrition (acquired by Unilever)
        • Overview
        • Product Portfolio
        • Profitability by Market Segments (Product/Age /Sales Channel/Region)
        • Sales Footprint
        • Strategy Overview
          • Marketing Strategy
          • Product Strategy
          • Channel Strategy
      • Goodbaby International Holdings Limited
        • Overview
        • Product Portfolio
        • Profitability by Market Segments (Product/Age /Sales Channel/Region)
        • Sales Footprint
        • Strategy Overview
          • Marketing Strategy
          • Product Strategy
          • Channel Strategy
      • TruHeight
        • Overview
        • Product Portfolio
        • Profitability by Market Segments (Product/Age /Sales Channel/Region)
        • Sales Footprint
        • Strategy Overview
          • Marketing Strategy
          • Product Strategy
          • Channel Strategy
      • Ajinomoto Health & Nutrition
        • Overview
        • Product Portfolio
        • Profitability by Market Segments (Product/Age /Sales Channel/Region)
        • Sales Footprint
        • Strategy Overview
          • Marketing Strategy
          • Product Strategy
          • Channel Strategy
      • Nutritional Growth Solutions
        • Overview
        • Product Portfolio
        • Profitability by Market Segments (Product/Age /Sales Channel/Region)
        • Sales Footprint
        • Strategy Overview
          • Marketing Strategy
          • Product Strategy
          • Channel Strategy
      • ChildLife Essentials
        • Overview
        • Product Portfolio
        • Profitability by Market Segments (Product/Age /Sales Channel/Region)
        • Sales Footprint
        • Strategy Overview
          • Marketing Strategy
          • Product Strategy
          • Channel Strategy
      • Else Nutrition Holdings Inc
        • Overview
        • Product Portfolio
        • Profitability by Market Segments (Product/Age /Sales Channel/Region)
        • Sales Footprint
        • Strategy Overview
          • Marketing Strategy
          • Product Strategy
          • Channel Strategy
      • Bayer
        • Overview
        • Product Portfolio
        • Profitability by Market Segments (Product/Age /Sales Channel/Region)
        • Sales Footprint
        • Strategy Overview
          • Marketing Strategy
          • Product Strategy
          • Channel Strategy
      • Brightchamps Tech Private Limited
        • Overview
        • Product Portfolio
        • Profitability by Market Segments (Product/Age /Sales Channel/Region)
        • Sales Footprint
        • Strategy Overview
          • Marketing Strategy
          • Product Strategy
          • Channel Strategy
      • Piramal Enterprises Ltd
        • Overview
        • Product Portfolio
        • Profitability by Market Segments (Product/Age /Sales Channel/Region)
        • Sales Footprint
        • Strategy Overview
          • Marketing Strategy
          • Product Strategy
          • Channel Strategy
      • MRO Maryruth, LLC
        • Overview
        • Product Portfolio
        • Profitability by Market Segments (Product/Age /Sales Channel/Region)
        • Sales Footprint
        • Strategy Overview
          • Marketing Strategy
          • Product Strategy
          • Channel Strategy
      • Phytoral
        • Overview
        • Product Portfolio
        • Profitability by Market Segments (Product/Age /Sales Channel/Region)
        • Sales Footprint
        • Strategy Overview
          • Marketing Strategy
          • Product Strategy
          • Channel Strategy
      • Lifetrients
        • Overview
        • Product Portfolio
        • Profitability by Market Segments (Product/Age /Sales Channel/Region)
        • Sales Footprint
        • Strategy Overview
          • Marketing Strategy
          • Product Strategy
          • Channel Strategy
      • Omniactive
        • Overview
        • Product Portfolio
        • Profitability by Market Segments (Product/Age /Sales Channel/Region)
        • Sales Footprint
        • Strategy Overview
          • Marketing Strategy
          • Product Strategy
          • Channel Strategy
  22. Assumptions & Acronyms Used
  23. Research Methodology

List of Tables

  • Table 1: Global Market Value (USD Billion) Forecast by Region, 2020-2035
  • Table 2: Global Market Volume (Units) Forecast by Region, 2020-2035
  • Table 3: Global Market Value (USD Billion) Forecast by Product Forms, 2020-2035
  • Table 4: Global Market Volume (Units) Forecast by Product Forms, 2020-2035
  • Table 5: Global Market Value (USD Billion) Forecast by Ingredients Source, 2020-2035
  • Table 6: Global Market Volume (Units) Forecast by Ingredients Source, 2020-2035
  • Table 7: Global Market Value (USD Billion) Forecast by End User Demographics Type, 2020-2035
  • Table 8: Global Market Volume (Units) Forecast by End User Demographics Type, 2020-2035
  • Table 9: Global Market Value (USD Billion) Forecast by Sales Channel, 2020-2035
  • Table 10: Global Market Volume (Units) Forecast by Sales Channel, 2020-2035
  • Table 11: Global Market Value (USD Billion) Forecast by Functionality, 2020-2035
  • Table 12: Global Market Volume (Units) Forecast by Functionality, 2020-2035
  • Table 13: USA Market Value (USD Billion) Forecast by Country, 2020-2035
  • Table 14: USA Market Volume (Units) Forecast by Country, 2020-2035
  • Table 15: USA Market Value (USD Billion) Forecast by Product Forms, 2020-2035
  • Table 16: USA Market Volume (Units) Forecast by Product Forms, 2020-2035
  • Table 17: USA Market Value (USD Billion) Forecast by Ingredients Source, 2020-2035
  • Table 18: USA Market Volume (Units) Forecast by Ingredients Source, 2020-2035
  • Table 19: USA Market Value (USD Billion) Forecast by End User Demographics Type, 2020-2035
  • Table 20: USA Market Volume (Units) Forecast by End User Demographics Type, 2020-2035
  • Table 21: USA Market Value (USD Billion) Forecast by Sales Channel, 2020-2035
  • Table 22: USA Market Volume (Units) Forecast by Sales Channel, 2020-2035
  • Table 23: USA Market Value (USD Billion) Forecast by Functionality, 2020-2035
  • Table 24: USA Market Volume (Units) Forecast by Functionality, 2020-2035
  • Table 25: Latin America Market Value (USD Billion) Forecast by Country, 2020-2035
  • Table 26: Latin America Market Volume (Units) Forecast by Country, 2020-2035
  • Table 27: Latin America Market Value (USD Billion) Forecast by Product Forms, 2020-2035
  • Table 28: Latin America Market Volume (Units) Forecast by Product Forms, 2020-2035
  • Table 29: Latin America Market Value (USD Billion) Forecast by Ingredients Source, 2020-2035
  • Table 30: Latin America Market Volume (Units) Forecast by Ingredients Source, 2020-2035
  • Table 31: Latin America Market Value (USD Billion) Forecast by End User Demographics Type, 2020-2035
  • Table 32: Latin America Market Volume (Units) Forecast by End User Demographics Type, 2020-2035
  • Table 33: Latin America Market Value (USD Billion) Forecast by Sales Channel, 2020-2035
  • Table 34: Latin America Market Volume (Units) Forecast by Sales Channel, 2020-2035
  • Table 35: Latin America Market Value (USD Billion) Forecast by Functionality, 2020-2035
  • Table 36: Latin America Market Volume (Units) Forecast by Functionality, 2020-2035
  • Table 37: Western Europe Market Value (USD Billion) Forecast by Country, 2020-2035
  • Table 38: Western Europe Market Volume (Units) Forecast by Country, 2020-2035
  • Table 39: Western Europe Market Value (USD Billion) Forecast by Product Forms, 2020-2035
  • Table 40: Western Europe Market Volume (Units) Forecast by Product Forms, 2020-2035
  • Table 41: Western Europe Market Value (USD Billion) Forecast by Ingredients Source, 2020-2035
  • Table 42: Western Europe Market Volume (Units) Forecast by Ingredients Source, 2020-2035
  • Table 43: Western Europe Market Value (USD Billion) Forecast by End User Demographics Type, 2020-2035
  • Table 44: Western Europe Market Volume (Units) Forecast by End User Demographics Type, 2020-2035
  • Table 45: Western Europe Market Value (USD Billion) Forecast by Sales Channel, 2020-2035
  • Table 46: Western Europe Market Volume (Units) Forecast by Sales Channel, 2020-2035
  • Table 47: Western Europe Market Value (USD Billion) Forecast by Functionality, 2020-2035
  • Table 48: Western Europe Market Volume (Units) Forecast by Functionality, 2020-2035
  • Table 49: Eastern Europe Market Value (USD Billion) Forecast by Country, 2020-2035
  • Table 50: Eastern Europe Market Volume (Units) Forecast by Country, 2020-2035
  • Table 51: Eastern Europe Market Value (USD Billion) Forecast by Product Forms, 2020-2035
  • Table 52: Eastern Europe Market Volume (Units) Forecast by Product Forms, 2020-2035
  • Table 53: Eastern Europe Market Value (USD Billion) Forecast by Ingredients Source, 2020-2035
  • Table 54: Eastern Europe Market Volume (Units) Forecast by Ingredients Source, 2020-2035
  • Table 55: Eastern Europe Market Value (USD Billion) Forecast by End User Demographics Type, 2020-2035
  • Table 56: Eastern Europe Market Volume (Units) Forecast by End User Demographics Type, 2020-2035
  • Table 57: Eastern Europe Market Value (USD Billion) Forecast by Sales Channel, 2020-2035
  • Table 58: Eastern Europe Market Volume (Units) Forecast by Sales Channel, 2020-2035
  • Table 59: Eastern Europe Market Value (USD Billion) Forecast by Functionality, 2020-2035
  • Table 60: Eastern Europe Market Volume (Units) Forecast by Functionality, 2020-2035
  • Table 61: East Asia Market Value (USD Billion) Forecast by Country, 2020-2035
  • Table 62: East Asia Market Volume (Units) Forecast by Country, 2020-2035
  • Table 63: East Asia Market Value (USD Billion) Forecast by Product Forms, 2020-2035
  • Table 64: East Asia Market Volume (Units) Forecast by Product Forms, 2020-2035
  • Table 65: East Asia Market Value (USD Billion) Forecast by Ingredients Source, 2020-2035
  • Table 66: East Asia Market Volume (Units) Forecast by Ingredients Source, 2020-2035
  • Table 67: East Asia Market Value (USD Billion) Forecast by End User Demographics Type, 2020-2035
  • Table 68: East Asia Market Volume (Units) Forecast by End User Demographics Type, 2020-2035
  • Table 69: East Asia Market Value (USD Billion) Forecast by Sales Channel, 2020-2035
  • Table 70: East Asia Market Volume (Units) Forecast by Sales Channel, 2020-2035
  • Table 71: East Asia Market Value (USD Billion) Forecast by Functionality, 2020-2035
  • Table 72: East Asia Market Volume (Units) Forecast by Functionality, 2020-2035
  • Table 73: South Asia & Pacific Market Value (USD Billion) Forecast by Country, 2020-2035
  • Table 74: South Asia & Pacific Market Volume (Units) Forecast by Country, 2020-2035
  • Table 75: South Asia & Pacific Market Value (USD Billion) Forecast by Product Forms, 2020-2035
  • Table 76: South Asia & Pacific Market Volume (Units) Forecast by Product Forms, 2020-2035
  • Table 77: South Asia & Pacific Market Value (USD Billion) Forecast by Ingredients Source, 2020-2035
  • Table 78: South Asia & Pacific Market Volume (Units) Forecast by Ingredients Source, 2020-2035
  • Table 79: South Asia & Pacific Market Value (USD Billion) Forecast by End User Demographics Type, 2020-2035
  • Table 80: South Asia & Pacific Market Volume (Units) Forecast by End User Demographics Type, 2020-2035
  • Table 81: South Asia & Pacific Market Value (USD Billion) Forecast by Sales Channel, 2020-2035
  • Table 82: South Asia & Pacific Market Volume (Units) Forecast by Sales Channel, 2020-2035
  • Table 83: South Asia & Pacific Market Value (USD Billion) Forecast by Functionality, 2020-2035
  • Table 84: South Asia & Pacific Market Volume (Units) Forecast by Functionality, 2020-2035
  • Table 85: Middle East and Africa Market Value (USD Billion) Forecast by Country, 2020-2035
  • Table 86: Middle East and Africa Market Volume (Units) Forecast by Country, 2020-2035
  • Table 87: Middle East and Africa Market Value (USD Billion) Forecast by Product Forms, 2020-2035
  • Table 88: Middle East and Africa Market Volume (Units) Forecast by Product Forms, 2020-2035
  • Table 89: Middle East and Africa Market Value (USD Billion) Forecast by Ingredients Source, 2020-2035
  • Table 90: Middle East and Africa Market Volume (Units) Forecast by Ingredients Source, 2020-2035
  • Table 91: Middle East and Africa Market Value (USD Billion) Forecast by End User Demographics Type, 2020-2035
  • Table 92: Middle East and Africa Market Volume (Units) Forecast by End User Demographics Type, 2020-2035
  • Table 93: Middle East and Africa Market Value (USD Billion) Forecast by Sales Channel, 2020-2035
  • Table 94: Middle East and Africa Market Volume (Units) Forecast by Sales Channel, 2020-2035
  • Table 95: Middle East and Africa Market Value (USD Billion) Forecast by Functionality, 2020-2035
  • Table 96: Middle East and Africa Market Volume (Units) Forecast by Functionality, 2020-2035

List of Figures

  • Figure 1: Global Market Volume (Units) Forecast 2020-2035
  • Figure 2: Global Market Pricing Analysis
  • Figure 3: Global Market Value (USD Billion) Forecast 2020-2035
  • Figure 4: Global Market Value Share and BPS Analysis by Product Forms, 2025 and 2035
  • Figure 5: Global Market Y-o-Y Growth Comparison by Product Forms, 2025-2035
  • Figure 6: Global Market Attractiveness Analysis by Product Forms
  • Figure 7: Global Market Value Share and BPS Analysis by Ingredients Source, 2025 and 2035
  • Figure 8: Global Market Y-o-Y Growth Comparison by Ingredients Source, 2025-2035
  • Figure 9: Global Market Attractiveness Analysis by Ingredients Source
  • Figure 10: Global Market Value Share and BPS Analysis by End User Demographics Type, 2025 and 2035
  • Figure 11: Global Market Y-o-Y Growth Comparison by End User Demographics Type, 2025-2035
  • Figure 12: Global Market Attractiveness Analysis by End User Demographics Type
  • Figure 13: Global Market Value Share and BPS Analysis by Sales Channel, 2025 and 2035
  • Figure 14: Global Market Y-o-Y Growth Comparison by Sales Channel, 2025-2035
  • Figure 15: Global Market Attractiveness Analysis by Sales Channel
  • Figure 16: Global Market Value Share and BPS Analysis by Functionality, 2025 and 2035
  • Figure 17: Global Market Y-o-Y Growth Comparison by Functionality, 2025-2035
  • Figure 18: Global Market Attractiveness Analysis by Functionality
  • Figure 19: Global Market Value (USD Billion) Share and BPS Analysis by Region, 2025 and 2035
  • Figure 20: Global Market Y-o-Y Growth Comparison by Region, 2025-2035
  • Figure 21: Global Market Attractiveness Analysis by Region
  • Figure 22: USA Market Incremental $ Opportunity, 2025-2035
  • Figure 23: Latin America Market Incremental $ Opportunity, 2025-2035
  • Figure 24: Western Europe Market Incremental $ Opportunity, 2025-2035
  • Figure 25: Eastern Europe Market Incremental $ Opportunity, 2025-2035
  • Figure 26: East Asia Market Incremental $ Opportunity, 2025-2035
  • Figure 27: South Asia & Pacific Market Incremental $ Opportunity, 2025-2035
  • Figure 28: Middle East and Africa Market Incremental $ Opportunity, 2025-2035
  • Figure 29: USA Market Value Share and BPS Analysis by Country, 2025 and 2035
  • Figure 30: USA Market Value Share and BPS Analysis by Product Forms, 2025 and 2035
  • Figure 31: USA Market Y-o-Y Growth Comparison by Product Forms, 2025-2035
  • Figure 32: USA Market Attractiveness Analysis by Product Forms
  • Figure 33: USA Market Value Share and BPS Analysis by Ingredients Source, 2025 and 2035
  • Figure 34: USA Market Y-o-Y Growth Comparison by Ingredients Source, 2025-2035
  • Figure 35: USA Market Attractiveness Analysis by Ingredients Source
  • Figure 36: USA Market Value Share and BPS Analysis by End User Demographics Type, 2025 and 2035
  • Figure 37: USA Market Y-o-Y Growth Comparison by End User Demographics Type, 2025-2035
  • Figure 38: USA Market Attractiveness Analysis by End User Demographics Type
  • Figure 39: USA Market Value Share and BPS Analysis by Sales Channel, 2025 and 2035
  • Figure 40: USA Market Y-o-Y Growth Comparison by Sales Channel, 2025-2035
  • Figure 41: USA Market Attractiveness Analysis by Sales Channel
  • Figure 42: USA Market Value Share and BPS Analysis by Functionality, 2025 and 2035
  • Figure 43: USA Market Y-o-Y Growth Comparison by Functionality, 2025-2035
  • Figure 44: USA Market Attractiveness Analysis by Functionality
  • Figure 45: Latin America Market Value Share and BPS Analysis by Country, 2025 and 2035
  • Figure 46: Latin America Market Value Share and BPS Analysis by Product Forms, 2025 and 2035
  • Figure 47: Latin America Market Y-o-Y Growth Comparison by Product Forms, 2025-2035
  • Figure 48: Latin America Market Attractiveness Analysis by Product Forms
  • Figure 49: Latin America Market Value Share and BPS Analysis by Ingredients Source, 2025 and 2035
  • Figure 50: Latin America Market Y-o-Y Growth Comparison by Ingredients Source, 2025-2035
  • Figure 51: Latin America Market Attractiveness Analysis by Ingredients Source
  • Figure 52: Latin America Market Value Share and BPS Analysis by End User Demographics Type, 2025 and 2035
  • Figure 53: Latin America Market Y-o-Y Growth Comparison by End User Demographics Type, 2025-2035
  • Figure 54: Latin America Market Attractiveness Analysis by End User Demographics Type
  • Figure 55: Latin America Market Value Share and BPS Analysis by Sales Channel, 2025 and 2035
  • Figure 56: Latin America Market Y-o-Y Growth Comparison by Sales Channel, 2025-2035
  • Figure 57: Latin America Market Attractiveness Analysis by Sales Channel
  • Figure 58: Latin America Market Value Share and BPS Analysis by Functionality, 2025 and 2035
  • Figure 59: Latin America Market Y-o-Y Growth Comparison by Functionality, 2025-2035
  • Figure 60: Latin America Market Attractiveness Analysis by Functionality
  • Figure 61: Western Europe Market Value Share and BPS Analysis by Country, 2025 and 2035
  • Figure 62: Western Europe Market Value Share and BPS Analysis by Product Forms, 2025 and 2035
  • Figure 63: Western Europe Market Y-o-Y Growth Comparison by Product Forms, 2025-2035
  • Figure 64: Western Europe Market Attractiveness Analysis by Product Forms
  • Figure 65: Western Europe Market Value Share and BPS Analysis by Ingredients Source, 2025 and 2035
  • Figure 66: Western Europe Market Y-o-Y Growth Comparison by Ingredients Source, 2025-2035
  • Figure 67: Western Europe Market Attractiveness Analysis by Ingredients Source
  • Figure 68: Western Europe Market Value Share and BPS Analysis by End User Demographics Type, 2025 and 2035
  • Figure 69: Western Europe Market Y-o-Y Growth Comparison by End User Demographics Type, 2025-2035
  • Figure 70: Western Europe Market Attractiveness Analysis by End User Demographics Type
  • Figure 71: Western Europe Market Value Share and BPS Analysis by Sales Channel, 2025 and 2035
  • Figure 72: Western Europe Market Y-o-Y Growth Comparison by Sales Channel, 2025-2035
  • Figure 73: Western Europe Market Attractiveness Analysis by Sales Channel
  • Figure 74: Western Europe Market Value Share and BPS Analysis by Functionality, 2025 and 2035
  • Figure 75: Western Europe Market Y-o-Y Growth Comparison by Functionality, 2025-2035
  • Figure 76: Western Europe Market Attractiveness Analysis by Functionality
  • Figure 77: Eastern Europe Market Value Share and BPS Analysis by Country, 2025 and 2035
  • Figure 78: Eastern Europe Market Value Share and BPS Analysis by Product Forms, 2025 and 2035
  • Figure 79: Eastern Europe Market Y-o-Y Growth Comparison by Product Forms, 2025-2035
  • Figure 80: Eastern Europe Market Attractiveness Analysis by Product Forms
  • Figure 81: Eastern Europe Market Value Share and BPS Analysis by Ingredients Source, 2025 and 2035
  • Figure 82: Eastern Europe Market Y-o-Y Growth Comparison by Ingredients Source, 2025-2035
  • Figure 83: Eastern Europe Market Attractiveness Analysis by Ingredients Source
  • Figure 84: Eastern Europe Market Value Share and BPS Analysis by End User Demographics Type, 2025 and 2035
  • Figure 85: Eastern Europe Market Y-o-Y Growth Comparison by End User Demographics Type, 2025-2035
  • Figure 86: Eastern Europe Market Attractiveness Analysis by End User Demographics Type
  • Figure 87: Eastern Europe Market Value Share and BPS Analysis by Sales Channel, 2025 and 2035
  • Figure 88: Eastern Europe Market Y-o-Y Growth Comparison by Sales Channel, 2025-2035
  • Figure 89: Eastern Europe Market Attractiveness Analysis by Sales Channel
  • Figure 90: Eastern Europe Market Value Share and BPS Analysis by Functionality, 2025 and 2035
  • Figure 91: Eastern Europe Market Y-o-Y Growth Comparison by Functionality, 2025-2035
  • Figure 92: Eastern Europe Market Attractiveness Analysis by Functionality
  • Figure 93: East Asia Market Value Share and BPS Analysis by Country, 2025 and 2035
  • Figure 94: East Asia Market Value Share and BPS Analysis by Product Forms, 2025 and 2035
  • Figure 95: East Asia Market Y-o-Y Growth Comparison by Product Forms, 2025-2035
  • Figure 96: East Asia Market Attractiveness Analysis by Product Forms
  • Figure 97: East Asia Market Value Share and BPS Analysis by Ingredients Source, 2025 and 2035
  • Figure 98: East Asia Market Y-o-Y Growth Comparison by Ingredients Source, 2025-2035
  • Figure 99: East Asia Market Attractiveness Analysis by Ingredients Source
  • Figure 100: East Asia Market Value Share and BPS Analysis by End User Demographics Type, 2025 and 2035
  • Figure 101: East Asia Market Y-o-Y Growth Comparison by End User Demographics Type, 2025-2035
  • Figure 102: East Asia Market Attractiveness Analysis by End User Demographics Type
  • Figure 103: East Asia Market Value Share and BPS Analysis by Sales Channel, 2025 and 2035
  • Figure 104: East Asia Market Y-o-Y Growth Comparison by Sales Channel, 2025-2035
  • Figure 105: East Asia Market Attractiveness Analysis by Sales Channel
  • Figure 106: East Asia Market Value Share and BPS Analysis by Functionality, 2025 and 2035
  • Figure 107: East Asia Market Y-o-Y Growth Comparison by Functionality, 2025-2035
  • Figure 108: East Asia Market Attractiveness Analysis by Functionality
  • Figure 109: South Asia & Pacific Market Value Share and BPS Analysis by Country, 2025 and 2035
  • Figure 110: South Asia & Pacific Market Value Share and BPS Analysis by Product Forms, 2025 and 2035
  • Figure 111: South Asia & Pacific Market Y-o-Y Growth Comparison by Product Forms, 2025-2035
  • Figure 112: South Asia & Pacific Market Attractiveness Analysis by Product Forms
  • Figure 113: South Asia & Pacific Market Value Share and BPS Analysis by Ingredients Source, 2025 and 2035
  • Figure 114: South Asia & Pacific Market Y-o-Y Growth Comparison by Ingredients Source, 2025-2035
  • Figure 115: South Asia & Pacific Market Attractiveness Analysis by Ingredients Source
  • Figure 116: South Asia & Pacific Market Value Share and BPS Analysis by End User Demographics Type, 2025 and 2035
  • Figure 117: South Asia & Pacific Market Y-o-Y Growth Comparison by End User Demographics Type, 2025-2035
  • Figure 118: South Asia & Pacific Market Attractiveness Analysis by End User Demographics Type
  • Figure 119: South Asia & Pacific Market Value Share and BPS Analysis by Sales Channel, 2025 and 2035
  • Figure 120: South Asia & Pacific Market Y-o-Y Growth Comparison by Sales Channel, 2025-2035
  • Figure 121: South Asia & Pacific Market Attractiveness Analysis by Sales Channel
  • Figure 122: South Asia & Pacific Market Value Share and BPS Analysis by Functionality, 2025 and 2035
  • Figure 123: South Asia & Pacific Market Y-o-Y Growth Comparison by Functionality, 2025-2035
  • Figure 124: South Asia & Pacific Market Attractiveness Analysis by Functionality
  • Figure 125: Middle East and Africa Market Value Share and BPS Analysis by Country, 2025 and 2035
  • Figure 126: Middle East and Africa Market Value Share and BPS Analysis by Product Forms, 2025 and 2035
  • Figure 127: Middle East and Africa Market Y-o-Y Growth Comparison by Product Forms, 2025-2035
  • Figure 128: Middle East and Africa Market Attractiveness Analysis by Product Forms
  • Figure 129: Middle East and Africa Market Value Share and BPS Analysis by Ingredients Source, 2025 and 2035
  • Figure 130: Middle East and Africa Market Y-o-Y Growth Comparison by Ingredients Source, 2025-2035
  • Figure 131: Middle East and Africa Market Attractiveness Analysis by Ingredients Source
  • Figure 132: Middle East and Africa Market Value Share and BPS Analysis by End User Demographics Type, 2025 and 2035
  • Figure 133: Middle East and Africa Market Y-o-Y Growth Comparison by End User Demographics Type, 2025-2035
  • Figure 134: Middle East and Africa Market Attractiveness Analysis by End User Demographics Type
  • Figure 135: Middle East and Africa Market Value Share and BPS Analysis by Sales Channel, 2025 and 2035
  • Figure 136: Middle East and Africa Market Y-o-Y Growth Comparison by Sales Channel, 2025-2035
  • Figure 137: Middle East and Africa Market Attractiveness Analysis by Sales Channel
  • Figure 138: Middle East and Africa Market Value Share and BPS Analysis by Functionality, 2025 and 2035
  • Figure 139: Middle East and Africa Market Y-o-Y Growth Comparison by Functionality, 2025-2035
  • Figure 140: Middle East and Africa Market Attractiveness Analysis by Functionality
  • Figure 141: Global Market - Tier Structure Analysis
  • Figure 142: Global Market - Company Share Analysis

Frequently Asked Questions

What is the current size of the pediatric supplement market?

The market is valued at USD 3.5 billion in 2025.

What is the projected growth rate for pediatric supplement?

The market is expected to grow at a CAGR of 8.0% from 2025 to 2035.

Which product form leads the pediatric supplement market?

Gummies are projected to hold the largest share with 28% in 2025.

Which ingredient source segment leads the pediatric supplement market?

The plant-based segment leads the pediatric supplement market, holding around 34% market share in 2025 due to rising demand for natural and herbal formulations.

Which country is expected to witness the fastest growth in this pediatric supplement market?

The USA is projected to record the fastest growth with a CAGR of 5.1% during 2025 to 2035.

Explore Similar Insights

Future Market Insights

Pediatric Supplement Market