PDRN Supplements Market Size and Share Forecast Outlook 2025 to 2035

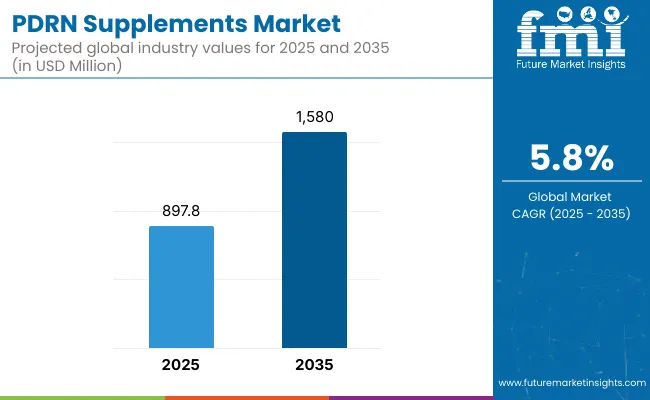
The global PDRN Supplements Market is expected to be valued at USD 897.8 million in 2025, progressing to approximately USD 1,580.0 million by 2035, marking a total increase of USD 682.2 million equivalent to a 76% absolute growth over the decade. This expansion translates into a compound annual growth rate (CAGR) of 5.8%, with a near 1.8X market size increase projected by the end of the forecast period.
Quick Stats for PDRN Supplements Market

  • PDRN Supplements Market Value (2025): USD 897.8 million
  • PDRN Supplements Market Forecast Value (2035): USD 1,580.0 million
  • PDRN Supplements Market Forecast CAGR (2025t to 2035): 5.8%
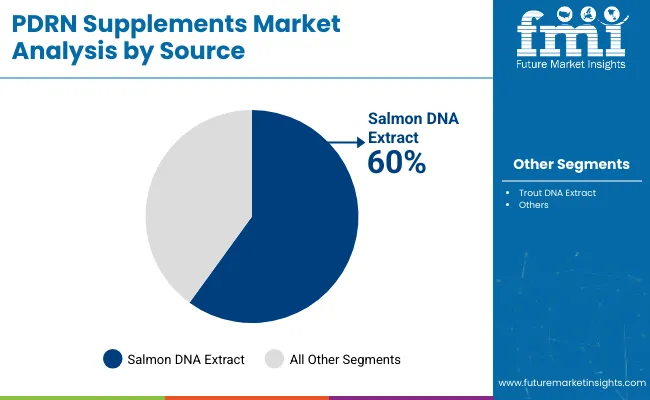
  • Leading Segment in PDRN Supplements Market in 2025: Salmon DNA Extract (60%)
  • Key Growth Regions in the PDRN Supplements Market: East Asia, North America, Western Europe
  • Top Key Players in the PDRN Supplements Market: PharmaResearch Products (Rejuran), Daewoong Pharmaceutical, Caregen Co., Ltd., Healux Corporation, Mediheal, MastelliSrl, Toskani Cosmetics, Newmedi Co., Ltd., Samyang Biopharm, PharmaResearch Bio

Pdrn Supplements Market

PDRN Supplements Market Key Takeaways

Metric Value
Market Estimated Value in (2025E) USD 897.8 million
Market Forecast Value in (2035F) USD 1,580.0 million
Forecast CAGR (2025 to 2035) 5.8%

During the first half of the decade (2025-2030), the market is projected to grow from USD 897.8 million to USD 1,194.5 million, adding approximately USD 296.7 million in value accounting for 43.5% of the total ten-year growth. This initial phase is anticipated to be characterized by early clinical validation, expanding product pipelines from nutraceutical innovators, and growing adoption of marine-based DNA extracts in functional health categories such as anti-aging and tissue regeneration.

Between 2030 and 2035, a more accelerated growth curve is expected, as the market moves from USD 1,194.5 million to USD 1,580.0 million, contributing the remaining USD 385.5 million or 56.5% of total growth. This latter phase is projected to be driven by the widespread adoption of PDRN supplements in therapeutic nutrition, orthobiologics, and sports recovery segments.

Format innovations such as bioactive capsules, functional beverages, and clinical sachets are expected to dominate, supported by AI-led personalization, improved bioavailability science, and integration into holistic wellness regimens across global health-conscious consumer bases.

From 2020 to 2024, the PDRN Supplements Market expanded steadily, fueled by the rising integration of injectable and oral PDRN products in aesthetic clinics, sports medicine, and clinical wellness centers. During this period, the competitive landscape was dominated by Korean and Italian manufacturers, with PharmaResearch Products and Daewoong Pharmaceutical collectively estimated to hold over 30% of the global share. Clinical-grade injectables led revenue streams, while oral formats gained traction through direct-to-consumer wellness channels.

By 2025, the market is projected to reach USD 897.8 million, with value increasingly transitioning toward oral solutions, functional drinks, and hybrid topical-oral kits. Between 2025 to 2035, a diversification of formats and delivery mechanisms is anticipated, alongside regulatory acceptance in new regions.

As innovation shifts from raw ingredient sourcing to bioavailability optimization, clinical synergy, and personalized delivery, competitive advantage will depend on ecosystem integration linking formulation science, regulatory precision, and consumer health platforms. Traditional injectable-focused players are being challenged by nutraceutical-first entrants, signaling a broader transition from medical aesthetics to mainstream therapeutic nutrition.

Why the PDRN Supplements Market is growing?

The growth of the PDRN Supplements Market is being driven by a convergence of clinical research validation, increasing consumer focus on regenerative health, and product differentiation through bioactive marine ingredients. Proven benefits of PDRN in tissue repair, skin rejuvenation, and inflammation reduction have been increasingly supported by peer-reviewed studies, prompting higher confidence among health practitioners and formulators. The preference for non-invasive supplementation solutions has been reinforced by lifestyle trends centered around longevity, aesthetic wellness, and preventative care.

Momentum is also being generated through rising applications in orthobiologics and cosmeceuticals, where PDRN supplements are being integrated into routine protocols for recovery and vitality. Enhanced extraction technologies have allowed for better preservation of nucleotides, improving formulation efficacy and shelf stability.

Additionally, growth is expected to be catalyzed by the increasing availability of premium nutraceutical formats including sachets, capsules, and functional beverages designed for convenient, high-absorption delivery. Strategic partnerships between marine biotech firms and supplement brands are expected to further accelerate commercialization pathways.

Segmental Analysis

The PDRN Supplements Market has been segmented into source, application, product format, and regions to accurately capture evolving dynamics within marine-based bioactive supplementation. The source segment includes Salmon DNA Extract, Trout DNA Extract, and Other Marine DNA Sources, reflecting the diversity of nucleotide origins employed in supplement development.
Insights into the Source Segment with Salmon DNA Extract Leading in Market Share

Pdrn Supplements Market By Source

Segment 2025 Share (%)
Salmon DNA Extract 60%
Trout DNA Extract 25%
Other Marine DNA Sources 15%

The Salmon DNA Extract segment is projected to dominate the PDRN supplements market in 2025, commanding a 60% share. Its clinical efficacy in skin repair, inflammation modulation, and cellular regeneration has been well-documented, positioning it as a preferred source for premium formulations.

Its molecular compatibility with human tissues has supported widespread adoption across cosmeceutical and wellness products. Manufacturers have prioritized salmon-derived DNA for its consistent purity, stability, and established regulatory pathways.

The segment’s leadership is expected to be reinforced by patented extraction techniques and high-value branding in anti-aging and therapeutic recovery applications. As innovation deepens in marine bioprocessing, Salmon DNA is projected to retain its dominant market presence across the forecast horizon.
Insights into the Application Segment with Skin Regeneration & Anti-Aging Leading

Pdrn Supplements Market By Application

Application 2025 Share (%)
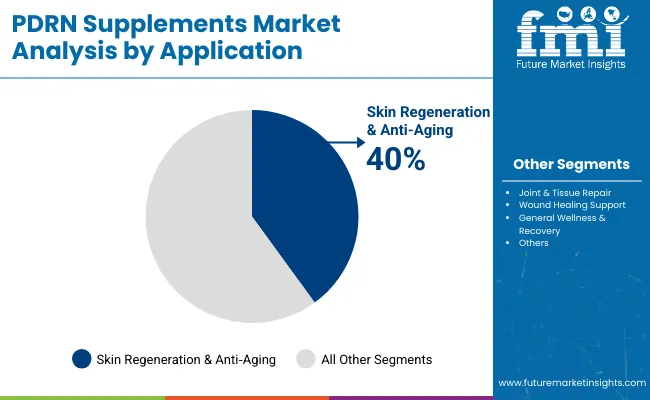
Skin Regeneration & Anti Aging 40%
Joint & Tissue Repair 25%
Wound Healing Support 20%
General Wellness & Recovery 15%

Skin Regeneration & Anti-Aging is projected to lead all applications, holding a 40% market share in 2025. This growth is being supported by increasing demand for non-invasive aesthetic enhancement and cellular longevity products. The category’s strength has been reinforced by strong clinical validation, making it the primary use-case across premium nutraceutical portfolios.

Integration into dermatology-driven wellness regimens and growing popularity among middle-aged consumers has accelerated product uptake. In parallel, high-profile endorsements and social media visibility have expanded awareness. As beauty-from-within trends intensify, and as PDRN’s reparative role gains further medical recognition, this segment is expected to continue anchoring the market’s value proposition.
Insights into the Product Format Segment with Capsules Leading

Pdrn Supplements Market By Product

Product Format 2025 Share (%)
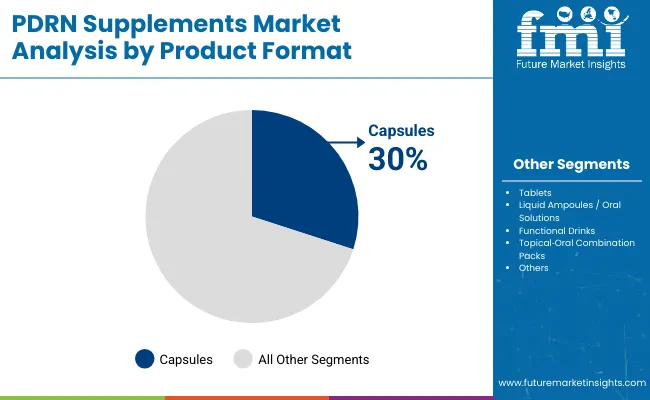
Capsules 30%
Tablets 20%
Liquid Ampoules / Oral Solutions 25%
Functional Drinks 15%
Topical Oral Combination Packs 10%

Capsules are anticipated to lead the product format segment with a 30% share in 2025. This dominance is being driven by consumer preference for convenient, standardized dosing formats with improved bioavailability. Capsules have been preferred in clinical and consumer settings due to ease of consumption, shelf stability, and scalable formulation compatibility with marine DNA actives.

The format’s success has also been attributed to its ability to mask taste and simplify daily supplementation routines. As personalization and targeted supplementation trends evolve, capsule-based delivery is expected to remain the format of choice for PDRN supplements especially among consumers seeking precision-based regenerative health solutions.

What are the Drivers, Restraints, and Key Trends of the PDRN Supplements Market?

Rising consumer inclination toward non-invasive regenerative solutions is accelerating demand for PDRN supplements, although challenges around formulation bioavailability and clinical validation continue to constrain market scalability across therapeutic and wellness domains.

Increasing Integration of PDRN in Therapeutic Nutrition and Functional Aesthetics

Demand growth is being accelerated by the integration of PDRN into therapeutic nutrition and aesthetic wellness solutions. Backed by evidence of enhanced tissue regeneration, inflammation modulation, and cellular repair, PDRN-based supplements have been positioned as a scientifically credible alternative to invasive procedures.

Product adoption has been supported by expanding clinical usage in orthobiologics, dermatology, and post-operative recovery. Consumer awareness campaigns and medical endorsements have further amplified confidence in PDRN's long-term efficacy, especially in aging-related applications. As the boundaries between clinical and consumer health continue to blur, PDRN is expected to play a central role in bridging therapeutic outcomes with daily preventive care strategies.

Shift Toward Combination Formulations for Synergistic Efficacy

Market innovation has increasingly shifted toward combination formulations wherein PDRN is paired with peptides, antioxidants, hyaluronic acid, or collagen. This trend has been shaped by consumer demand for multi-functional solutions capable of delivering compounded benefits in skin health, joint recovery, and systemic repair.

Supplement brands have begun prioritizing ingredient synergies to boost absorption and enhance therapeutic value. Clinical trials and in-vitro studies validating such synergies have encouraged R&D investment. As this trend gains momentum, products offering targeted, layered outcomes are expected to capture premium positioning and command higher consumer loyalty across health and beauty segments.
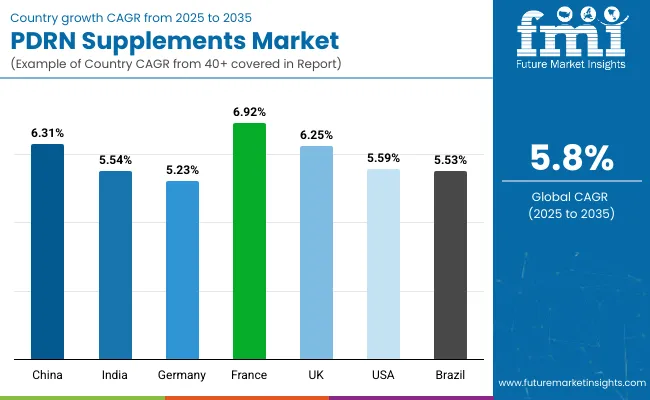
Analysis of PDRN Supplements Market By Key Countries

Pdrn Supplements Market By Country

Countries CAGR
China 6.31%
India 5.54%
Germany 5.23%
France 6.92%
UK 6.25%
USA 5.59%
Brazil 5.53%
China 6.31%

The global PDRN Supplements Market demonstrates a varied country-wise growth trajectory, shaped by differences in consumer health awareness, clinical adoption rates, and nutraceutical regulatory landscapes. France is projected to record the highest CAGR of 6.92% between 2025 and 2035, owing to early medical endorsement and sustained consumer preference for marine-based skin health solutions. PDRN usage in post-procedural recovery and dermo-nutrition has already been widely integrated into French cosmeceutical protocols.

China follows closely with a 6.31% CAGR, driven by its rapidly scaling nutraceutical ecosystem and strong demand for evidence-based anti-aging supplements. The country’s aggressive innovation in marine bioactives and health tech integration is expected to reinforce PDRN demand across both retail and hospital channels. The UK, at 6.25% CAGR, is expected to benefit from wellness-centric consumer behavior, with growing clinical application in regenerative therapies.

India and Brazil, growing at 5.54% and 5.53% respectively, are projected to gain momentum as awareness spreads beyond metropolitan areas, aided by local partnerships and DTC platform expansion. Meanwhile, the USA (5.59%) and Germany (5.23%) are expected to exhibit steady yet moderate growth, with adoption led by sports medicine, functional nutrition, and anti-inflammatory use cases. Regulatory clarity and clinical validation will be critical to unlocking latent demand in these mature markets.

Sales Outlook for PDRN Supplements in the United States

Years USA (USD million)
2025 215.47
2026 226.3
2027 239.8
2028 253.5
2029 267.1
2030 282.7
2031 301.7
2032 318.0
2033 336.7
2034 357.3
2035 377.6

The PDRN Supplements Market in the United States is projected to expand from USD 215.47 million in 2025 to USD 377.60 million by 2035, registering a CAGR of 5.8% over the forecast period. Growth is expected to be supported by increasing clinical integration of PDRN in sports medicine, post-operative recovery, and aesthetic wellness programs. As the demand for regenerative nutrition expands across health-conscious consumers and aging populations, greater uptake in orthobiologic and cosmeceutical settings is anticipated.

Adoption is being driven by rising physician-led nutraceutical recommendations, especially in fields such as orthopedics, dermatology, and functional medicine. The therapeutic value of salmon-derived PDRN has gained wider acknowledgment through practitioner channels, boosting its inclusion in supplement protocols for inflammation, tissue repair, and joint restoration.

In parallel, DTC nutraceutical brands in the USA have begun leveraging PDRN’s regenerative appeal within beauty-from-within, longevity, and clinical-grade wellness platforms. Subscription-based models and bundled offerings are expected to gain traction.

  • Orthopedic and sports recovery specialists are increasingly prescribing PDRN for non-invasive tissue regeneration.
  • Premium anti-aging supplement brands are integrating PDRN into capsules and oral solutions.
  • Clinical distribution is expanding across concierge healthcare, integrative clinics, and practitioner-only supplement channels.

Growth and Expansion Outlook for PDRN Supplements Market in the United Kingdom

The UK PDRN Supplements Market is expected to grow at a CAGR of 6.25% from 2025 to 2035, driven by rising integration of marine bioactives into functional nutrition and clinical wellness frameworks. Demand is being reinforced by strong regulatory acceptance of clean-label nutraceuticals and practitioner-led adoption in private health clinics.

  • Anti-aging and cosmeceutical applications are being prioritized within urban wellness chains and dermatology centers.
  • Direct-to-consumer brands are promoting PDRN supplements for cellular longevity and vitality enhancement.
  • Nutraceutical personalization platforms are integrating PDRN into precision wellness programs.
  • Clinical partnerships and ingredient traceability are supporting premium positioning in retail and e-pharmacies.

Growth and Expansion Outlook for PDRN Supplements Market in India

The Indian PDRN Supplements Market is forecasted to expand at a CAGR of 5.54% during 2025 to 2035, with growth driven by increasing awareness around joint health, tissue repair, and post-surgical recovery in Tier 1 and Tier 2 cities. Rising middle-class income and preventive health focus have supported nutraceutical uptake.

  • Demand is being led by sports recovery clinics and orthopedic practitioners in metro regions.
  • PDRN-based joint care solutions are being marketed as Ayurvedic-compatible hybrid supplements.
  • Local manufacturing partnerships are expected to reduce cost barriers for broader adoption.
  • Functional beverage and capsule formats are gaining traction across pharmacy and online channels.

Sales Outlook for PDRN Supplements in China

The Chinese PDRN Supplements Market is anticipated to grow at a CAGR of 6.31% between 2025 and 2035, supported by widespread clinical acceptance and aggressive innovation in marine-based regenerative formulations. Government support for biotech-driven nutrition has further catalyzed growth in both hospital and retail segments.

  • Clinical-grade PDRN is being incorporated into TCM-integrated longevity therapies.
  • Cosmeceutical brands are expanding PDRN offerings through livestream commerce and KOL marketing.
  • Investment in marine biotech parks is fostering localized sourcing and product development.
  • Cross-border e-commerce platforms are enabling PDRN penetration into premium wellness segments.

In-depth Analysis of PDRN Supplements in Germany

Countries 2025
UK 19.90%
Germany 20.46%
Italy 11.67%
France 14.87%
Spain 10.81%
BENELUX 6.19%
Nordic 5.36%
Rest of Europe 11%
Countries 2035
UK 18.19%
Germany 21.21%
Italy 11.74%
France 14.82%
Spain 11.99%
BENELUX 5.07%
Nordic 5.94%
Rest of Europe 11%

The German PDRN Supplements Market is expected to grow at a CAGR of 5.23% from 2025 to 2035, characterized by high regulatory scrutiny and methodical adoption through practitioner channels. Clinical nutraceuticals are gaining ground in orthopedics and dermatology-led recovery regimens.

  • PDRN is being included in physician-formulated joint repair and inflammation control products.
  • Regulatory clarity on marine DNA sourcing is influencing purchasing decisions among premium consumers.
  • Functional aging clinics are incorporating PDRN in biohacking and longevity treatment stacks.
  • Supplement R&D is focusing on PDRN synergy with collagen and hyaluronic acid for enhanced bioactivity.

Growth Outlook for PDRN Supplements Market in Japan

Application 2025 Share (%)
Skin Regeneration & Anti Aging 45%
Joint & Tissue Repair 25%
Wound Healing Support 20%
General Wellness & Recovery 10%

The PDRN Supplements Market in Japan is projected to reach a significant valuation in 2025, led by the Skin Regeneration & Anti-Aging segment, which holds a commanding 45% share. This dominance has been attributed to Japan’s advanced dermaceutical ecosystem, where clinically validated, non-invasive anti-aging solutions are being increasingly preferred over surgical interventions. Strong demand from beauty clinics and health-conscious consumers has supported rapid market adoption.

A robust CAGR of 9.00% for this segment highlights its strategic importance in driving Japan’s overall market growth. Use cases in Joint & Tissue Repair (25%) and Wound Healing Support (20%) are also witnessing upward momentum, driven by an aging population and a growing focus on mobility and post-operative recovery.

Formulations emphasizing precision, purity, and traceability are being favored, especially when aligned with Japan’s regulatory expectations and consumer preferences. As AI-driven wellness diagnostics and personalized supplementation platforms expand, demand for clinically backed regenerative actives like PDRN is expected to accelerate further.

  • Japan contributes a notable share to the global PDRN supplements market in 2025.
  • Skin regeneration leads with 45% market share, supported by aesthetic health focus.
  • Rapid CAGR driven by clinical-grade dermaceutical innovation and aging population trends.
  • Personalized nutrition and AI-integrated wellness are amplifying therapeutic demand.

Opportunity Analysis of South Korea PDRN Supplements Market

Product Format 2025 Share (%)
Capsules 28%
Tablets 18%
Liquid Ampoules / Oral Solutions 27%
Functional Drinks 17%
Topical Oral Combination Packs 10%

The PDRN Supplements Market in South Korea is projected to reflect strong value-led growth by 2025, with Capsules (28%) and Liquid Ampoules (27%) leading the product format segment. South Korea’s advanced cosmetic and clinical wellness industries have prioritized bioavailable, high-potency delivery formats, particularly those aligning with consumer preferences for on-the-go convenience and visible outcomes.

The Topical-Oral Combination Pack category, while currently holding a smaller share at 10%, is projected to grow the fastest, recording a CAGR of 9.50%. This reflects an emerging shift toward integrated beauty-from-within and surface-level regeneration protocols a space heavily influenced by K-beauty innovation.

Innovations in packaging, dose customization, and dermatology-clinic-led endorsements are accelerating new product launches across premium retail and e-commerce platforms. As functional aesthetics and personalized nutri-cosmetic routines deepen in adoption, South Korea is expected to emerge as a blueprint market for dual-format therapeutic solutions.
  • South Korea’s PDRN format market is led by Capsules (28%) and Liquid Ampoules (27%) in 2025.
  • Topical-Oral Combination Packs post the highest CAGR at 9.50%, reflecting hybrid therapy preference.
  • Growth is powered by dermatology-driven routines, clean-label expectations, and premium aesthetic positioning.
  • Integrated dose forms and nutri-cosmetic crossovers will shape future market trajectories.

Competitive Landscape of PDRN Supplements Market

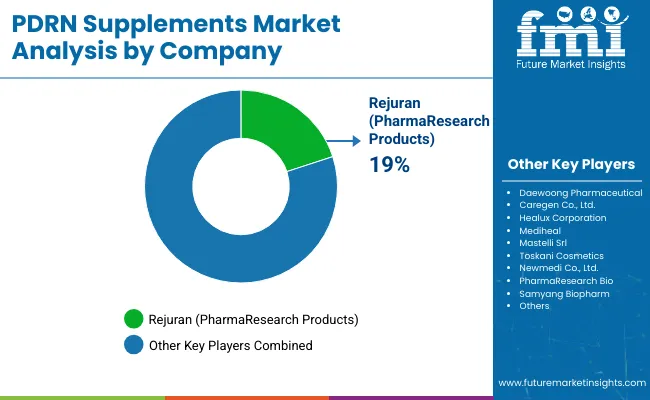
Pdrn Supplements Market By Company

The PDRN Supplements Market is moderately fragmented, with a mix of multinational pharmaceutical firms, regional cosmeceutical brands, and biotech-driven specialists competing across therapeutic and aesthetic applications. Global leaders such as PharmaResearch Products (Rejuran) and Daewoong Pharmaceutical have maintained strong footholds due to their clinically validated injectable-grade PDRN and extensive medical practitioner networks. These players are leveraging R&D alliances, hospital-based trials, and international expansion to consolidate leadership in both oral and parenteral PDRN formats.

Mid-sized companies like Caregen Co., Ltd., Healux Corporation, and PharmaResearch Bio have focused on expanding their PDRN product portfolios into capsules, ampoules, and cosmetic-drug hybrids, especially within South Korea and Southeast Asia. Their strength has been reinforced by IP-driven extraction technologies and integration with K-beauty export platforms.

Cosmeceutical and nutraceutical innovators such as Mediheal, Newmedi Co., Ltd., and Toskani Cosmetics are capturing demand through DTC and professional skincare channels. These firms are increasingly emphasizing topical-oral combinations, backed by dermatology clinics and personalized skincare routines.

Competitive advantage is shifting from raw PDRN sourcing to delivery system innovation, regulatory compliance, and clinically supported multi-functional claims. Subscription-based offerings, hybrid formats, and cross-border e-commerce platforms are expected to redefine brand positioning and consumer loyalty within this evolving marketplace.

Key Developments in PDRN Supplements Market

  • A novel "Blue PDRN" extracted from microalgae (Chlorella) was published in Archives of Dermatological Research in April 2025, demonstrating significant skin‑regeneration and wound‑healing effects. This sustainable, non-animal-derived PDRN innovation is being positioned as a breakthrough in biocompatible functional skincare.
  • In April 2025, HLB Pharmaceutical launched "NATIA PDRN Direct", Korea’s first high‑dose oral dissolving film delivering 100 mg of purified PDRN for rapid mucosal absorption. It was positioned to elevate bioavailability and convenience in the anti-aging supplement segment.

Scope of the Report

Item Value
Quantitative Units USD 897.8 Million
Component Capsules, Tablets, Liquid Ampoules / Oral Solutions, Functional Drinks, Topical-Oral Combination Packs
Source Salmon DNA Extract, Trout DNA Extract, Other Marine DNA Sources
Application Skin Regeneration & Anti-Aging, Joint & Tissue Repair, Wound Healing Support, General Wellness & Recovery
Format Type Oral, Topical, Oral-Topical Hybrid
End-use Industry Clinical Nutrition, Aesthetic Dermatology, Sports Medicine, Integrative Healthcare, Functional Cosmetics
Regions Covered North America, Europe, East Asia, South Asia & Pacific, Latin America, Middle East & Africa
Countries Covered United States, Canada, Germany, France, United Kingdom, China, Japan, South Korea, India, Brazil
Key Companies Profiled PharmaResearch Products (Rejuran), Daewoong Pharmaceutical, Caregen Co., Ltd., Healux Corporation, Mediheal, Mastelli Srl, Toskani Cosmetics, Newmedi Co., Ltd., PharmaResearch Bio, Samyang Biopharm

Key Segments

By Source:

  • Salmon DNA Extract
  • Trout DNA Extract
  • Other Marine DNA Sources

By Application:

  • Skin Regeneration & Anti‑Aging
  • Joint & Tissue Repair
  • Wound Healing Support
  • General Wellness & Recovery

By Product Format:

  • Capsules
  • Tablets
  • Liquid Ampoules / Oral Solutions
  • Functional Drinks
  • Topical‑Oral Combination Packs

By Sales Channel:

  • Pharmacies & Drugstores
  • Health & Nutrition Stores
  • Online Retail
  • Direct‑to‑Consumer (DTC) Brands
  • Practitioner / Clinic Distribution

By Region:

  • North America
  • Latin America
  • Europe
  • East Asia
  • South Asia & Pacific
  • Middle East & Africa

Table of Content

  1. Executive Summary
    • Global Market Outlook
    • Demand-side Trends
    • Supply-side Trends
    • Technology Roadmap Analysis
    • Analysis and Recommendations
  2. Market Overview
    • Market Coverage / Taxonomy
    • Market Definition / Scope / Limitations
  3. Market Background
    • Market Dynamics
      • Drivers
      • Restraints
      • Opportunity
      • Trends
    • Scenario Forecast
      • Demand in Optimistic Scenario
      • Demand in Likely Scenario
      • Demand in Conservative Scenario
    • Opportunity Map Analysis
    • Product Life Cycle Analysis
    • Supply Chain Analysis
    • Investment Feasibility Matrix
    • Value Chain Analysis
    • PESTLE and Porter’s Analysis
    • Regulatory Landscape
    • Regional Parent Market Outlook
    • Production and Consumption Statistics
    • Import and Export Statistics
  4. Global Market Analysis 2020 to 2024 and Forecast, 2025 to 2035
    • Historical Market Size Value (USD Million) & Volume (Units) Analysis, 2020 to 2024
    • Current and Future Market Size Value (USD Million) & Volume (Units) Projections, 2025 to 2035
      • Y-o-Y Growth Trend Analysis
      • Absolute $ Opportunity Analysis
  5. Global Market Pricing Analysis 2020 to 2024 and Forecast 2025 to 2035
  6. Global Market Analysis 2020 to 2024 and Forecast 2025 to 2035, By Source
    • Introduction / Key Findings
    • Historical Market Size Value (USD Million) & Volume (Units) Analysis By Source, 2020 to 2024
    • Current and Future Market Size Value (USD Million) & Volume (Units) Analysis and Forecast By Source, 2025 to 2035
      • Salmon DNA Extract
      • Trout DNA Extract
      • Other Marine DNA Sources
    • Y-o-Y Growth Trend Analysis By Source, 2020 to 2024
    • Absolute $ Opportunity Analysis By Source, 2025 to 2035
  7. Global Market Analysis 2020 to 2024 and Forecast 2025 to 2035, By Application
    • Introduction / Key Findings
    • Historical Market Size Value (USD Million) & Volume (Units) Analysis By Application, 2020 to 2024
    • Current and Future Market Size Value (USD Million) & Volume (Units) Analysis and Forecast By Application, 2025 to 2035
      • Skin Regeneration & Anti‑Aging
      • Joint & Tissue Repair
      • Wound Healing Support
      • General Wellness & Recovery
    • Y-o-Y Growth Trend Analysis By Application, 2020 to 2024
    • Absolute $ Opportunity Analysis By Application, 2025 to 2035
  8. Global Market Analysis 2020 to 2024 and Forecast 2025 to 2035, By Product Format
    • Introduction / Key Findings
    • Historical Market Size Value (USD Million) & Volume (Units) Analysis By Product Format, 2020 to 2024
    • Current and Future Market Size Value (USD Million) & Volume (Units) Analysis and Forecast By Product Format, 2025 to 2035
      • Capsules
      • Tablets
      • Liquid Ampoules / Oral Solutions
      • Functional Drinks
      • Topical‑Oral Combination Packs
    • Y-o-Y Growth Trend Analysis By Product Format, 2020 to 2024
    • Absolute $ Opportunity Analysis By Product Format, 2025 to 2035
  9. Global Market Analysis 2020 to 2024 and Forecast 2025 to 2035, By Sales Channel
    • Introduction / Key Findings
    • Historical Market Size Value (USD Million) & Volume (Units) Analysis By Sales Channel, 2020 to 2024
    • Current and Future Market Size Value (USD Million) & Volume (Units) Analysis and Forecast By Sales Channel, 2025 to 2035
      • Pharmacies & Drugstores
      • Health & Nutrition Stores
      • Online Retail
      • Direct‑to‑Consumer (DTC) Brands
      • Practitioner / Clinic Distribution
    • Y-o-Y Growth Trend Analysis By Sales Channel, 2020 to 2024
    • Absolute $ Opportunity Analysis By Sales Channel, 2025 to 2035
  10. Global Market Analysis 2020 to 2024 and Forecast 2025 to 2035, By Region
    • Introduction
    • Historical Market Size Value (USD Million) & Volume (Units) Analysis By Region, 2020 to 2024
    • Current Market Size Value (USD Million) & Volume (Units) Analysis and Forecast By Region, 2025 to 2035
      • North America
      • Latin America
      • Europe
      • East Asia
      • South Asia & Pacific
      • Middle East & Africa
    • Market Attractiveness Analysis By Region
  11. North America Market Analysis 2020 to 2024 and Forecast 2025 to 2035, By Country
    • Historical Market Size Value (USD Million) & Volume (Units) Trend Analysis By Market Taxonomy, 2020 to 2024
    • Market Size Value (USD Million) & Volume (Units) Forecast By Market Taxonomy, 2025 to 2035
      • By Country
        • USA
        • Canada
      • By Source
      • By Application
      • By Product Format
      • By Sales Channel
    • Market Attractiveness Analysis
      • By Country
      • By Source
      • By Application
      • By Product Format
      • By Sales Channel
    • Key Takeaways
  12. Latin America Market Analysis 2020 to 2024 and Forecast 2025 to 2035, By Country
    • Historical Market Size Value (USD Million) & Volume (Units) Trend Analysis By Market Taxonomy, 2020 to 2024
    • Market Size Value (USD Million) & Volume (Units) Forecast By Market Taxonomy, 2025 to 2035
      • By Country
        • Brazil
        • Mexico
        • Colombia
        • Rest of Latin America
      • By Source
      • By Application
      • By Product Format
      • By Sales Channel
    • Market Attractiveness Analysis
      • By Country
      • By Source
      • By Application
      • By Product Format
      • By Sales Channel
    • Key Takeaways
  13. Europe Market Analysis 2020 to 2024 and Forecast 2025 to 2035, By Country
    • Historical Market Size Value (USD Million) & Volume (Units) Trend Analysis By Market Taxonomy, 2020 to 2024
    • Market Size Value (USD Million) & Volume (Units) Forecast By Market Taxonomy, 2025 to 2035
      • By Country
        • Germany
        • UK
        • France
        • Italy
        • Spain
        • Belgium
        • Netherlands
        • Nordic
        • Switzerland
        • Russia
        • Poland
        • Rest of Europe
      • By Source
      • By Application
      • By Product Format
      • By Sales Channel
    • Market Attractiveness Analysis
      • By Country
      • By Source
      • By Application
      • By Product Format
      • By Sales Channel
    • Key Takeaways
  14. East Asia Market Analysis 2020 to 2024 and Forecast 2025 to 2035, By Country
    • Historical Market Size Value (USD Million) & Volume (Units) Trend Analysis By Market Taxonomy, 2020 to 2024
    • Market Size Value (USD Million) & Volume (Units) Forecast By Market Taxonomy, 2025 to 2035
      • By Country
        • China
        • Japan
        • South Korea
      • By Source
      • By Application
      • By Product Format
      • By Sales Channel
    • Market Attractiveness Analysis
      • By Country
      • By Source
      • By Application
      • By Product Format
      • By Sales Channel
    • Key Takeaways
  15. South Asia & Pacific Market Analysis 2020 to 2024 and Forecast 2025 to 2035, By Country
    • Historical Market Size Value (USD Million) & Volume (Units) Trend Analysis By Market Taxonomy, 2020 to 2024
    • Market Size Value (USD Million) & Volume (Units) Forecast By Market Taxonomy, 2025 to 2035
      • By Country
        • India
        • Thailand
        • Malaysia
        • Indonesia
        • Singapore
        • Vietnam
        • Australia
        • New Zealand
        • Rest of South Asia
      • By Source
      • By Application
      • By Product Format
      • By Sales Channel
    • Market Attractiveness Analysis
      • By Country
      • By Source
      • By Application
      • By Product Format
      • By Sales Channel
    • Key Takeaways
  16. Middle East & Africa Market Analysis 2020 to 2024 and Forecast 2025 to 2035, By Country
    • Historical Market Size Value (USD Million) & Volume (Units) Trend Analysis By Market Taxonomy, 2020 to 2024
    • Market Size Value (USD Million) & Volume (Units) Forecast By Market Taxonomy, 2025 to 2035
      • By Country
        • Kingdom of Saudi Arabia
        • Other GCC Countries
        • Turkiye
        • South Africa
        • Other African Union
        • Rest of Middle East & Africa
      • By Source
      • By Application
      • By Product Format
      • By Sales Channel
    • Market Attractiveness Analysis
      • By Country
      • By Source
      • By Application
      • By Product Format
      • By Sales Channel
    • Key Takeaways
  17. Key Countries Market Analysis
    • USA
      • Pricing Analysis
      • Market Share Analysis, 2024
        • By Source
        • By Application
        • By Product Format
        • By Sales Channel
    • Canada
      • Pricing Analysis
      • Market Share Analysis, 2024
        • By Source
        • By Application
        • By Product Format
        • By Sales Channel
    • Brazil
      • Pricing Analysis
      • Market Share Analysis, 2024
        • By Source
        • By Application
        • By Product Format
        • By Sales Channel
    • Mexico
      • Pricing Analysis
      • Market Share Analysis, 2024
        • By Source
        • By Application
        • By Product Format
        • By Sales Channel
    • Colombia
      • Pricing Analysis
      • Market Share Analysis, 2024
        • By Source
        • By Application
        • By Product Format
        • By Sales Channel
    • Germany
      • Pricing Analysis
      • Market Share Analysis, 2024
        • By Source
        • By Application
        • By Product Format
        • By Sales Channel
    • UK
      • Pricing Analysis
      • Market Share Analysis, 2024
        • By Source
        • By Application
        • By Product Format
        • By Sales Channel
    • France
      • Pricing Analysis
      • Market Share Analysis, 2024
        • By Source
        • By Application
        • By Product Format
        • By Sales Channel
    • Italy
      • Pricing Analysis
      • Market Share Analysis, 2024
        • By Source
        • By Application
        • By Product Format
        • By Sales Channel
    • Spain
      • Pricing Analysis
      • Market Share Analysis, 2024
        • By Source
        • By Application
        • By Product Format
        • By Sales Channel
    • Belgium
      • Pricing Analysis
      • Market Share Analysis, 2024
        • By Source
        • By Application
        • By Product Format
        • By Sales Channel
    • Netherlands
      • Pricing Analysis
      • Market Share Analysis, 2024
        • By Source
        • By Application
        • By Product Format
        • By Sales Channel
    • Nordic
      • Pricing Analysis
      • Market Share Analysis, 2024
        • By Source
        • By Application
        • By Product Format
        • By Sales Channel
    • Switzerland
      • Pricing Analysis
      • Market Share Analysis, 2024
        • By Source
        • By Application
        • By Product Format
        • By Sales Channel
    • Russia
      • Pricing Analysis
      • Market Share Analysis, 2024
        • By Source
        • By Application
        • By Product Format
        • By Sales Channel
    • Poland
      • Pricing Analysis
      • Market Share Analysis, 2024
        • By Source
        • By Application
        • By Product Format
        • By Sales Channel
    • China
      • Pricing Analysis
      • Market Share Analysis, 2024
        • By Source
        • By Application
        • By Product Format
        • By Sales Channel
    • Japan
      • Pricing Analysis
      • Market Share Analysis, 2024
        • By Source
        • By Application
        • By Product Format
        • By Sales Channel
    • South Korea
      • Pricing Analysis
      • Market Share Analysis, 2024
        • By Source
        • By Application
        • By Product Format
        • By Sales Channel
    • India
      • Pricing Analysis
      • Market Share Analysis, 2024
        • By Source
        • By Application
        • By Product Format
        • By Sales Channel
    • Thailand
      • Pricing Analysis
      • Market Share Analysis, 2024
        • By Source
        • By Application
        • By Product Format
        • By Sales Channel
    • Indonesia
      • Pricing Analysis
      • Market Share Analysis, 2024
        • By Source
        • By Application
        • By Product Format
        • By Sales Channel
    • Australia
      • Pricing Analysis
      • Market Share Analysis, 2024
        • By Source
        • By Application
        • By Product Format
        • By Sales Channel
    • New Zealand
      • Pricing Analysis
      • Market Share Analysis, 2024
        • By Source
        • By Application
        • By Product Format
        • By Sales Channel
    • Turkey
      • Pricing Analysis
      • Market Share Analysis, 2024
        • By Source
        • By Application
        • By Product Format
        • By Sales Channel
    • UAE
      • Pricing Analysis
      • Market Share Analysis, 2024
        • By Source
        • By Application
        • By Product Format
        • By Sales Channel
    • Saudi Arabia
      • Pricing Analysis
      • Market Share Analysis, 2024
        • By Source
        • By Application
        • By Product Format
        • By Sales Channel
    • Israel
      • Pricing Analysis
      • Market Share Analysis, 2024
        • By Source
        • By Application
        • By Product Format
        • By Sales Channel
    • North Africa
      • Pricing Analysis
      • Market Share Analysis, 2024
        • By Source
        • By Application
        • By Product Format
        • By Sales Channel
    • South Africa
      • Pricing Analysis
      • Market Share Analysis, 2024
        • By Source
        • By Application
        • By Product Format
        • By Sales Channel
  18. Market Structure Analysis
    • Competition Dashboard
    • Competition Benchmarking
    • Market Share Analysis of Top Players
      • By Regional
      • By Source
      • By Application
      • By Product Format
      • By Sales Channel
  19. Competition Analysis
    • Competition Deep Dive
      • Rejuran (PharmaResearch Products)
        • Overview
        • Product Portfolio
        • Profitability by Market Segments (Product/Age /Sales Channel/Region)
        • Sales Footprint
        • Strategy Overview
        • Mediheal (South Korea)
        • Daewoong Pharmaceutical
        • Healux Corporation
        • Newmedi Co., Ltd.
        • Toskani Cosmetics
        • Mastelli Srl
        • PharmaResearch Bio
        • Caregen Co., Ltd.
        • Samyang Biopharm
        • Others
    • Assumptions & Acronyms Used
    • Research Methodology

List of Tables

  • Table 1: Global Market Value (USD Million) Forecast by Region, 2020-2035
  • Table 2: Global Market Volume (Units) Forecast by Region, 2020-2035
  • Table 3: Global Market Value (USD Million) Forecast by Source, 2020-2035
  • Table 4: Global Market Volume (Units) Forecast by Source, 2020-2035
  • Table 5: Global Market Value (USD Million) Forecast by Application, 2020-2035
  • Table 6: Global Market Volume (Units) Forecast by Application, 2020-2035
  • Table 7: Global Market Value (USD Million) Forecast by Product Format, 2020-2035
  • Table 8: Global Market Volume (Units) Forecast by Product Format, 2020-2035
  • Table 9: Global Market Value (USD Million) Forecast by Sales Channel, 2020-2035
  • Table 10: Global Market Volume (Units) Forecast by Sales Channel, 2020-2035
  • Table 11: North America Market Value (USD Million) Forecast by Country, 2020-2035
  • Table 12: North America Market Volume (Units) Forecast by Country, 2020-2035
  • Table 13: North America Market Value (USD Million) Forecast by Source, 2020-2035
  • Table 14: North America Market Volume (Units) Forecast by Source, 2020-2035
  • Table 15: North America Market Value (USD Million) Forecast by Application, 2020-2035
  • Table 16: North America Market Volume (Units) Forecast by Application, 2020-2035
  • Table 17: North America Market Value (USD Million) Forecast by Product Format, 2020-2035
  • Table 18: North America Market Volume (Units) Forecast by Product Format, 2020-2035
  • Table 19: North America Market Value (USD Million) Forecast by Sales Channel, 2020-2035
  • Table 20: North America Market Volume (Units) Forecast by Sales Channel, 2020-2035
  • Table 21: Latin America Market Value (USD Million) Forecast by Country, 2020-2035
  • Table 22: Latin America Market Volume (Units) Forecast by Country, 2020-2035
  • Table 23: Latin America Market Value (USD Million) Forecast by Source, 2020-2035
  • Table 24: Latin America Market Volume (Units) Forecast by Source, 2020-2035
  • Table 25: Latin America Market Value (USD Million) Forecast by Application, 2020-2035
  • Table 26: Latin America Market Volume (Units) Forecast by Application, 2020-2035
  • Table 27: Latin America Market Value (USD Million) Forecast by Product Format, 2020-2035
  • Table 28: Latin America Market Volume (Units) Forecast by Product Format, 2020-2035
  • Table 29: Latin America Market Value (USD Million) Forecast by Sales Channel, 2020-2035
  • Table 30: Latin America Market Volume (Units) Forecast by Sales Channel, 2020-2035
  • Table 31: Europe Market Value (USD Million) Forecast by Country, 2020-2035
  • Table 32: Europe Market Volume (Units) Forecast by Country, 2020-2035
  • Table 33: Europe Market Value (USD Million) Forecast by Source, 2020-2035
  • Table 34: Europe Market Volume (Units) Forecast by Source, 2020-2035
  • Table 35: Europe Market Value (USD Million) Forecast by Application, 2020-2035
  • Table 36: Europe Market Volume (Units) Forecast by Application, 2020-2035
  • Table 37: Europe Market Value (USD Million) Forecast by Product Format, 2020-2035
  • Table 38: Europe Market Volume (Units) Forecast by Product Format, 2020-2035
  • Table 39: Europe Market Value (USD Million) Forecast by Sales Channel, 2020-2035
  • Table 40: Europe Market Volume (Units) Forecast by Sales Channel, 2020-2035
  • Table 41: East Asia Market Value (USD Million) Forecast by Country, 2020-2035
  • Table 42: East Asia Market Volume (Units) Forecast by Country, 2020-2035
  • Table 43: East Asia Market Value (USD Million) Forecast by Source, 2020-2035
  • Table 44: East Asia Market Volume (Units) Forecast by Source, 2020-2035
  • Table 45: East Asia Market Value (USD Million) Forecast by Application, 2020-2035
  • Table 46: East Asia Market Volume (Units) Forecast by Application, 2020-2035
  • Table 47: East Asia Market Value (USD Million) Forecast by Product Format, 2020-2035
  • Table 48: East Asia Market Volume (Units) Forecast by Product Format, 2020-2035
  • Table 49: East Asia Market Value (USD Million) Forecast by Sales Channel, 2020-2035
  • Table 50: East Asia Market Volume (Units) Forecast by Sales Channel, 2020-2035
  • Table 51: South Asia & Pacific Market Value (USD Million) Forecast by Country, 2020-2035
  • Table 52: South Asia & Pacific Market Volume (Units) Forecast by Country, 2020-2035
  • Table 53: South Asia & Pacific Market Value (USD Million) Forecast by Source, 2020-2035
  • Table 54: South Asia & Pacific Market Volume (Units) Forecast by Source, 2020-2035
  • Table 55: South Asia & Pacific Market Value (USD Million) Forecast by Application, 2020-2035
  • Table 56: South Asia & Pacific Market Volume (Units) Forecast by Application, 2020-2035
  • Table 57: South Asia & Pacific Market Value (USD Million) Forecast by Product Format, 2020-2035
  • Table 58: South Asia & Pacific Market Volume (Units) Forecast by Product Format, 2020-2035
  • Table 59: South Asia & Pacific Market Value (USD Million) Forecast by Sales Channel, 2020-2035
  • Table 60: South Asia & Pacific Market Volume (Units) Forecast by Sales Channel, 2020-2035
  • Table 61: MEA Market Value (USD Million) Forecast by Country, 2020-2035
  • Table 62: MEA Market Volume (Units) Forecast by Country, 2020-2035
  • Table 63: MEA Market Value (USD Million) Forecast by Source, 2020-2035
  • Table 64: MEA Market Volume (Units) Forecast by Source, 2020-2035
  • Table 65: MEA Market Value (USD Million) Forecast by Application, 2020-2035
  • Table 66: MEA Market Volume (Units) Forecast by Application, 2020-2035
  • Table 67: MEA Market Value (USD Million) Forecast by Product Format, 2020-2035
  • Table 68: MEA Market Volume (Units) Forecast by Product Format, 2020-2035
  • Table 69: MEA Market Value (USD Million) Forecast by Sales Channel, 2020-2035
  • Table 70: MEA Market Volume (Units) Forecast by Sales Channel, 2020-2035

List of Figures

  • Figure 1: Global Market Value (USD Million) by Source, 2025-2035
  • Figure 2: Global Market Value (USD Million) by Application, 2025-2035
  • Figure 3: Global Market Value (USD Million) by Product Format, 2025-2035
  • Figure 4: Global Market Value (USD Million) by Sales Channel, 2025-2035
  • Figure 5: Global Market Value (USD Million) by Region, 2025-2035
  • Figure 6: Global Market Value (USD Million) Analysis by Region, 2020-2035
  • Figure 7: Global Market Volume (Units) Analysis by Region, 2020-2035
  • Figure 8: Global Market Value Share (%) and BPS Analysis by Region, 2025-2035
  • Figure 9: Global Market Y-o-Y Growth (%) Projections by Region, 2025-2035
  • Figure 10: Global Market Value (USD Million) Analysis by Source, 2020-2035
  • Figure 11: Global Market Volume (Units) Analysis by Source, 2020-2035
  • Figure 12: Global Market Value Share (%) and BPS Analysis by Source, 2025-2035
  • Figure 13: Global Market Y-o-Y Growth (%) Projections by Source, 2025-2035
  • Figure 14: Global Market Value (USD Million) Analysis by Application, 2020-2035
  • Figure 15: Global Market Volume (Units) Analysis by Application, 2020-2035
  • Figure 16: Global Market Value Share (%) and BPS Analysis by Application, 2025-2035
  • Figure 17: Global Market Y-o-Y Growth (%) Projections by Application, 2025-2035
  • Figure 18: Global Market Value (USD Million) Analysis by Product Format, 2020-2035
  • Figure 19: Global Market Volume (Units) Analysis by Product Format, 2020-2035
  • Figure 20: Global Market Value Share (%) and BPS Analysis by Product Format, 2025-2035
  • Figure 21: Global Market Y-o-Y Growth (%) Projections by Product Format, 2025-2035
  • Figure 22: Global Market Value (USD Million) Analysis by Sales Channel, 2020-2035
  • Figure 23: Global Market Volume (Units) Analysis by Sales Channel, 2020-2035
  • Figure 24: Global Market Value Share (%) and BPS Analysis by Sales Channel, 2025-2035
  • Figure 25: Global Market Y-o-Y Growth (%) Projections by Sales Channel, 2025-2035
  • Figure 26: Global Market Attractiveness by Source, 2025-2035
  • Figure 27: Global Market Attractiveness by Application, 2025-2035
  • Figure 28: Global Market Attractiveness by Product Format, 2025-2035
  • Figure 29: Global Market Attractiveness by Sales Channel, 2025-2035
  • Figure 30: Global Market Attractiveness by Region, 2025-2035
  • Figure 31: North America Market Value (USD Million) by Source, 2025-2035
  • Figure 32: North America Market Value (USD Million) by Application, 2025-2035
  • Figure 33: North America Market Value (USD Million) by Product Format, 2025-2035
  • Figure 34: North America Market Value (USD Million) by Sales Channel, 2025-2035
  • Figure 35: North America Market Value (USD Million) by Country, 2025-2035
  • Figure 36: North America Market Value (USD Million) Analysis by Country, 2020-2035
  • Figure 37: North America Market Volume (Units) Analysis by Country, 2020-2035
  • Figure 38: North America Market Value Share (%) and BPS Analysis by Country, 2025-2035
  • Figure 39: North America Market Y-o-Y Growth (%) Projections by Country, 2025-2035
  • Figure 40: North America Market Value (USD Million) Analysis by Source, 2020-2035
  • Figure 41: North America Market Volume (Units) Analysis by Source, 2020-2035
  • Figure 42: North America Market Value Share (%) and BPS Analysis by Source, 2025-2035
  • Figure 43: North America Market Y-o-Y Growth (%) Projections by Source, 2025-2035
  • Figure 44: North America Market Value (USD Million) Analysis by Application, 2020-2035
  • Figure 45: North America Market Volume (Units) Analysis by Application, 2020-2035
  • Figure 46: North America Market Value Share (%) and BPS Analysis by Application, 2025-2035
  • Figure 47: North America Market Y-o-Y Growth (%) Projections by Application, 2025-2035
  • Figure 48: North America Market Value (USD Million) Analysis by Product Format, 2020-2035
  • Figure 49: North America Market Volume (Units) Analysis by Product Format, 2020-2035
  • Figure 50: North America Market Value Share (%) and BPS Analysis by Product Format, 2025-2035
  • Figure 51: North America Market Y-o-Y Growth (%) Projections by Product Format, 2025-2035
  • Figure 52: North America Market Value (USD Million) Analysis by Sales Channel, 2020-2035
  • Figure 53: North America Market Volume (Units) Analysis by Sales Channel, 2020-2035
  • Figure 54: North America Market Value Share (%) and BPS Analysis by Sales Channel, 2025-2035
  • Figure 55: North America Market Y-o-Y Growth (%) Projections by Sales Channel, 2025-2035
  • Figure 56: North America Market Attractiveness by Source, 2025-2035
  • Figure 57: North America Market Attractiveness by Application, 2025-2035
  • Figure 58: North America Market Attractiveness by Product Format, 2025-2035
  • Figure 59: North America Market Attractiveness by Sales Channel, 2025-2035
  • Figure 60: North America Market Attractiveness by Country, 2025-2035
  • Figure 61: Latin America Market Value (USD Million) by Source, 2025-2035
  • Figure 62: Latin America Market Value (USD Million) by Application, 2025-2035
  • Figure 63: Latin America Market Value (USD Million) by Product Format, 2025-2035
  • Figure 64: Latin America Market Value (USD Million) by Sales Channel, 2025-2035
  • Figure 65: Latin America Market Value (USD Million) by Country, 2025-2035
  • Figure 66: Latin America Market Value (USD Million) Analysis by Country, 2020-2035
  • Figure 67: Latin America Market Volume (Units) Analysis by Country, 2020-2035
  • Figure 68: Latin America Market Value Share (%) and BPS Analysis by Country, 2025-2035
  • Figure 69: Latin America Market Y-o-Y Growth (%) Projections by Country, 2025-2035
  • Figure 70: Latin America Market Value (USD Million) Analysis by Source, 2020-2035
  • Figure 71: Latin America Market Volume (Units) Analysis by Source, 2020-2035
  • Figure 72: Latin America Market Value Share (%) and BPS Analysis by Source, 2025-2035
  • Figure 73: Latin America Market Y-o-Y Growth (%) Projections by Source, 2025-2035
  • Figure 74: Latin America Market Value (USD Million) Analysis by Application, 2020-2035
  • Figure 75: Latin America Market Volume (Units) Analysis by Application, 2020-2035
  • Figure 76: Latin America Market Value Share (%) and BPS Analysis by Application, 2025-2035
  • Figure 77: Latin America Market Y-o-Y Growth (%) Projections by Application, 2025-2035
  • Figure 78: Latin America Market Value (USD Million) Analysis by Product Format, 2020-2035
  • Figure 79: Latin America Market Volume (Units) Analysis by Product Format, 2020-2035
  • Figure 80: Latin America Market Value Share (%) and BPS Analysis by Product Format, 2025-2035
  • Figure 81: Latin America Market Y-o-Y Growth (%) Projections by Product Format, 2025-2035
  • Figure 82: Latin America Market Value (USD Million) Analysis by Sales Channel, 2020-2035
  • Figure 83: Latin America Market Volume (Units) Analysis by Sales Channel, 2020-2035
  • Figure 84: Latin America Market Value Share (%) and BPS Analysis by Sales Channel, 2025-2035
  • Figure 85: Latin America Market Y-o-Y Growth (%) Projections by Sales Channel, 2025-2035
  • Figure 86: Latin America Market Attractiveness by Source, 2025-2035
  • Figure 87: Latin America Market Attractiveness by Application, 2025-2035
  • Figure 88: Latin America Market Attractiveness by Product Format, 2025-2035
  • Figure 89: Latin America Market Attractiveness by Sales Channel, 2025-2035
  • Figure 90: Latin America Market Attractiveness by Country, 2025-2035
  • Figure 91: Europe Market Value (USD Million) by Source, 2025-2035
  • Figure 92: Europe Market Value (USD Million) by Application, 2025-2035
  • Figure 93: Europe Market Value (USD Million) by Product Format, 2025-2035
  • Figure 94: Europe Market Value (USD Million) by Sales Channel, 2025-2035
  • Figure 95: Europe Market Value (USD Million) by Country, 2025-2035
  • Figure 96: Europe Market Value (USD Million) Analysis by Country, 2020-2035
  • Figure 97: Europe Market Volume (Units) Analysis by Country, 2020-2035
  • Figure 98: Europe Market Value Share (%) and BPS Analysis by Country, 2025-2035
  • Figure 99: Europe Market Y-o-Y Growth (%) Projections by Country, 2025-2035
  • Figure 100: Europe Market Value (USD Million) Analysis by Source, 2020-2035
  • Figure 101: Europe Market Volume (Units) Analysis by Source, 2020-2035
  • Figure 102: Europe Market Value Share (%) and BPS Analysis by Source, 2025-2035
  • Figure 103: Europe Market Y-o-Y Growth (%) Projections by Source, 2025-2035
  • Figure 104: Europe Market Value (USD Million) Analysis by Application, 2020-2035
  • Figure 105: Europe Market Volume (Units) Analysis by Application, 2020-2035
  • Figure 106: Europe Market Value Share (%) and BPS Analysis by Application, 2025-2035
  • Figure 107: Europe Market Y-o-Y Growth (%) Projections by Application, 2025-2035
  • Figure 108: Europe Market Value (USD Million) Analysis by Product Format, 2020-2035
  • Figure 109: Europe Market Volume (Units) Analysis by Product Format, 2020-2035
  • Figure 110: Europe Market Value Share (%) and BPS Analysis by Product Format, 2025-2035
  • Figure 111: Europe Market Y-o-Y Growth (%) Projections by Product Format, 2025-2035
  • Figure 112: Europe Market Value (USD Million) Analysis by Sales Channel, 2020-2035
  • Figure 113: Europe Market Volume (Units) Analysis by Sales Channel, 2020-2035
  • Figure 114: Europe Market Value Share (%) and BPS Analysis by Sales Channel, 2025-2035
  • Figure 115: Europe Market Y-o-Y Growth (%) Projections by Sales Channel, 2025-2035
  • Figure 116: Europe Market Attractiveness by Source, 2025-2035
  • Figure 117: Europe Market Attractiveness by Application, 2025-2035
  • Figure 118: Europe Market Attractiveness by Product Format, 2025-2035
  • Figure 119: Europe Market Attractiveness by Sales Channel, 2025-2035
  • Figure 120: Europe Market Attractiveness by Country, 2025-2035
  • Figure 121: East Asia Market Value (USD Million) by Source, 2025-2035
  • Figure 122: East Asia Market Value (USD Million) by Application, 2025-2035
  • Figure 123: East Asia Market Value (USD Million) by Product Format, 2025-2035
  • Figure 124: East Asia Market Value (USD Million) by Sales Channel, 2025-2035
  • Figure 125: East Asia Market Value (USD Million) by Country, 2025-2035
  • Figure 126: East Asia Market Value (USD Million) Analysis by Country, 2020-2035
  • Figure 127: East Asia Market Volume (Units) Analysis by Country, 2020-2035
  • Figure 128: East Asia Market Value Share (%) and BPS Analysis by Country, 2025-2035
  • Figure 129: East Asia Market Y-o-Y Growth (%) Projections by Country, 2025-2035
  • Figure 130: East Asia Market Value (USD Million) Analysis by Source, 2020-2035
  • Figure 131: East Asia Market Volume (Units) Analysis by Source, 2020-2035
  • Figure 132: East Asia Market Value Share (%) and BPS Analysis by Source, 2025-2035
  • Figure 133: East Asia Market Y-o-Y Growth (%) Projections by Source, 2025-2035
  • Figure 134: East Asia Market Value (USD Million) Analysis by Application, 2020-2035
  • Figure 135: East Asia Market Volume (Units) Analysis by Application, 2020-2035
  • Figure 136: East Asia Market Value Share (%) and BPS Analysis by Application, 2025-2035
  • Figure 137: East Asia Market Y-o-Y Growth (%) Projections by Application, 2025-2035
  • Figure 138: East Asia Market Value (USD Million) Analysis by Product Format, 2020-2035
  • Figure 139: East Asia Market Volume (Units) Analysis by Product Format, 2020-2035
  • Figure 140: East Asia Market Value Share (%) and BPS Analysis by Product Format, 2025-2035
  • Figure 141: East Asia Market Y-o-Y Growth (%) Projections by Product Format, 2025-2035
  • Figure 142: East Asia Market Value (USD Million) Analysis by Sales Channel, 2020-2035
  • Figure 143: East Asia Market Volume (Units) Analysis by Sales Channel, 2020-2035
  • Figure 144: East Asia Market Value Share (%) and BPS Analysis by Sales Channel, 2025-2035
  • Figure 145: East Asia Market Y-o-Y Growth (%) Projections by Sales Channel, 2025-2035
  • Figure 146: East Asia Market Attractiveness by Source, 2025-2035
  • Figure 147: East Asia Market Attractiveness by Application, 2025-2035
  • Figure 148: East Asia Market Attractiveness by Product Format, 2025-2035
  • Figure 149: East Asia Market Attractiveness by Sales Channel, 2025-2035
  • Figure 150: East Asia Market Attractiveness by Country, 2025-2035
  • Figure 151: South Asia & Pacific Market Value (USD Million) by Source, 2025-2035
  • Figure 152: South Asia & Pacific Market Value (USD Million) by Application, 2025-2035
  • Figure 153: South Asia & Pacific Market Value (USD Million) by Product Format, 2025-2035
  • Figure 154: South Asia & Pacific Market Value (USD Million) by Sales Channel, 2025-2035
  • Figure 155: South Asia & Pacific Market Value (USD Million) by Country, 2025-2035
  • Figure 156: South Asia & Pacific Market Value (USD Million) Analysis by Country, 2020-2035
  • Figure 157: South Asia & Pacific Market Volume (Units) Analysis by Country, 2020-2035
  • Figure 158: South Asia & Pacific Market Value Share (%) and BPS Analysis by Country, 2025-2035
  • Figure 159: South Asia & Pacific Market Y-o-Y Growth (%) Projections by Country, 2025-2035
  • Figure 160: South Asia & Pacific Market Value (USD Million) Analysis by Source, 2020-2035
  • Figure 161: South Asia & Pacific Market Volume (Units) Analysis by Source, 2020-2035
  • Figure 162: South Asia & Pacific Market Value Share (%) and BPS Analysis by Source, 2025-2035
  • Figure 163: South Asia & Pacific Market Y-o-Y Growth (%) Projections by Source, 2025-2035
  • Figure 164: South Asia & Pacific Market Value (USD Million) Analysis by Application, 2020-2035
  • Figure 165: South Asia & Pacific Market Volume (Units) Analysis by Application, 2020-2035
  • Figure 166: South Asia & Pacific Market Value Share (%) and BPS Analysis by Application, 2025-2035
  • Figure 167: South Asia & Pacific Market Y-o-Y Growth (%) Projections by Application, 2025-2035
  • Figure 168: South Asia & Pacific Market Value (USD Million) Analysis by Product Format, 2020-2035
  • Figure 169: South Asia & Pacific Market Volume (Units) Analysis by Product Format, 2020-2035
  • Figure 170: South Asia & Pacific Market Value Share (%) and BPS Analysis by Product Format, 2025-2035
  • Figure 171: South Asia & Pacific Market Y-o-Y Growth (%) Projections by Product Format, 2025-2035
  • Figure 172: South Asia & Pacific Market Value (USD Million) Analysis by Sales Channel, 2020-2035
  • Figure 173: South Asia & Pacific Market Volume (Units) Analysis by Sales Channel, 2020-2035
  • Figure 174: South Asia & Pacific Market Value Share (%) and BPS Analysis by Sales Channel, 2025-2035
  • Figure 175: South Asia & Pacific Market Y-o-Y Growth (%) Projections by Sales Channel, 2025-2035
  • Figure 176: South Asia & Pacific Market Attractiveness by Source, 2025-2035
  • Figure 177: South Asia & Pacific Market Attractiveness by Application, 2025-2035
  • Figure 178: South Asia & Pacific Market Attractiveness by Product Format, 2025-2035
  • Figure 179: South Asia & Pacific Market Attractiveness by Sales Channel, 2025-2035
  • Figure 180: South Asia & Pacific Market Attractiveness by Country, 2025-2035
  • Figure 181: MEA Market Value (USD Million) by Source, 2025-2035
  • Figure 182: MEA Market Value (USD Million) by Application, 2025-2035
  • Figure 183: MEA Market Value (USD Million) by Product Format, 2025-2035
  • Figure 184: MEA Market Value (USD Million) by Sales Channel, 2025-2035
  • Figure 185: MEA Market Value (USD Million) by Country, 2025-2035
  • Figure 186: MEA Market Value (USD Million) Analysis by Country, 2020-2035
  • Figure 187: MEA Market Volume (Units) Analysis by Country, 2020-2035
  • Figure 188: MEA Market Value Share (%) and BPS Analysis by Country, 2025-2035
  • Figure 189: MEA Market Y-o-Y Growth (%) Projections by Country, 2025-2035
  • Figure 190: MEA Market Value (USD Million) Analysis by Source, 2020-2035
  • Figure 191: MEA Market Volume (Units) Analysis by Source, 2020-2035
  • Figure 192: MEA Market Value Share (%) and BPS Analysis by Source, 2025-2035
  • Figure 193: MEA Market Y-o-Y Growth (%) Projections by Source, 2025-2035
  • Figure 194: MEA Market Value (USD Million) Analysis by Application, 2020-2035
  • Figure 195: MEA Market Volume (Units) Analysis by Application, 2020-2035
  • Figure 196: MEA Market Value Share (%) and BPS Analysis by Application, 2025-2035
  • Figure 197: MEA Market Y-o-Y Growth (%) Projections by Application, 2025-2035
  • Figure 198: MEA Market Value (USD Million) Analysis by Product Format, 2020-2035
  • Figure 199: MEA Market Volume (Units) Analysis by Product Format, 2020-2035
  • Figure 200: MEA Market Value Share (%) and BPS Analysis by Product Format, 2025-2035
  • Figure 201: MEA Market Y-o-Y Growth (%) Projections by Product Format, 2025-2035
  • Figure 202: MEA Market Value (USD Million) Analysis by Sales Channel, 2020-2035
  • Figure 203: MEA Market Volume (Units) Analysis by Sales Channel, 2020-2035
  • Figure 204: MEA Market Value Share (%) and BPS Analysis by Sales Channel, 2025-2035
  • Figure 205: MEA Market Y-o-Y Growth (%) Projections by Sales Channel, 2025-2035
  • Figure 206: MEA Market Attractiveness by Source, 2025-2035
  • Figure 207: MEA Market Attractiveness by Application, 2025-2035
  • Figure 208: MEA Market Attractiveness by Product Format, 2025-2035
  • Figure 209: MEA Market Attractiveness by Sales Channel, 2025-2035
  • Figure 210: MEA Market Attractiveness by Country, 2025-2035

Frequently Asked Questions

How big is the PDRN Supplements Market in 2025?

The global PDRN Supplements Market is estimated to be valued at USD 897.8 million in 2025, driven by rising demand for regenerative and anti-aging solutions in both clinical and consumer segments.

What will be the size of the PDRN Supplements Market in 2035?

The market size for the PDRN Supplements Market is projected to reach approximately USD 1,580.0 million by 2035, reflecting expanding applications in therapeutic nutrition, joint recovery, and skin health.

How much will the PDRN Supplements Market grow between 2025 and 2035?

The PDRN Supplements Market is expected to grow at a compound annual growth rate (CAGR) of 5.8% between 2025 and 2035, registering a near 1.8X expansion in total market value.

What are the key product types in the PDRN Supplements Market?

The key product types in the PDRN Supplements Market include Capsules, Tablets, Liquid Ampoules/Oral Solutions, Functional Drinks, and Topical-Oral Combination Packs, each tailored to specific health and aesthetic outcomes.

Which product format segment will contribute a significant share to the PDRN Supplements Market in 2025?

In terms of format, Capsules are expected to command the highest share at 30% in 2025, followed closely by Liquid Ampoules, reflecting consumer preference for convenient and high-bioavailability delivery systems.

Explore Similar Insights

Future Market Insights

PDRN Supplements Market