Carnitine Supplements Market Size and Share Forecast Outlook 2025 to 2035

The Carnitine Supplements Market is estimated to be valued at USD 322.4 million in 2025 and is projected to reach USD 566.5 million by 2035, registering a compound annual growth rate (CAGR) of 5.8% over the forecast period.
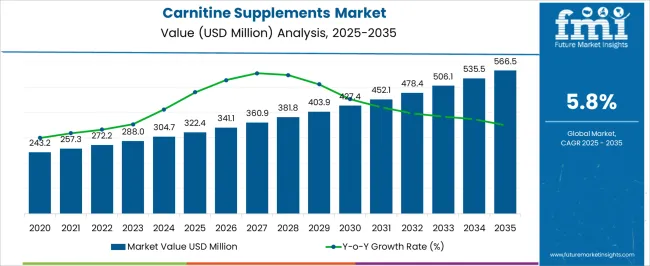
Quick Stats for Carnitine Supplements Market

  • Carnitine Supplements Market Value (2025): USD 322.4 million
  • Carnitine Supplements Market Forecast Value (2035): USD 566.5 million
  • Carnitine Supplements Market Forecast CAGR: 5.8%
  • Leading Segment in Carnitine Supplements Market in 2025: Carnitine Supplement Capsules (45.0%)
  • Key Growth Regions in Carnitine Supplements Market: North America, Asia-Pacific, Europe
  • Top Key Players in Carnitine Supplements Market: Lonza Group Ltd., Northeast Pharmaceutical Group Co., Ltd., Ceva Santé Animale S.A., Kaiyuan Hengtai Chemical Co., Ltd., ChengDa Pharmaceuticals Co., Ltd., Merck KGaA, Biosint S.p.A, Tokyo Chemical Industry Co., Ltd.

Carnitine Supplements Market Market Value Analysis

Carnitine Supplements Market Key Takeaways

Metric Value
Carnitine Supplements Market Estimated Value in (2025 E) USD 322.4 million
Carnitine Supplements Market Forecast Value in (2035 F) USD 566.5 million
Forecast CAGR (2025 to 2035) 5.8%

Why is the Carnitine Supplements Market Growing?

The Carnitine Supplements market is experiencing steady growth driven by the increasing adoption of sports nutrition and wellness products among health-conscious consumers. Rising awareness of fitness and weight management, combined with a growing interest in energy metabolism and muscle recovery, has elevated demand for carnitine supplements globally.

The market is influenced by trends in personalized nutrition and the expanding use of dietary supplements for performance enhancement and overall well-being. Investments in research and development of new formulations and flavors are enabling manufacturers to cater to diverse consumer preferences, thereby improving product accessibility and appeal.

Additionally, the aging population and increasing prevalence of lifestyle-related metabolic disorders are contributing to sustained market growth The continued focus on convenient dosage forms, innovative flavors, and scientifically validated efficacy is anticipated to drive adoption further, creating opportunities for new product launches and brand differentiation in both developed and emerging markets.

Segmental Analysis

The carnitine supplements market is segmented by form, end use, flavor, distribution channel, and geographic regions. By form, carnitine supplements market is divided into Carnitine Supplement Capsules, Powdered, Liquid, and Other Forms. In terms of end use, carnitine supplements market is classified into Sports Nutrition, Pharmaceuticals, and Other End Uses. Based on flavor, carnitine supplements market is segmented into Blue Raspberry-Flavored, Pineapple-Flavored, Tropical Mango-Flavored, Cherry Popsicle-Flavored, Berry-Flavored, and Other-Flavored. By distribution channel, carnitine supplements market is segmented into Pharmacies And Drug Stores, Health & Beauty Stores, Hypermarkets/Supermarkets, Online Retailing, and Direct Selling. Regionally, the carnitine supplements industry is classified into North America, Latin America, Western Europe, Eastern Europe, Balkan & Baltic Countries, Russia & Belarus, Central Asia, East Asia, South Asia & Pacific, and the Middle East & Africa.
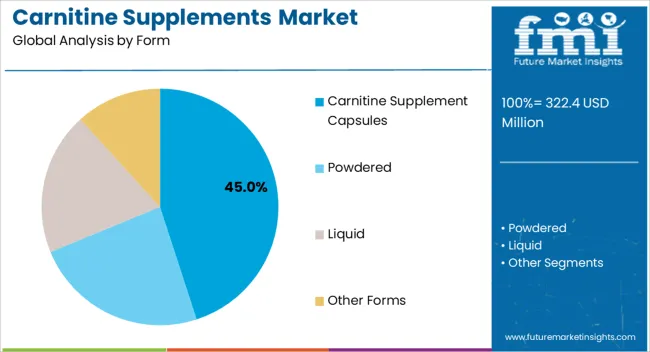
Insights into the Carnitine Supplement Capsules Segment

Carnitine Supplements Market Analysis By Form

The Carnitine Supplement Capsules segment is projected to hold 45.00% of the market revenue share in 2025, making it the leading form in the market. This dominance is being attributed to the convenience, portability, and precise dosing offered by capsules, which support consumer adherence to daily supplementation regimens.

Capsules are preferred due to their ease of ingestion and compatibility with other health supplements, allowing integration into multi-supplement routines. Additionally, capsules provide enhanced stability and shelf life compared to other forms, ensuring consistent potency and efficacy.

The popularity of capsules has also been reinforced by consumer perception of higher quality and reliability in delivering targeted carnitine benefits for energy metabolism, fat oxidation, and muscle recovery As manufacturers continue to optimize formulations for enhanced absorption and bioavailability, the capsule segment is expected to maintain its leadership, benefiting from consumer preference for convenient and effective supplementation solutions.
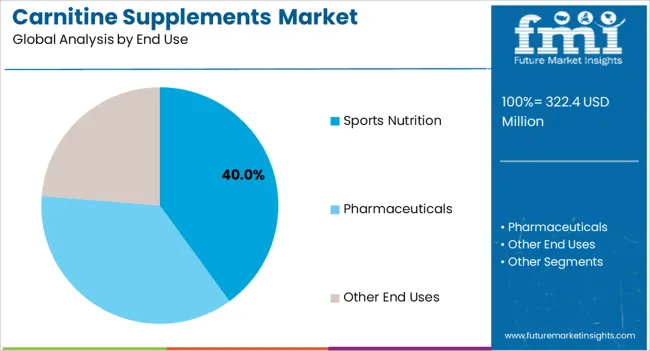
Insights into the Sports Nutrition End Use Segment

Carnitine Supplements Market Analysis By End Use

The Sports Nutrition end-use segment is estimated to capture 40.00% of the Carnitine Supplements market revenue in 2025, positioning it as the dominant application. This segment has grown due to the increasing demand for performance-enhancing supplements among athletes, fitness enthusiasts, and active lifestyle consumers.

Carnitine supplementation is recognized for supporting energy production, improving exercise endurance, and aiding post-workout recovery, making it a critical component in sports nutrition formulations. The growth is also being driven by the rising adoption of structured training programs, gym memberships, and athletic performance tracking, which highlight the importance of nutritional supplementation for measurable outcomes.

Furthermore, convenient dosing options and targeted formulations have made carnitine supplements highly suitable for integration into sports nutrition regimens As consumer focus on health, fitness, and performance continues to rise, the Sports Nutrition segment is expected to remain the largest end-use category, providing consistent opportunities for innovation and market expansion.
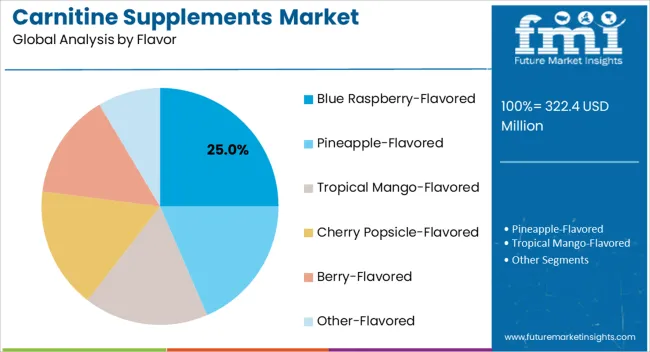
Insights into the Blue Raspberry-Flavored Segment

Carnitine Supplements Market Analysis By Flavor

The Blue Raspberry-Flavored segment is expected to account for 25.00% of the market revenue in 2025, making it the leading flavor preference among consumers. This preference is being driven by the growing demand for palatable and enjoyable supplement options that enhance adherence and user experience.

Flavor innovation in dietary supplements has become a key differentiator, with consumers seeking products that combine efficacy with pleasant taste. Blue Raspberry flavor has been favored for its refreshing and familiar taste profile, which appeals particularly to younger demographics and sports nutrition consumers.

The segment’s growth has also been supported by increasing product availability across retail, e-commerce, and specialty nutrition channels Continued focus on flavor enhancement, combined with functional benefits of carnitine, is expected to strengthen consumer preference for Blue Raspberry and similar appealing flavors, driving innovation in formulation and supporting market growth in the coming years.

Market Overview

Carnitine Supplements Market Outlook from (2025 to 2035)

Mammals use the amino acid carnitine to help turn fatty acids into energy. Carnitine-rich supplements are frequently used for weight loss since they boost metabolism, accelerate fat burning, and provide users energy. Customers are encouraged to use carnitine as an infant, anti-aging, and sports nutrition supplement because of the quality of the supplement.

The demand for carnitine supplements is dramatically rising as obesity and overweight excess weight gain are becoming more common in most established and emerging economies. "Obesity has reached epidemic proportions globally, with at least 2.8 million people dying each year as a result of being overweight or obese," said a World Health Organization (WHO) report published in June 2025. Obesity is currently more common in low- and middle-income countries than it used to be in high-income ones.

In our new study, ESOMAR-certified market research and consulting firm Future Market Insights (FMI) offers insights into key factors driving demand for Carnitine Supplements.
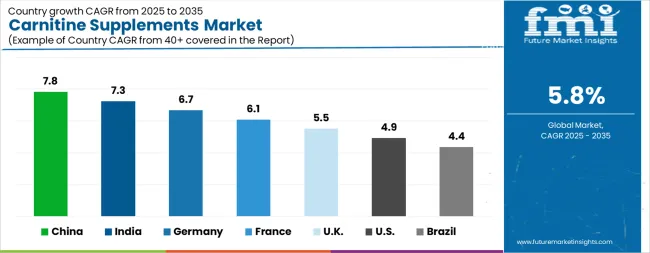
Analysis of Carnitine Supplements Market By Key Countries

Carnitine Supplements Market Cagr Analysis By Country

Country CAGR
China 7.8%
India 7.3%
Germany 6.7%
France 6.1%
UK 5.5%
USA 4.9%
Brazil 4.4%

Country-wise Analysis

The Carnitine Supplements Market is expected to register a CAGR of 5.8% during the forecast period, exhibiting varied country level momentum. China leads with the highest CAGR of 7.8%, followed by India at 7.3%. Developed markets such as Germany, France, and the UK continue to expand steadily, while the USA is likely to grow at consistent rates. Brazil posts the lowest CAGR at 4.4%, yet still underscores a broadly positive trajectory for the global Carnitine Supplements Market. In 2024, Germany held a dominant revenue in the Western Europe market and is expected to grow with a CAGR of 6.7%. The USA Carnitine Supplements Market is estimated to be valued at USD 118.1 million in 2025 and is anticipated to reach a valuation of USD 191.0 million by 2035. Sales are projected to rise at a CAGR of 4.9% over the forecast period between 2025 and 2035. While Japan and South Korea markets are estimated to be valued at USD 17.4 million and USD 10.5 million respectively in 2025.
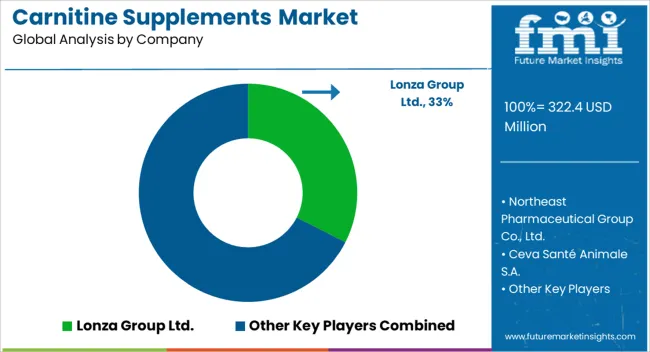
Key Players in the Carnitine Supplements Market

Carnitine Supplements Market Analysis By Company

  • Lonza Group Ltd.
  • Northeast Pharmaceutical Group Co., Ltd.
  • Ceva Santé Animale S.A.
  • Kaiyuan Hengtai Chemical Co., Ltd.
  • ChengDa Pharmaceuticals Co., Ltd.
  • Merck KGaA
  • Biosint S.p.A
  • Tokyo Chemical Industry Co., Ltd.

Scope of the Report

Item Value
Quantitative Units USD 322.4 Million
Form Carnitine Supplement Capsules, Powdered, Liquid, and Other Forms
End Use Sports Nutrition, Pharmaceuticals, and Other End Uses
Flavor Blue Raspberry-Flavored, Pineapple-Flavored, Tropical Mango-Flavored, Cherry Popsicle-Flavored, Berry-Flavored, and Other-Flavored
Distribution Channel Pharmacies And Drug Stores, Health & Beauty Stores, Hypermarkets/Supermarkets, Online Retailing, and Direct Selling
Regions Covered North America, Europe, Asia-Pacific, Latin America, Middle East & Africa
Country Covered United States, Canada, Germany, France, United Kingdom, China, Japan, India, Brazil, South Africa
Key Companies Profiled Lonza Group Ltd., Northeast Pharmaceutical Group Co., Ltd., Ceva Santé Animale S.A., Kaiyuan Hengtai Chemical Co., Ltd., ChengDa Pharmaceuticals Co., Ltd., Merck KGaA, Biosint S.p.A, and Tokyo Chemical Industry Co., Ltd.

Carnitine Supplements Market by Segments

Form:

  • Carnitine Supplement Capsules
  • Powdered
  • Liquid
  • Other Forms

End Use:

  • Sports Nutrition
  • Pharmaceuticals
  • Other End Uses

Flavor:

  • Blue Raspberry-Flavored
  • Pineapple-Flavored
  • Tropical Mango-Flavored
  • Cherry Popsicle-Flavored
  • Berry-Flavored
  • Other-Flavored

Distribution Channel:

  • Pharmacies And Drug Stores
  • Health & Beauty Stores
  • Hypermarkets/Supermarkets
  • Online Retailing
  • Direct Selling

Region:

  • North America
    • USA
    • Canada
    • Mexico
  • Latin America
    • Brazil
    • Chile
    • Rest of Latin America
  • Western Europe
    • Germany
    • UK
    • Italy
    • Spain
    • France
    • Nordic
    • BENELUX
    • Rest of Western Europe
  • Eastern Europe
    • Russia
    • Poland
    • Hungary
    • Balkan & Baltic
    • Rest of Eastern Europe
  • East Asia
    • China
    • Japan
    • South Korea
  • South Asia and Pacific
    • India
    • ASEAN
    • Australia & New Zealand
    • Rest of South Asia and Pacific
  • Middle East & Africa
    • Kingdom of Saudi Arabia
    • Other GCC Countries
    • Turkiye
    • South Africa
    • Other African Union
    • Rest of Middle East & Africa

Table of Content

  1. Executive Summary
    • Global Market Outlook
    • Demand-side Trends
    • Supply-side Trends
    • Technology Roadmap Analysis
    • Analysis and Recommendations
  2. Market Overview
    • Market Coverage / Taxonomy
    • Market Definition / Scope / Limitations
  3. Market Background
    • Market Dynamics
      • Drivers
      • Restraints
      • Opportunity
      • Trends
    • Scenario Forecast
      • Demand in Optimistic Scenario
      • Demand in Likely Scenario
      • Demand in Conservative Scenario
    • Opportunity Map Analysis
    • Product Life Cycle Analysis
    • Supply Chain Analysis
    • Investment Feasibility Matrix
    • Value Chain Analysis
    • PESTLE and Porter’s Analysis
    • Regulatory Landscape
    • Regional Parent Market Outlook
    • Production and Consumption Statistics
    • Import and Export Statistics
  4. Global Market Analysis 2020 to 2024 and Forecast, 2025 to 2035
    • Historical Market Size Value (USD Million) Analysis, 2020 to 2024
    • Current and Future Market Size Value (USD Million) Projections, 2025 to 2035
      • Y-o-Y Growth Trend Analysis
      • Absolute $ Opportunity Analysis
  5. Global Market Pricing Analysis 2020 to 2024 and Forecast 2025 to 2035
  6. Global Market Analysis 2020 to 2024 and Forecast 2025 to 2035, By Form
    • Introduction / Key Findings
    • Historical Market Size Value (USD Million) Analysis By Form , 2020 to 2024
    • Current and Future Market Size Value (USD Million) Analysis and Forecast By Form , 2025 to 2035
      • Carnitine Supplement Capsules
      • Powdered
      • Liquid
      • Other Forms
    • Y-o-Y Growth Trend Analysis By Form , 2020 to 2024
    • Absolute $ Opportunity Analysis By Form , 2025 to 2035
  7. Global Market Analysis 2020 to 2024 and Forecast 2025 to 2035, By End Use
    • Introduction / Key Findings
    • Historical Market Size Value (USD Million) Analysis By End Use, 2020 to 2024
    • Current and Future Market Size Value (USD Million) Analysis and Forecast By End Use, 2025 to 2035
      • Sports Nutrition
      • Pharmaceuticals
      • Other End Uses
    • Y-o-Y Growth Trend Analysis By End Use, 2020 to 2024
    • Absolute $ Opportunity Analysis By End Use, 2025 to 2035
  8. Global Market Analysis 2020 to 2024 and Forecast 2025 to 2035, By Flavor
    • Introduction / Key Findings
    • Historical Market Size Value (USD Million) Analysis By Flavor, 2020 to 2024
    • Current and Future Market Size Value (USD Million) Analysis and Forecast By Flavor, 2025 to 2035
      • Blue Raspberry-Flavored
      • Pineapple-Flavored
      • Tropical Mango-Flavored
      • Cherry Popsicle-Flavored
      • Berry-Flavored
      • Other-Flavored
    • Y-o-Y Growth Trend Analysis By Flavor, 2020 to 2024
    • Absolute $ Opportunity Analysis By Flavor, 2025 to 2035
  9. Global Market Analysis 2020 to 2024 and Forecast 2025 to 2035, By Distribution Channel
    • Introduction / Key Findings
    • Historical Market Size Value (USD Million) Analysis By Distribution Channel, 2020 to 2024
    • Current and Future Market Size Value (USD Million) Analysis and Forecast By Distribution Channel, 2025 to 2035
      • Pharmacies And Drug Stores
      • Health & Beauty Stores
      • Hypermarkets/Supermarkets
      • Online Retailing
      • Direct Selling
    • Y-o-Y Growth Trend Analysis By Distribution Channel, 2020 to 2024
    • Absolute $ Opportunity Analysis By Distribution Channel, 2025 to 2035
  10. Global Market Analysis 2020 to 2024 and Forecast 2025 to 2035, By Region
    • Introduction
    • Historical Market Size Value (USD Million) Analysis By Region, 2020 to 2024
    • Current Market Size Value (USD Million) Analysis and Forecast By Region, 2025 to 2035
      • North America
      • Latin America
      • Western Europe
      • Eastern Europe
      • East Asia
      • South Asia and Pacific
      • Middle East & Africa
    • Market Attractiveness Analysis By Region
  11. North America Market Analysis 2020 to 2024 and Forecast 2025 to 2035, By Country
    • Historical Market Size Value (USD Million) Trend Analysis By Market Taxonomy, 2020 to 2024
    • Market Size Value (USD Million) Forecast By Market Taxonomy, 2025 to 2035
      • By Country
        • USA
        • Canada
        • Mexico
      • By Form
      • By End Use
      • By Flavor
      • By Distribution Channel
    • Market Attractiveness Analysis
      • By Country
      • By Form
      • By End Use
      • By Flavor
      • By Distribution Channel
    • Key Takeaways
  12. Latin America Market Analysis 2020 to 2024 and Forecast 2025 to 2035, By Country
    • Historical Market Size Value (USD Million) Trend Analysis By Market Taxonomy, 2020 to 2024
    • Market Size Value (USD Million) Forecast By Market Taxonomy, 2025 to 2035
      • By Country
        • Brazil
        • Chile
        • Rest of Latin America
      • By Form
      • By End Use
      • By Flavor
      • By Distribution Channel
    • Market Attractiveness Analysis
      • By Country
      • By Form
      • By End Use
      • By Flavor
      • By Distribution Channel
    • Key Takeaways
  13. Western Europe Market Analysis 2020 to 2024 and Forecast 2025 to 2035, By Country
    • Historical Market Size Value (USD Million) Trend Analysis By Market Taxonomy, 2020 to 2024
    • Market Size Value (USD Million) Forecast By Market Taxonomy, 2025 to 2035
      • By Country
        • Germany
        • UK
        • Italy
        • Spain
        • France
        • Nordic
        • BENELUX
        • Rest of Western Europe
      • By Form
      • By End Use
      • By Flavor
      • By Distribution Channel
    • Market Attractiveness Analysis
      • By Country
      • By Form
      • By End Use
      • By Flavor
      • By Distribution Channel
    • Key Takeaways
  14. Eastern Europe Market Analysis 2020 to 2024 and Forecast 2025 to 2035, By Country
    • Historical Market Size Value (USD Million) Trend Analysis By Market Taxonomy, 2020 to 2024
    • Market Size Value (USD Million) Forecast By Market Taxonomy, 2025 to 2035
      • By Country
        • Russia
        • Poland
        • Hungary
        • Balkan & Baltic
        • Rest of Eastern Europe
      • By Form
      • By End Use
      • By Flavor
      • By Distribution Channel
    • Market Attractiveness Analysis
      • By Country
      • By Form
      • By End Use
      • By Flavor
      • By Distribution Channel
    • Key Takeaways
  15. East Asia Market Analysis 2020 to 2024 and Forecast 2025 to 2035, By Country
    • Historical Market Size Value (USD Million) Trend Analysis By Market Taxonomy, 2020 to 2024
    • Market Size Value (USD Million) Forecast By Market Taxonomy, 2025 to 2035
      • By Country
        • China
        • Japan
        • South Korea
      • By Form
      • By End Use
      • By Flavor
      • By Distribution Channel
    • Market Attractiveness Analysis
      • By Country
      • By Form
      • By End Use
      • By Flavor
      • By Distribution Channel
    • Key Takeaways
  16. South Asia and Pacific Market Analysis 2020 to 2024 and Forecast 2025 to 2035, By Country
    • Historical Market Size Value (USD Million) Trend Analysis By Market Taxonomy, 2020 to 2024
    • Market Size Value (USD Million) Forecast By Market Taxonomy, 2025 to 2035
      • By Country
        • India
        • ASEAN
        • Australia & New Zealand
        • Rest of South Asia and Pacific
      • By Form
      • By End Use
      • By Flavor
      • By Distribution Channel
    • Market Attractiveness Analysis
      • By Country
      • By Form
      • By End Use
      • By Flavor
      • By Distribution Channel
    • Key Takeaways
  17. Middle East & Africa Market Analysis 2020 to 2024 and Forecast 2025 to 2035, By Country
    • Historical Market Size Value (USD Million) Trend Analysis By Market Taxonomy, 2020 to 2024
    • Market Size Value (USD Million) Forecast By Market Taxonomy, 2025 to 2035
      • By Country
        • Kingdom of Saudi Arabia
        • Other GCC Countries
        • Turkiye
        • South Africa
        • Other African Union
        • Rest of Middle East & Africa
      • By Form
      • By End Use
      • By Flavor
      • By Distribution Channel
    • Market Attractiveness Analysis
      • By Country
      • By Form
      • By End Use
      • By Flavor
      • By Distribution Channel
    • Key Takeaways
  18. Key Countries Market Analysis
    • USA
      • Pricing Analysis
      • Market Share Analysis, 2024
        • By Form
        • By End Use
        • By Flavor
        • By Distribution Channel
    • Canada
      • Pricing Analysis
      • Market Share Analysis, 2024
        • By Form
        • By End Use
        • By Flavor
        • By Distribution Channel
    • Mexico
      • Pricing Analysis
      • Market Share Analysis, 2024
        • By Form
        • By End Use
        • By Flavor
        • By Distribution Channel
    • Brazil
      • Pricing Analysis
      • Market Share Analysis, 2024
        • By Form
        • By End Use
        • By Flavor
        • By Distribution Channel
    • Chile
      • Pricing Analysis
      • Market Share Analysis, 2024
        • By Form
        • By End Use
        • By Flavor
        • By Distribution Channel
    • Germany
      • Pricing Analysis
      • Market Share Analysis, 2024
        • By Form
        • By End Use
        • By Flavor
        • By Distribution Channel
    • UK
      • Pricing Analysis
      • Market Share Analysis, 2024
        • By Form
        • By End Use
        • By Flavor
        • By Distribution Channel
    • Italy
      • Pricing Analysis
      • Market Share Analysis, 2024
        • By Form
        • By End Use
        • By Flavor
        • By Distribution Channel
    • Spain
      • Pricing Analysis
      • Market Share Analysis, 2024
        • By Form
        • By End Use
        • By Flavor
        • By Distribution Channel
    • France
      • Pricing Analysis
      • Market Share Analysis, 2024
        • By Form
        • By End Use
        • By Flavor
        • By Distribution Channel
    • India
      • Pricing Analysis
      • Market Share Analysis, 2024
        • By Form
        • By End Use
        • By Flavor
        • By Distribution Channel
    • ASEAN
      • Pricing Analysis
      • Market Share Analysis, 2024
        • By Form
        • By End Use
        • By Flavor
        • By Distribution Channel
    • Australia & New Zealand
      • Pricing Analysis
      • Market Share Analysis, 2024
        • By Form
        • By End Use
        • By Flavor
        • By Distribution Channel
    • China
      • Pricing Analysis
      • Market Share Analysis, 2024
        • By Form
        • By End Use
        • By Flavor
        • By Distribution Channel
    • Japan
      • Pricing Analysis
      • Market Share Analysis, 2024
        • By Form
        • By End Use
        • By Flavor
        • By Distribution Channel
    • South Korea
      • Pricing Analysis
      • Market Share Analysis, 2024
        • By Form
        • By End Use
        • By Flavor
        • By Distribution Channel
    • Russia
      • Pricing Analysis
      • Market Share Analysis, 2024
        • By Form
        • By End Use
        • By Flavor
        • By Distribution Channel
    • Poland
      • Pricing Analysis
      • Market Share Analysis, 2024
        • By Form
        • By End Use
        • By Flavor
        • By Distribution Channel
    • Hungary
      • Pricing Analysis
      • Market Share Analysis, 2024
        • By Form
        • By End Use
        • By Flavor
        • By Distribution Channel
    • Kingdom of Saudi Arabia
      • Pricing Analysis
      • Market Share Analysis, 2024
        • By Form
        • By End Use
        • By Flavor
        • By Distribution Channel
    • Turkiye
      • Pricing Analysis
      • Market Share Analysis, 2024
        • By Form
        • By End Use
        • By Flavor
        • By Distribution Channel
    • South Africa
      • Pricing Analysis
      • Market Share Analysis, 2024
        • By Form
        • By End Use
        • By Flavor
        • By Distribution Channel
  19. Market Structure Analysis
    • Competition Dashboard
    • Competition Benchmarking
    • Market Share Analysis of Top Players
      • By Regional
      • By Form
      • By End Use
      • By Flavor
      • By Distribution Channel
  20. Competition Analysis
    • Competition Deep Dive
      • Lonza Group Ltd.
        • Overview
        • Product Portfolio
        • Profitability by Market Segments (Product/Age /Sales Channel/Region)
        • Sales Footprint
        • Strategy Overview
          • Marketing Strategy
          • Product Strategy
          • Channel Strategy
      • Northeast Pharmaceutical Group Co., Ltd.
      • Ceva Santé Animale S.A.
      • Kaiyuan Hengtai Chemical Co., Ltd.
      • ChengDa Pharmaceuticals Co., Ltd.
      • Merck KGaA
      • Biosint S.p.A
      • Tokyo Chemical Industry Co., Ltd.
  21. Assumptions & Acronyms Used
  22. Research Methodology

List of Tables

  • Table 1: Global Market Value (USD Million) Forecast by Region, 2020 to 2035
  • Table 2: Global Market Value (USD Million) Forecast by Form , 2020 to 2035
  • Table 3: Global Market Value (USD Million) Forecast by End Use, 2020 to 2035
  • Table 4: Global Market Value (USD Million) Forecast by Flavor, 2020 to 2035
  • Table 5: Global Market Value (USD Million) Forecast by Distribution Channel, 2020 to 2035
  • Table 6: North America Market Value (USD Million) Forecast by Country, 2020 to 2035
  • Table 7: North America Market Value (USD Million) Forecast by Form , 2020 to 2035
  • Table 8: North America Market Value (USD Million) Forecast by End Use, 2020 to 2035
  • Table 9: North America Market Value (USD Million) Forecast by Flavor, 2020 to 2035
  • Table 10: North America Market Value (USD Million) Forecast by Distribution Channel, 2020 to 2035
  • Table 11: Latin America Market Value (USD Million) Forecast by Country, 2020 to 2035
  • Table 12: Latin America Market Value (USD Million) Forecast by Form , 2020 to 2035
  • Table 13: Latin America Market Value (USD Million) Forecast by End Use, 2020 to 2035
  • Table 14: Latin America Market Value (USD Million) Forecast by Flavor, 2020 to 2035
  • Table 15: Latin America Market Value (USD Million) Forecast by Distribution Channel, 2020 to 2035
  • Table 16: Western Europe Market Value (USD Million) Forecast by Country, 2020 to 2035
  • Table 17: Western Europe Market Value (USD Million) Forecast by Form , 2020 to 2035
  • Table 18: Western Europe Market Value (USD Million) Forecast by End Use, 2020 to 2035
  • Table 19: Western Europe Market Value (USD Million) Forecast by Flavor, 2020 to 2035
  • Table 20: Western Europe Market Value (USD Million) Forecast by Distribution Channel, 2020 to 2035
  • Table 21: Eastern Europe Market Value (USD Million) Forecast by Country, 2020 to 2035
  • Table 22: Eastern Europe Market Value (USD Million) Forecast by Form , 2020 to 2035
  • Table 23: Eastern Europe Market Value (USD Million) Forecast by End Use, 2020 to 2035
  • Table 24: Eastern Europe Market Value (USD Million) Forecast by Flavor, 2020 to 2035
  • Table 25: Eastern Europe Market Value (USD Million) Forecast by Distribution Channel, 2020 to 2035
  • Table 26: East Asia Market Value (USD Million) Forecast by Country, 2020 to 2035
  • Table 27: East Asia Market Value (USD Million) Forecast by Form , 2020 to 2035
  • Table 28: East Asia Market Value (USD Million) Forecast by End Use, 2020 to 2035
  • Table 29: East Asia Market Value (USD Million) Forecast by Flavor, 2020 to 2035
  • Table 30: East Asia Market Value (USD Million) Forecast by Distribution Channel, 2020 to 2035
  • Table 31: South Asia and Pacific Market Value (USD Million) Forecast by Country, 2020 to 2035
  • Table 32: South Asia and Pacific Market Value (USD Million) Forecast by Form , 2020 to 2035
  • Table 33: South Asia and Pacific Market Value (USD Million) Forecast by End Use, 2020 to 2035
  • Table 34: South Asia and Pacific Market Value (USD Million) Forecast by Flavor, 2020 to 2035
  • Table 35: South Asia and Pacific Market Value (USD Million) Forecast by Distribution Channel, 2020 to 2035
  • Table 36: Middle East & Africa Market Value (USD Million) Forecast by Country, 2020 to 2035
  • Table 37: Middle East & Africa Market Value (USD Million) Forecast by Form , 2020 to 2035
  • Table 38: Middle East & Africa Market Value (USD Million) Forecast by End Use, 2020 to 2035
  • Table 39: Middle East & Africa Market Value (USD Million) Forecast by Flavor, 2020 to 2035
  • Table 40: Middle East & Africa Market Value (USD Million) Forecast by Distribution Channel, 2020 to 2035

List of Figures

  • Figure 1: Global Market Pricing Analysis
  • Figure 2: Global Market Value (USD Million) Forecast 2020 to 2035
  • Figure 3: Global Market Value Share and BPS Analysis by Form , 2025 and 2035
  • Figure 4: Global Market Y-o-Y Growth Comparison by Form , 2025 to 2035
  • Figure 5: Global Market Attractiveness Analysis by Form
  • Figure 6: Global Market Value Share and BPS Analysis by End Use, 2025 and 2035
  • Figure 7: Global Market Y-o-Y Growth Comparison by End Use, 2025 to 2035
  • Figure 8: Global Market Attractiveness Analysis by End Use
  • Figure 9: Global Market Value Share and BPS Analysis by Flavor, 2025 and 2035
  • Figure 10: Global Market Y-o-Y Growth Comparison by Flavor, 2025 to 2035
  • Figure 11: Global Market Attractiveness Analysis by Flavor
  • Figure 12: Global Market Value Share and BPS Analysis by Distribution Channel, 2025 and 2035
  • Figure 13: Global Market Y-o-Y Growth Comparison by Distribution Channel, 2025 to 2035
  • Figure 14: Global Market Attractiveness Analysis by Distribution Channel
  • Figure 15: Global Market Value (USD Million) Share and BPS Analysis by Region, 2025 and 2035
  • Figure 16: Global Market Y-o-Y Growth Comparison by Region, 2025 to 2035
  • Figure 17: Global Market Attractiveness Analysis by Region
  • Figure 18: North America Market Incremental Dollar Opportunity, 2025 to 2035
  • Figure 19: Latin America Market Incremental Dollar Opportunity, 2025 to 2035
  • Figure 20: Western Europe Market Incremental Dollar Opportunity, 2025 to 2035
  • Figure 21: Eastern Europe Market Incremental Dollar Opportunity, 2025 to 2035
  • Figure 22: East Asia Market Incremental Dollar Opportunity, 2025 to 2035
  • Figure 23: South Asia and Pacific Market Incremental Dollar Opportunity, 2025 to 2035
  • Figure 24: Middle East & Africa Market Incremental Dollar Opportunity, 2025 to 2035
  • Figure 25: North America Market Value Share and BPS Analysis by Country, 2025 and 2035
  • Figure 26: North America Market Value Share and BPS Analysis by Form , 2025 and 2035
  • Figure 27: North America Market Y-o-Y Growth Comparison by Form , 2025 to 2035
  • Figure 28: North America Market Attractiveness Analysis by Form
  • Figure 29: North America Market Value Share and BPS Analysis by End Use, 2025 and 2035
  • Figure 30: North America Market Y-o-Y Growth Comparison by End Use, 2025 to 2035
  • Figure 31: North America Market Attractiveness Analysis by End Use
  • Figure 32: North America Market Value Share and BPS Analysis by Flavor, 2025 and 2035
  • Figure 33: North America Market Y-o-Y Growth Comparison by Flavor, 2025 to 2035
  • Figure 34: North America Market Attractiveness Analysis by Flavor
  • Figure 35: North America Market Value Share and BPS Analysis by Distribution Channel, 2025 and 2035
  • Figure 36: North America Market Y-o-Y Growth Comparison by Distribution Channel, 2025 to 2035
  • Figure 37: North America Market Attractiveness Analysis by Distribution Channel
  • Figure 38: Latin America Market Value Share and BPS Analysis by Country, 2025 and 2035
  • Figure 39: Latin America Market Value Share and BPS Analysis by Form , 2025 and 2035
  • Figure 40: Latin America Market Y-o-Y Growth Comparison by Form , 2025 to 2035
  • Figure 41: Latin America Market Attractiveness Analysis by Form
  • Figure 42: Latin America Market Value Share and BPS Analysis by End Use, 2025 and 2035
  • Figure 43: Latin America Market Y-o-Y Growth Comparison by End Use, 2025 to 2035
  • Figure 44: Latin America Market Attractiveness Analysis by End Use
  • Figure 45: Latin America Market Value Share and BPS Analysis by Flavor, 2025 and 2035
  • Figure 46: Latin America Market Y-o-Y Growth Comparison by Flavor, 2025 to 2035
  • Figure 47: Latin America Market Attractiveness Analysis by Flavor
  • Figure 48: Latin America Market Value Share and BPS Analysis by Distribution Channel, 2025 and 2035
  • Figure 49: Latin America Market Y-o-Y Growth Comparison by Distribution Channel, 2025 to 2035
  • Figure 50: Latin America Market Attractiveness Analysis by Distribution Channel
  • Figure 51: Western Europe Market Value Share and BPS Analysis by Country, 2025 and 2035
  • Figure 52: Western Europe Market Value Share and BPS Analysis by Form , 2025 and 2035
  • Figure 53: Western Europe Market Y-o-Y Growth Comparison by Form , 2025 to 2035
  • Figure 54: Western Europe Market Attractiveness Analysis by Form
  • Figure 55: Western Europe Market Value Share and BPS Analysis by End Use, 2025 and 2035
  • Figure 56: Western Europe Market Y-o-Y Growth Comparison by End Use, 2025 to 2035
  • Figure 57: Western Europe Market Attractiveness Analysis by End Use
  • Figure 58: Western Europe Market Value Share and BPS Analysis by Flavor, 2025 and 2035
  • Figure 59: Western Europe Market Y-o-Y Growth Comparison by Flavor, 2025 to 2035
  • Figure 60: Western Europe Market Attractiveness Analysis by Flavor
  • Figure 61: Western Europe Market Value Share and BPS Analysis by Distribution Channel, 2025 and 2035
  • Figure 62: Western Europe Market Y-o-Y Growth Comparison by Distribution Channel, 2025 to 2035
  • Figure 63: Western Europe Market Attractiveness Analysis by Distribution Channel
  • Figure 64: Eastern Europe Market Value Share and BPS Analysis by Country, 2025 and 2035
  • Figure 65: Eastern Europe Market Value Share and BPS Analysis by Form , 2025 and 2035
  • Figure 66: Eastern Europe Market Y-o-Y Growth Comparison by Form , 2025 to 2035
  • Figure 67: Eastern Europe Market Attractiveness Analysis by Form
  • Figure 68: Eastern Europe Market Value Share and BPS Analysis by End Use, 2025 and 2035
  • Figure 69: Eastern Europe Market Y-o-Y Growth Comparison by End Use, 2025 to 2035
  • Figure 70: Eastern Europe Market Attractiveness Analysis by End Use
  • Figure 71: Eastern Europe Market Value Share and BPS Analysis by Flavor, 2025 and 2035
  • Figure 72: Eastern Europe Market Y-o-Y Growth Comparison by Flavor, 2025 to 2035
  • Figure 73: Eastern Europe Market Attractiveness Analysis by Flavor
  • Figure 74: Eastern Europe Market Value Share and BPS Analysis by Distribution Channel, 2025 and 2035
  • Figure 75: Eastern Europe Market Y-o-Y Growth Comparison by Distribution Channel, 2025 to 2035
  • Figure 76: Eastern Europe Market Attractiveness Analysis by Distribution Channel
  • Figure 77: East Asia Market Value Share and BPS Analysis by Country, 2025 and 2035
  • Figure 78: East Asia Market Value Share and BPS Analysis by Form , 2025 and 2035
  • Figure 79: East Asia Market Y-o-Y Growth Comparison by Form , 2025 to 2035
  • Figure 80: East Asia Market Attractiveness Analysis by Form
  • Figure 81: East Asia Market Value Share and BPS Analysis by End Use, 2025 and 2035
  • Figure 82: East Asia Market Y-o-Y Growth Comparison by End Use, 2025 to 2035
  • Figure 83: East Asia Market Attractiveness Analysis by End Use
  • Figure 84: East Asia Market Value Share and BPS Analysis by Flavor, 2025 and 2035
  • Figure 85: East Asia Market Y-o-Y Growth Comparison by Flavor, 2025 to 2035
  • Figure 86: East Asia Market Attractiveness Analysis by Flavor
  • Figure 87: East Asia Market Value Share and BPS Analysis by Distribution Channel, 2025 and 2035
  • Figure 88: East Asia Market Y-o-Y Growth Comparison by Distribution Channel, 2025 to 2035
  • Figure 89: East Asia Market Attractiveness Analysis by Distribution Channel
  • Figure 90: South Asia and Pacific Market Value Share and BPS Analysis by Country, 2025 and 2035
  • Figure 91: South Asia and Pacific Market Value Share and BPS Analysis by Form , 2025 and 2035
  • Figure 92: South Asia and Pacific Market Y-o-Y Growth Comparison by Form , 2025 to 2035
  • Figure 93: South Asia and Pacific Market Attractiveness Analysis by Form
  • Figure 94: South Asia and Pacific Market Value Share and BPS Analysis by End Use, 2025 and 2035
  • Figure 95: South Asia and Pacific Market Y-o-Y Growth Comparison by End Use, 2025 to 2035
  • Figure 96: South Asia and Pacific Market Attractiveness Analysis by End Use
  • Figure 97: South Asia and Pacific Market Value Share and BPS Analysis by Flavor, 2025 and 2035
  • Figure 98: South Asia and Pacific Market Y-o-Y Growth Comparison by Flavor, 2025 to 2035
  • Figure 99: South Asia and Pacific Market Attractiveness Analysis by Flavor
  • Figure 100: South Asia and Pacific Market Value Share and BPS Analysis by Distribution Channel, 2025 and 2035
  • Figure 101: South Asia and Pacific Market Y-o-Y Growth Comparison by Distribution Channel, 2025 to 2035
  • Figure 102: South Asia and Pacific Market Attractiveness Analysis by Distribution Channel
  • Figure 103: Middle East & Africa Market Value Share and BPS Analysis by Country, 2025 and 2035
  • Figure 104: Middle East & Africa Market Value Share and BPS Analysis by Form , 2025 and 2035
  • Figure 105: Middle East & Africa Market Y-o-Y Growth Comparison by Form , 2025 to 2035
  • Figure 106: Middle East & Africa Market Attractiveness Analysis by Form
  • Figure 107: Middle East & Africa Market Value Share and BPS Analysis by End Use, 2025 and 2035
  • Figure 108: Middle East & Africa Market Y-o-Y Growth Comparison by End Use, 2025 to 2035
  • Figure 109: Middle East & Africa Market Attractiveness Analysis by End Use
  • Figure 110: Middle East & Africa Market Value Share and BPS Analysis by Flavor, 2025 and 2035
  • Figure 111: Middle East & Africa Market Y-o-Y Growth Comparison by Flavor, 2025 to 2035
  • Figure 112: Middle East & Africa Market Attractiveness Analysis by Flavor
  • Figure 113: Middle East & Africa Market Value Share and BPS Analysis by Distribution Channel, 2025 and 2035
  • Figure 114: Middle East & Africa Market Y-o-Y Growth Comparison by Distribution Channel, 2025 to 2035
  • Figure 115: Middle East & Africa Market Attractiveness Analysis by Distribution Channel
  • Figure 116: Global Market – Tier Structure Analysis
  • Figure 117: Global Market – Company Share Analysis

Frequently Asked Questions

How big is the carnitine supplements market in 2025?

The global carnitine supplements market is estimated to be valued at USD 322.4 million in 2025.

What will be the size of carnitine supplements market in 2035?

The market size for the carnitine supplements market is projected to reach USD 566.5 million by 2035.

How much will be the carnitine supplements market growth between 2025 and 2035?

The carnitine supplements market is expected to grow at a 5.8% CAGR between 2025 and 2035.

What are the key product types in the carnitine supplements market?

The key product types in carnitine supplements market are carnitine supplement capsules, powdered, liquid and other forms.

Which end use segment to contribute significant share in the carnitine supplements market in 2025?

In terms of end use, sports nutrition segment to command 40.0% share in the carnitine supplements market in 2025.

Explore Similar Insights

Future Market Insights

Carnitine Supplements Market

Chat With MaRIA

Chat With

MaRIA

Hi There, I am MaRIA, Your Market Research Intelligence Assistant. How may I help you?