Peptide Supplements Market Size and Share Forecast Outlook 2025 to 2035

The global peptide supplements market is projected to grow from USD 4.1 billion in 2025 to USD 11.2 billion by 2035, registering a robust CAGR of 10.4%. Market expansion is driven by rising consumer focus on preventive health, fitness, and anti-aging solutions.
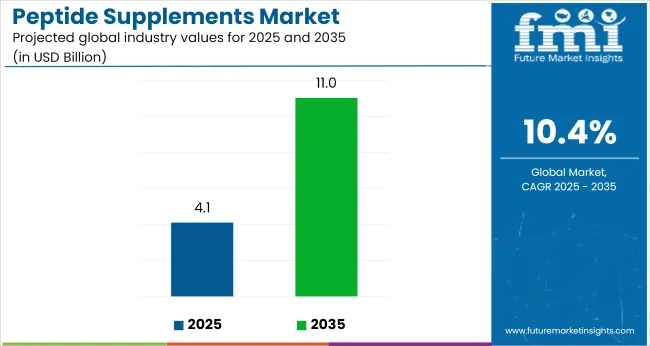
Quick Stats for Peptide Supplements Market

  • Market Value (2025): USD 4.1 billion
  • Forecast Value (2035): USD 11.2 billion
  • Forecast CAGR: 10.4%
  • Source Type Leader in 2025: Animal-derived (35.5% market share)
  • Top Distribution Channel Segment: Online Retail (39.2% share)
  • Key Growth Region: North America (USA is the fastest-growing market with 11.3% CAGR)
Peptide Supplements Market Industry Value Analysis
Metric Value
Industry Size (2025E) USD 4.1 billion
Industry Value (2035F) USD 11.2 billion
CAGR (2025 to 2035) 10.4%

Increasing demand for functional ingredients that support muscle recovery, immune health, and skin vitality is prompting supplement manufacturers to incorporate bioactive peptides across sports nutrition, beauty, and wellness formulations.

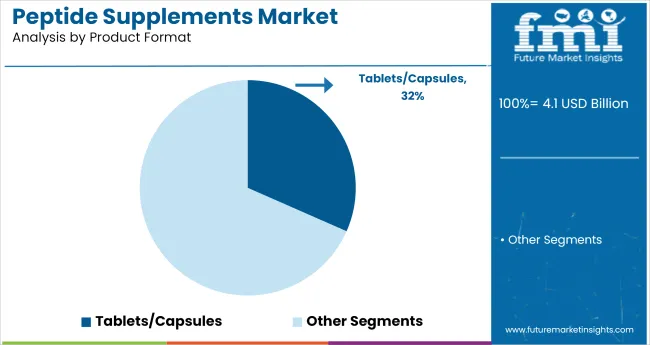
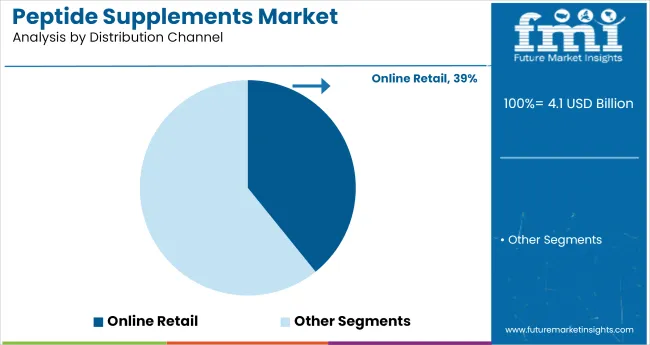
The market holds an approximately 31.6% share of tablets and capsules, driven by their ease of consumption, precise dosing, and extended shelf life. Within the distribution channel, online retail accounts for approximately 39.2% share, reflecting rising consumer preference for convenience, subscription-based wellness, and direct-to-consumer supplement brands. The market also contributes to the broader nutraceuticals industry, supporting innovation in functional health products and performance nutrition.

Government regulations impacting the market focus on ingredient safety, health claims, labeling accuracy, and dosage limits. Regulatory bodies such as the USA FDA and EFSA play a key role in approving bioactive peptides and enforcing standards under frameworks like GRAS (Generally Recognized as Safe) and Novel Food Regulation.

These regulations ensure that peptides used in supplements are safe, well-researched, and clearly communicated to consumers. Additionally, global standards on nutritional claims and product transparency are promoting the adoption of clinically backed peptide formulations. This regulatory oversight strengthens consumer trust and encourages responsible innovation across regions.

The USA is projected to be the fastest-growing market, expanding at a CAGR of 11.3% from 2025 to 2035. Tablets and capsules will lead the product format segment with a 31.6% share, while online retail will dominate the distribution channel with a 39.2% share in 2025. The Germany and Japan markets are also expected to grow steadily at CAGRs of 7.8% and 9.2%, respectively.

Analyzing Peptide Supplements Market by Top Investment Segments

The market is segmented by product type, source type, functionality, product format, distribution channel, and region. By product type, the market is categorized into bioactive peptides, collagen peptides, whey protein peptides, muscle-building peptides, anti-aging peptides, and immune-enhancing peptides.

Based on source type, the market is divided into animal-derived, plant-derived, and synthetic peptides. By functionality, the market includes muscle recovery, weight management, skin health, immune support, cognitive function, anti-inflammatory, and cardiovascular health. By product format, the market is segmented into powder, tablets/capsules, chews/soft gels, liquid, and oral strips.

Based on distribution channel, the market is categorized into online retail, pharmacies, specialty nutrition stores, supermarkets, direct sales, and healthcare institutions. Regionally, the market is classified into North America, Latin America, Western Europe, Eastern Europe, Balkans & Baltic, Russia & Belarus, Central Asia, East Asia, South Asia & Pacific, Middle East & Africa.

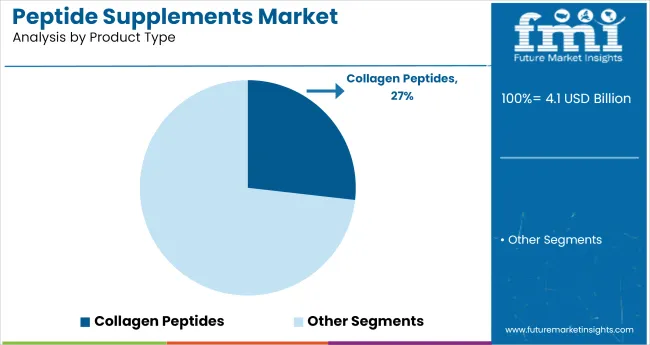
Collagen Peptides to Lead the Product Type Segment with 26.8% Market Share

Collagen peptides are projected to lead the product type segment, accounting for 26.8% of the global market share in 2025. Their benefits for skin health, joint strength, and bone density make them a leading choice among aging and beauty-focused consumers.
  • They are widely integrated into powders, drinks, and capsules targeting both women and older adults.
  • Rising awareness about skin aging and bone health is fueling their global demand.
Peptide Supplements Market Analysis By Product Type

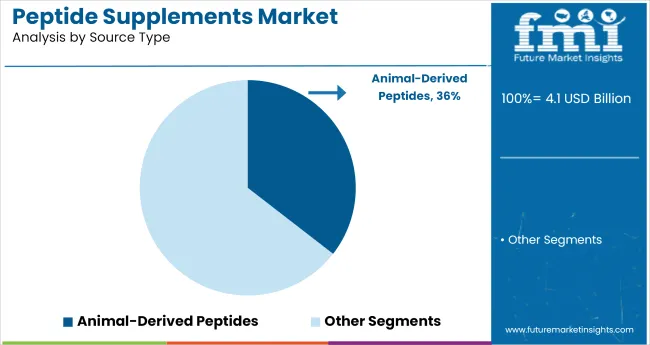
Animal-Derived Peptides to Lead the Source Type Segment with 35.5% Market Share

Animal-derived peptides are expected to dominate the source type segment, accounting for 35.5% of the market share in 2025. These include collagen and whey peptides known for superior bioavailability and muscle recovery benefits.
  • They are commonly sourced from bovine, marine, and dairy origins, and used in anti-aging and muscle-building applications.
  • Consumer trust in animal-based efficacy is maintaining their lead despite growing plant-based trends.
Peptide Supplements Market Analysis By Source Type

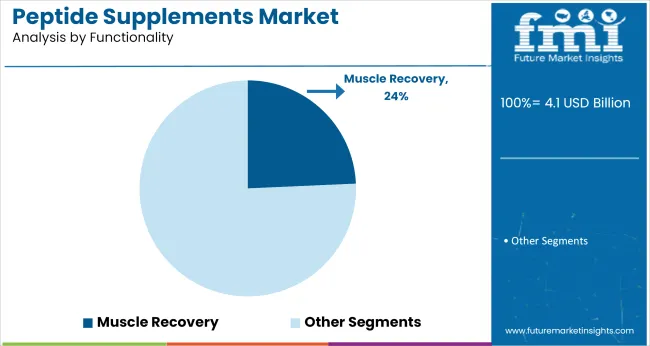
Muscle Recovery to Dominate the Functionality Segment with 24.3% Market Share

Muscle recovery is anticipated to lead the functionality segment, accounting for 24.3% of the global market share in 2025. Peptides in this category support post-workout recovery, muscle synthesis, and fatigue reduction.
  • Widely used by athletes, gym-goers, and fitness enthusiasts, these supplements are in high demand across sports nutrition.
  • Peptides supporting muscle repair, reduced fatigue, and enhanced performance make them a preferred choice in sports and fitness nutrition.
Peptide Supplements Market Analysis By Functionality

Tablets/Capsules to Lead the Product Format Segment with 31.6% Market Share

Tablets and capsules are expected to dominate the product format segment, accounting for approximately 31.6% of the global peptide supplements market by 2025. Their convenience, precise dosing, and portability make them highly popular among fitness enthusiasts and aging populations.
  • These formats are widely used in muscle-building, anti-aging, and immune-enhancing supplements.
  • The pharmaceutical-style delivery supports sustained-release mechanisms and user compliance.
Peptide Supplements Market Analysis By Product Format

Online Retail to Dominate the Distribution Channel Segment with 39.2% Market Share

Online retail is expected to lead the distribution channel segment, capturing 39.2% of the global market share in 2025. E-commerce platforms offer broad accessibility, product variety, and discounts that appeal to a tech-savvy and health-conscious consumer base.
  • Digital channels are especially strong in North America and Asia Pacific, where supplement users prefer doorstep delivery and access to global brands.
  • Product transparency, consumer reviews, and subscription models are boosting long-term online demand.
Peptide Supplements Market Analysis By Distribution Channel

Top Peptide Supplements Market Dynamics

The global peptide supplements market has been experiencing steady growth, driven by rising consumer focus on fitness, anti-aging solutions, and personalized nutrition. Peptides are gaining popularity for their targeted functionality in muscle recovery, immune support, and skin health aligning with preventive healthcare and performance wellness trends.

Recent Trends in the Peptide Supplements Market

  • Advancements in peptide synthesis and encapsulation technologies are improving bioavailability, taste masking, and controlled release.
  • Growing demand for collagen and bioactive peptides in beauty-from-within and sports nutrition categories is driving formulation innovation.

Challenges in the Peptide Supplements Market

  • High production costs and complex extraction methods for bioactive peptides hinder mass-market affordability.
  • Strict regulatory scrutiny around health claims, ingredient sourcing, and product safety delays commercialization in many regions.

Top Countries Manufacturing, Regulating, and Generating Demand for Peptide Supplements

The USA leads the peptide supplements market due to regulatory compliance, wellness trends, and advancements in functional nutrition. In Germany and France, growth rates of 7.8% and 8.1%, respectively, are being recorded, with market expansion supported by cognitive and weight management formulations. While, UK market is projected to grow at 8.7% CAGR and Japan, at a CAGR of 9.2%.

Japan is witnessing strong growth in peptide supplement demand, especially for collagen-based products favored by its aging population and preference for minimalist wellness solutions. The UK is also gaining momentum, with rising interest in clean-label, vegan, and performance-oriented peptides.

Meanwhile, Germany and France are experiencing steady growth, fueled by innovation in cognitive and weight management applications. These countries benefit from supportive regulatory frameworks, growing consumer awareness, and a shift toward holistic health and targeted nutritional supplementation.

The report includes detailed analysis of 40+ countries, with the five top-performing OECD nations highlighted here.

In-depth Analysis of Peptide Supplements Demand in the USA

The USA peptide supplements revenue is poised to grow at a CAGR of 11.3% from 2025 to 2035. Growth is driven by strong consumer demand for sports nutrition, anti-aging, and immune-enhancing supplements.

  • High demand for collagen, whey, and muscle-recovery peptides.
  • Rapid innovation in delivery formats like capsules and oral strips.

Growth Outlook for Peptide Supplements in Germany

The sales of peptide supplements in Germany are poised to expand at a CAGR of 7.8% during the forecast period. Growth is driven by increased awareness of preventive healthcare and beauty-from-within nutrition trends.

  • Rising use of anti-aging and cognitive-enhancing peptides.
  • Strong growth in pharmacy and specialty nutrition store channels.

Demand Trajectory for Peptide Supplements in France

The demand for peptide supplements market in France is projected to grow at a CAGR of 8.1% from 2025 to 2035. Demand is driven by supported by increasing demand for weight management, skin health, and muscle support formulations.

  • Expanding applications in liquid and soft gel formats.
  • Clean-label and plant-based peptides gaining traction.

Analysis of Peptide Supplements in Japan

The Japan peptide supplements market is projected to grow at a CAGR of 9.2% from 2025 to 2035.The growth is driven by aging population concerns and rising interest in collagen and cognitive health peptides.

  • High adoption of collagen and anti-aging peptides.
  • Growth in online and direct-to-consumer supplement sales.

Peptide Supplements Trends in the UK

The UK peptide supplements revenue is expected to grow at a CAGR of 8.7% between 2025 and 2035. Growth is supported by rising fitness culture, growing acceptance of protein supplementation, and demand for vegan peptides are key growth drivers.

  • High preference for whey, vegan, and immune-enhancing peptides.
  • Clean-label, functional nutrition formats gaining market share.

Leading Peptide Supplement Suppliers and Manufacturers

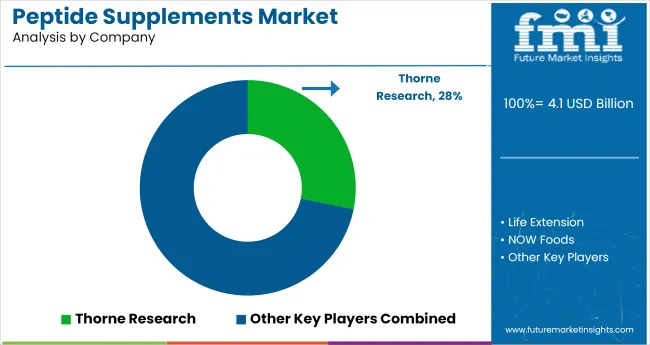
The peptide supplements market is moderately consolidated, with prominent players such as Thorne Research, Life Extension, NOW Foods, Designs for Health, and Nootropics Depot actively shaping the industry. These companies are known for delivering high-purity, science-backed peptide formulations that support muscle growth, anti-aging, cognitive enhancement, and immune function.

Thorne Research is recognized for its clinical-grade peptide blends and sports nutrition offerings, with a strong focus on third-party testing and clean-label compliance.

Leading players in the peptide supplements market, such as Thorne Research, Life Extension, NOW Foods, Designs for Health, and Nootropics Depot, are shaping industry standards through innovation, quality, and science-backed formulations. These companies offer a wide range of peptide-based products targeting muscle recovery, cognitive function, anti-aging, and immune health.

Known for their commitment to purity and efficacy, they invest in third-party testing, clean-label compliance, and advanced delivery systems. Their focus on research-driven development and consumer wellness has positioned them as trusted names in both practitioner and direct-to-consumer segments of the markets.

Recent Peptide Supplements Industry News
  • In October 2024, Designs for Health launched Performance Peptides™, a plant-based bioactive peptide supplement designed to support muscle strength, endurance, recovery, and performance in aging men and women.
Peptide Supplements Market Analysis By Company

Peptide Supplements Market Report Scope

Report Attributes Details
Market Size (2025) USD 4.1 billion
Projected Market Size (2035) USD 11.2 billion
CAGR (2025 to 2035) 10.4%
Base Year for Estimation 2024
Historical Period 2020 to 2024
Projections Period 2025 to 2035
Report Parameter USD billion for value/Volume in metric tons
By Product Type Bioactive Peptides, Collagen Peptides, and Whey Protein Peptides, Muscle-Building Peptides, Anti-Aging Peptides, and Immune-Enhancing Peptides
By Source Type Animal-Derived, Plant-Derived, and Synthetic Peptides
By Functionality Muscle Recovery, Weight Management, Skin Health, Immune Support, Cognitive Function, Anti-Inflammatory, and Cardiovascular Health
By Product Format Powder, Tablets/Capsules, Chews/Soft Gels, Liquid, and Oral Strips
By Distribution Channel Online Retail, Pharmacies, Specialty Nutrition Stores, Supermarkets, Direct Sales, and Healthcare Institutions
Regions Covered North America, Latin America, Western Europe, Eastern Europe, Balkans & Baltic, Russia & Belarus, Central Asia, East Asia, South Asia & Pacific, Middle East & Africa
Countries Covered United States, Canada, United Kingdom, Germany, France, China, Japan, South Korea, Brazil, Australia
Key Players Influencing the Market Thorne Research, Life Extension, NOW Foods, Designs for Health, Nootropics Depot, Peptides Sciences, American Peptide Company, Pure Encapsulations, BioMed Nutrition, Vitamin Research Products, Hammer Nutrition, Source Naturals
Additional Attributes Dollar sales by product type, share by functionality, regional demand growth, regulatory influence, clean-label trends, competitive benchmarking

Key Segmentation

By Product Type:

As per Product Type, the industry has been categorized into Bioactive peptides, Collagen peptides, Whey protein peptides, Muscle-building peptides, Anti-aging peptides and Immune-enhancing peptides.

By Source:

As per Source, the industry has been categorized into Animal-derived, Plant-derived and Synthetic peptides.

By Functionality:

As per Functionality, the industry has been categorized into Muscle recovery, Weight management, Skin health, Immune support, Cognitive function, Anti-inflammatory and Cardiovascular health.

By Product Format:

As per Product Format, the industry has been categorized into Powder, Tablets/Capsules, Chews/Soft Gels, Liquid and Oral Strips.

By Distribution Channel:

As per Distribution Channel, the industry has been categorized into Online retail, Pharmacies, Specialty nutrition stores, Supermarkets, Direct sales and Healthcare institutions.

By Region:

Industry analysis has been carried out in key countries of North America, Latin America, Western Europe Eastern Europe, Balkans & Baltic, Russia & Belarus, Central Asia, East Asia, South Asia & Pacific and Middle East & Africa.

Table of Content

  1. Executive Summary
    • Global Market Outlook
    • Demand-side Trends
    • Supply-side Trends
    • Technology Roadmap Analysis
    • Analysis and Recommendations
  2. Market Overview
    • Market Coverage/Taxonomy
    • Market Definition/Scope/Limitations
  3. Market Background
    • Market Dynamics
      • Drivers
      • Restraints
      • Opportunity
      • Trends
    • Scenario Forecast
      • Demand in Optimistic Scenario
      • Demand in Likely Scenario
      • Demand in Conservative Scenario
    • Opportunity Map Analysis
    • Product Life Cycle Analysis
    • Supply Chain Analysis
      • Supply Side Participants and their Roles
        • Producers
        • Mid-Level Participants (Traders/ Agents/ Brokers)
        • Wholesalers and Distributors
      • Value Added and Value Created at Node in the Supply Chain
      • List of Raw Material Suppliers
      • List of Existing and Potential Buyer’s
    • Investment Feasibility Matrix
    • Value Chain Analysis
      • Profit Margin Analysis
      • Wholesalers and Distributors
      • Retailers
    • PESTLE and Porter’s Analysis
    • Regulatory Landscape
      • By Key Regions
      • By Key Countries
    • Regional Parent Market Outlook
    • Production and Consumption Statistics
    • Import and Export Statistics
  4. Global Market Analysis 2020 to 2024 and Forecast, 2025 to 2035
    • Historical Market Size Value (USD Billion) & Volume (Metric Tons) Analysis, 2020 to 2024
    • Current and Future Market Size Value (USD Billion) & Volume (Metric Tons) Projections, 2025 to 2035
      • Y-o-Y Growth Trend Analysis
      • Absolute $ Opportunity Analysis
  5. Global Market Pricing Analysis 2020 to 2024 and Forecast 2025 to 2035
  6. Global Market Analysis 2020 to 2024 and Forecast 2025 to 2035, By Product Type
    • Introduction/Key Findings
    • Historical Market Size Value (USD Billion) & Volume (Metric Tons) Analysis By Product Type, 2020 to 2024
    • Current and Future Market Size Value (USD Billion) & Volume (Metric Tons) Analysis and Forecast By Product Type, 2025 to 2035
      • Bioactive peptides
      • Collagen peptides
      • Whey protein peptides
      • Muscle-building peptides
      • Anti-aging peptides
      • Immune-enhancing peptides
    • Y-o-Y Growth Trend Analysis By Product Type, 2020 to 2024
    • Absolute $ Opportunity Analysis By Product Type, 2025 to 2035
  7. Global Market Analysis 2020 to 2024 and Forecast 2025 to 2035, By Source Type
    • Introduction/Key Findings
    • Historical Market Size Value (USD Billion) & Volume (Metric Tons) Analysis By Source Type, 2020 to 2024
    • Current and Future Market Size Value (USD Billion) & Volume (Metric Tons) Analysis and Forecast By Source Type, 2025 to 2035
      • Animal-derived
      • Plant-derived
      • Synthetic peptides
    • Y-o-Y Growth Trend Analysis By Source Type, 2020 to 2024
    • Absolute $ Opportunity Analysis By Source Type, 2025 to 2035
  8. Global Market Analysis 2020 to 2024 and Forecast 2025 to 2035, By Functionality
    • Introduction/Key Findings
    • Historical Market Size Value (USD Billion) & Volume (Metric Tons) Analysis By Functionality, 2020 to 2024
    • Current and Future Market Size Value (USD Billion) & Volume (Metric Tons) Analysis and Forecast By Functionality, 2025 to 2035
      • Muscle recovery
      • Weight management
      • Skin health
      • Immune support
      • Cognitive function
      • Anti-inflammatory
      • Cardiovascular health
    • Y-o-Y Growth Trend Analysis By Functionality, 2020 to 2024
    • Absolute $ Opportunity Analysis By Functionality, 2025 to 2035
  9. Global Market Analysis 2020 to 2024 and Forecast 2025 to 2035, By Product Format
    • Introduction/Key Findings
    • Historical Market Size Value (USD Billion) & Volume (Metric Tons) Analysis By Product Format, 2020 to 2024
    • Current and Future Market Size Value (USD Billion) & Volume (Metric Tons) Analysis and Forecast By Product Format, 2025 to 2035
      • Powder
      • Tablets/Capsules
      • Chews/Soft Gels
      • Liquid
      • Oral Strips
    • Y-o-Y Growth Trend Analysis By Product Format, 2020 to 2024
    • Absolute $ Opportunity Analysis By Product Format, 2025 to 2035
  10. Global Market Analysis 2020 to 2024 and Forecast 2025 to 2035, By Distribution Channel
    • Introduction/Key Findings
    • Historical Market Size Value (USD Billion) & Volume (Metric Tons) Analysis By Distribution Channel, 2020 to 2024
    • Current and Future Market Size Value (USD Billion) & Volume (Metric Tons) Analysis and Forecast By Distribution Channel, 2025 to 2035
      • Online retail
      • Pharmacies
      • Specialty nutrition stores
      • Supermarkets
      • Direct sales
      • Healthcare institutions
    • Y-o-Y Growth Trend Analysis By Distribution Channel, 2020 to 2024
    • Absolute $ Opportunity Analysis By Distribution Channel, 2025 to 2035
  11. Global Market Analysis 2020 to 2024 and Forecast 2025 to 2035, By Region
    • Introduction
    • Historical Market Size Value (USD Billion) & Volume (Metric Tons) Analysis By Region, 2020 to 2024
    • Current Market Size Value (USD Billion) & Volume (Metric Tons) Analysis and Forecast By Region, 2025 to 2035
      • North America
      • Latin America
      • Western Europe
      • Eastern Europe
      • East Asia
      • South Asia & Pacific
      • Middle East and Africa
    • Market Attractiveness Analysis By Region
  12. North America Market Analysis 2020 to 2024 and Forecast 2025 to 2035, By Country
    • Historical Market Size Value (USD Billion) & Volume (Metric Tons) Trend Analysis By Market Taxonomy, 2020 to 2024
    • Market Size Value (USD Billion) & Volume (Metric Tons) Forecast By Market Taxonomy, 2025 to 2035
      • By Country
        • USA
        • Canada
        • Mexico
      • By Product Type
      • By Source Type
      • By Functionality
      • By Product Format
      • By Distribution Channel
    • Market Attractiveness Analysis
      • By Country
      • By Product Type
      • By Source Type
      • By Functionality
      • By Product Format
      • By Distribution Channel
    • Key Takeaways
  13. Latin America Market Analysis 2020 to 2024 and Forecast 2025 to 2035, By Country
    • Historical Market Size Value (USD Billion) & Volume (Metric Tons) Trend Analysis By Market Taxonomy, 2020 to 2024
    • Market Size Value (USD Billion) & Volume (Metric Tons) Forecast By Market Taxonomy, 2025 to 2035
      • By Country
        • Brazil
        • Argentina
        • Rest of LATAM
      • By Product Type
      • By Source Type
      • By Functionality
      • By Product Format
      • By Distribution Channel
    • Market Attractiveness Analysis
      • By Country
      • By Product Type
      • By Source Type
      • By Functionality
      • By Product Format
      • By Distribution Channel
    • Key Takeaways
  14. Western Europe Market Analysis 2020 to 2024 and Forecast 2025 to 2035, By Country
    • Historical Market Size Value (USD Billion) & Volume (Metric Tons) Trend Analysis By Market Taxonomy, 2020 to 2024
    • Market Size Value (USD Billion) & Volume (Metric Tons) Forecast By Market Taxonomy, 2025 to 2035
      • By Country
        • Germany
        • Italy
        • France
        • UK
        • Spain
        • BENELUX
        • Nordic
        • Rest of W.Europe
      • By Product Type
      • By Source Type
      • By Functionality
      • By Product Format
      • By Distribution Channel
    • Market Attractiveness Analysis
      • By Country
      • By Product Type
      • By Source Type
      • By Functionality
      • By Product Format
      • By Distribution Channel
    • Key Takeaways
  15. Eastern Europe Market Analysis 2020 to 2024 and Forecast 2025 to 2035, By Country
    • Historical Market Size Value (USD Billion) & Volume (Metric Tons) Trend Analysis By Market Taxonomy, 2020 to 2024
    • Market Size Value (USD Billion) & Volume (Metric Tons) Forecast By Market Taxonomy, 2025 to 2035
      • By Country
        • Russia
        • Hungary
        • Poland
        • Balkan & Baltics
        • Rest of E. Europe
      • By Product Type
      • By Source Type
      • By Functionality
      • By Product Format
      • By Distribution Channel
    • Market Attractiveness Analysis
      • By Country
      • By Product Type
      • By Source Type
      • By Functionality
      • By Product Format
      • By Distribution Channel
    • Key Takeaways
  16. East Asia Market Analysis 2020 to 2024 and Forecast 2025 to 2035, By Country
    • Historical Market Size Value (USD Billion) & Volume (Metric Tons) Trend Analysis By Market Taxonomy, 2020 to 2024
    • Market Size Value (USD Billion) & Volume (Metric Tons) Forecast By Market Taxonomy, 2025 to 2035
      • By Country
        • China
        • Japan
        • South Korea
      • By Product Type
      • By Source Type
      • By Functionality
      • By Product Format
      • By Distribution Channel
    • Market Attractiveness Analysis
      • By Country
      • By Product Type
      • By Source Type
      • By Functionality
      • By Product Format
      • By Distribution Channel
    • Key Takeaways
  17. South Asia & Pacific Market Analysis 2020 to 2024 and Forecast 2025 to 2035, By Country
    • Historical Market Size Value (USD Billion) & Volume (Metric Tons) Trend Analysis By Market Taxonomy, 2020 to 2024
    • Market Size Value (USD Billion) & Volume (Metric Tons) Forecast By Market Taxonomy, 2025 to 2035
      • By Country
        • India
        • Australia & New Zealand
        • ASEAN
        • Rest of SAP
      • By Product Type
      • By Source Type
      • By Functionality
      • By Product Format
      • By Distribution Channel
    • Market Attractiveness Analysis
      • By Country
      • By Product Type
      • By Source Type
      • By Functionality
      • By Product Format
      • By Distribution Channel
    • Key Takeaways
  18. Middle East and Africa Market Analysis 2020 to 2024 and Forecast 2025 to 2035, By Country
    • Historical Market Size Value (USD Billion) & Volume (Metric Tons) Trend Analysis By Market Taxonomy, 2020 to 2024
    • Market Size Value (USD Billion) & Volume (Metric Tons) Forecast By Market Taxonomy, 2025 to 2035
      • By Country
        • GCC Countries
        • Northern Africa
        • South Africa
        • Turkiye
        • Rest of MEA
      • By Product Type
      • By Source Type
      • By Functionality
      • By Product Format
      • By Distribution Channel
    • Market Attractiveness Analysis
      • By Country
      • By Product Type
      • By Source Type
      • By Functionality
      • By Product Format
      • By Distribution Channel
    • Key Takeaways
  19. Key Countries Market Analysis
    • USA
      • Pricing Analysis
      • Market Share Analysis, 2024
        • By Product Type
        • By Source Type
        • By Functionality
        • By Product Format
        • By Distribution Channel
    • Canada
      • Pricing Analysis
      • Market Share Analysis, 2024
        • By Product Type
        • By Source Type
        • By Functionality
        • By Product Format
        • By Distribution Channel
    • Brazil
      • Pricing Analysis
      • Market Share Analysis, 2024
        • By Product Type
        • By Source Type
        • By Functionality
        • By Product Format
        • By Distribution Channel
    • Mexico
      • Pricing Analysis
      • Market Share Analysis, 2024
        • By Product Type
        • By Source Type
        • By Functionality
        • By Product Format
        • By Distribution Channel
    • Argentina
      • Pricing Analysis
      • Market Share Analysis, 2024
        • By Product Type
        • By Source Type
        • By Functionality
        • By Product Format
        • By Distribution Channel
  20. Market Structure Analysis
    • Competition Dashboard
    • Competition Benchmarking
    • Market Share Analysis of Top Players
      • By Regional
      • By Product Type
      • By Source Type
      • By Functionality
      • By Product Format
      • By Distribution Channel
  21. Competition Analysis
    • Competition Deep Dive
      • Thorne Research
        • Overview
        • Product Portfolio
        • Profitability by Market Segments (Product/Age /Sales Channel/Region)
        • Sales Footprint
        • Strategy Overview
          • Marketing Strategy
          • Product Strategy
          • Channel Strategy
      • Life Extension
        • Overview
        • Product Portfolio
        • Profitability by Market Segments (Product/Age /Sales Channel/Region)
        • Sales Footprint
        • Strategy Overview
          • Marketing Strategy
          • Product Strategy
          • Channel Strategy
      • NOW Foods
        • Overview
        • Product Portfolio
        • Profitability by Market Segments (Product/Age /Sales Channel/Region)
        • Sales Footprint
        • Strategy Overview
          • Marketing Strategy
          • Product Strategy
          • Channel Strategy
      • Designs for Health
        • Overview
        • Product Portfolio
        • Profitability by Market Segments (Product/Age /Sales Channel/Region)
        • Sales Footprint
        • Strategy Overview
          • Marketing Strategy
          • Product Strategy
          • Channel Strategy
      • Nootropics Depot
        • Overview
        • Product Portfolio
        • Profitability by Market Segments (Product/Age /Sales Channel/Region)
        • Sales Footprint
        • Strategy Overview
          • Marketing Strategy
          • Product Strategy
          • Channel Strategy
      • Peptides Sciences
        • Overview
        • Product Portfolio
        • Profitability by Market Segments (Product/Age /Sales Channel/Region)
        • Sales Footprint
        • Strategy Overview
          • Marketing Strategy
          • Product Strategy
          • Channel Strategy
      • American Peptide Company
        • Overview
        • Product Portfolio
        • Profitability by Market Segments (Product/Age /Sales Channel/Region)
        • Sales Footprint
        • Strategy Overview
          • Marketing Strategy
          • Product Strategy
          • Channel Strategy
      • Pure Encapsulations
        • Overview
        • Product Portfolio
        • Profitability by Market Segments (Product/Age /Sales Channel/Region)
        • Sales Footprint
        • Strategy Overview
          • Marketing Strategy
          • Product Strategy
          • Channel Strategy
      • BioMed Nutrition
        • Overview
        • Product Portfolio
        • Profitability by Market Segments (Product/Age /Sales Channel/Region)
        • Sales Footprint
        • Strategy Overview
          • Marketing Strategy
          • Product Strategy
          • Channel Strategy
      • Vitamin Research Products
        • Overview
        • Product Portfolio
        • Profitability by Market Segments (Product/Age /Sales Channel/Region)
        • Sales Footprint
        • Strategy Overview
          • Marketing Strategy
          • Product Strategy
          • Channel Strategy
      • Hammer Nutrition
        • Overview
        • Product Portfolio
        • Profitability by Market Segments (Product/Age /Sales Channel/Region)
        • Sales Footprint
        • Strategy Overview
          • Marketing Strategy
          • Product Strategy
          • Channel Strategy
      • Source Naturals
        • Overview
        • Product Portfolio
        • Profitability by Market Segments (Product/Age /Sales Channel/Region)
        • Sales Footprint
        • Strategy Overview
          • Marketing Strategy
          • Product Strategy
          • Channel Strategy
  22. Assumptions & Acronyms Used
  23. Research Methodology

List of Tables

  • Table 1: Global Market Value (USD Billion) Forecast by Region, 2020-2035
  • Table 2: Global Market Volume (Metric Tons) Forecast by Region, 2020-2035
  • Table 3: Global Market Value (USD Billion) Forecast by Product Type, 2020-2035
  • Table 4: Global Market Volume (Metric Tons) Forecast by Product Type, 2020-2035
  • Table 5: Global Market Value (USD Billion) Forecast by Source Type, 2020-2035
  • Table 6: Global Market Volume (Metric Tons) Forecast by Source Type, 2020-2035
  • Table 7: Global Market Value (USD Billion) Forecast by Functionality, 2020-2035
  • Table 8: Global Market Volume (Metric Tons) Forecast by Functionality, 2020-2035
  • Table 9: Global Market Value (USD Billion) Forecast by Product Format, 2020-2035
  • Table 10: Global Market Volume (Metric Tons) Forecast by Product Format, 2020-2035
  • Table 11: Global Market Value (USD Billion) Forecast by Distribution Channel, 2020-2035
  • Table 12: Global Market Volume (Metric Tons) Forecast by Distribution Channel, 2020-2035
  • Table 13: North America Market Value (USD Billion) Forecast by Country, 2020-2035
  • Table 14: North America Market Volume (Metric Tons) Forecast by Country, 2020-2035
  • Table 15: North America Market Value (USD Billion) Forecast by Product Type, 2020-2035
  • Table 16: North America Market Volume (Metric Tons) Forecast by Product Type, 2020-2035
  • Table 17: North America Market Value (USD Billion) Forecast by Source Type, 2020-2035
  • Table 18: North America Market Volume (Metric Tons) Forecast by Source Type, 2020-2035
  • Table 19: North America Market Value (USD Billion) Forecast by Functionality, 2020-2035
  • Table 20: North America Market Volume (Metric Tons) Forecast by Functionality, 2020-2035
  • Table 21: North America Market Value (USD Billion) Forecast by Product Format, 2020-2035
  • Table 22: North America Market Volume (Metric Tons) Forecast by Product Format, 2020-2035
  • Table 23: North America Market Value (USD Billion) Forecast by Distribution Channel, 2020-2035
  • Table 24: North America Market Volume (Metric Tons) Forecast by Distribution Channel, 2020-2035
  • Table 25: Latin America Market Value (USD Billion) Forecast by Country, 2020-2035
  • Table 26: Latin America Market Volume (Metric Tons) Forecast by Country, 2020-2035
  • Table 27: Latin America Market Value (USD Billion) Forecast by Product Type, 2020-2035
  • Table 28: Latin America Market Volume (Metric Tons) Forecast by Product Type, 2020-2035
  • Table 29: Latin America Market Value (USD Billion) Forecast by Source Type, 2020-2035
  • Table 30: Latin America Market Volume (Metric Tons) Forecast by Source Type, 2020-2035
  • Table 31: Latin America Market Value (USD Billion) Forecast by Functionality, 2020-2035
  • Table 32: Latin America Market Volume (Metric Tons) Forecast by Functionality, 2020-2035
  • Table 33: Latin America Market Value (USD Billion) Forecast by Product Format, 2020-2035
  • Table 34: Latin America Market Volume (Metric Tons) Forecast by Product Format, 2020-2035
  • Table 35: Latin America Market Value (USD Billion) Forecast by Distribution Channel, 2020-2035
  • Table 36: Latin America Market Volume (Metric Tons) Forecast by Distribution Channel, 2020-2035
  • Table 37: Western Europe Market Value (USD Billion) Forecast by Country, 2020-2035
  • Table 38: Western Europe Market Volume (Metric Tons) Forecast by Country, 2020-2035
  • Table 39: Western Europe Market Value (USD Billion) Forecast by Product Type, 2020-2035
  • Table 40: Western Europe Market Volume (Metric Tons) Forecast by Product Type, 2020-2035
  • Table 41: Western Europe Market Value (USD Billion) Forecast by Source Type, 2020-2035
  • Table 42: Western Europe Market Volume (Metric Tons) Forecast by Source Type, 2020-2035
  • Table 43: Western Europe Market Value (USD Billion) Forecast by Functionality, 2020-2035
  • Table 44: Western Europe Market Volume (Metric Tons) Forecast by Functionality, 2020-2035
  • Table 45: Western Europe Market Value (USD Billion) Forecast by Product Format, 2020-2035
  • Table 46: Western Europe Market Volume (Metric Tons) Forecast by Product Format, 2020-2035
  • Table 47: Western Europe Market Value (USD Billion) Forecast by Distribution Channel, 2020-2035
  • Table 48: Western Europe Market Volume (Metric Tons) Forecast by Distribution Channel, 2020-2035
  • Table 49: Eastern Europe Market Value (USD Billion) Forecast by Country, 2020-2035
  • Table 50: Eastern Europe Market Volume (Metric Tons) Forecast by Country, 2020-2035
  • Table 51: Eastern Europe Market Value (USD Billion) Forecast by Product Type, 2020-2035
  • Table 52: Eastern Europe Market Volume (Metric Tons) Forecast by Product Type, 2020-2035
  • Table 53: Eastern Europe Market Value (USD Billion) Forecast by Source Type, 2020-2035
  • Table 54: Eastern Europe Market Volume (Metric Tons) Forecast by Source Type, 2020-2035
  • Table 55: Eastern Europe Market Value (USD Billion) Forecast by Functionality, 2020-2035
  • Table 56: Eastern Europe Market Volume (Metric Tons) Forecast by Functionality, 2020-2035
  • Table 57: Eastern Europe Market Value (USD Billion) Forecast by Product Format, 2020-2035
  • Table 58: Eastern Europe Market Volume (Metric Tons) Forecast by Product Format, 2020-2035
  • Table 59: Eastern Europe Market Value (USD Billion) Forecast by Distribution Channel, 2020-2035
  • Table 60: Eastern Europe Market Volume (Metric Tons) Forecast by Distribution Channel, 2020-2035
  • Table 61: East Asia Market Value (USD Billion) Forecast by Country, 2020-2035
  • Table 62: East Asia Market Volume (Metric Tons) Forecast by Country, 2020-2035
  • Table 63: East Asia Market Value (USD Billion) Forecast by Product Type, 2020-2035
  • Table 64: East Asia Market Volume (Metric Tons) Forecast by Product Type, 2020-2035
  • Table 65: East Asia Market Value (USD Billion) Forecast by Source Type, 2020-2035
  • Table 66: East Asia Market Volume (Metric Tons) Forecast by Source Type, 2020-2035
  • Table 67: East Asia Market Value (USD Billion) Forecast by Functionality, 2020-2035
  • Table 68: East Asia Market Volume (Metric Tons) Forecast by Functionality, 2020-2035
  • Table 69: East Asia Market Value (USD Billion) Forecast by Product Format, 2020-2035
  • Table 70: East Asia Market Volume (Metric Tons) Forecast by Product Format, 2020-2035
  • Table 71: East Asia Market Value (USD Billion) Forecast by Distribution Channel, 2020-2035
  • Table 72: East Asia Market Volume (Metric Tons) Forecast by Distribution Channel, 2020-2035
  • Table 73: South Asia & Pacific Market Value (USD Billion) Forecast by Country, 2020-2035
  • Table 74: South Asia & Pacific Market Volume (Metric Tons) Forecast by Country, 2020-2035
  • Table 75: South Asia & Pacific Market Value (USD Billion) Forecast by Product Type, 2020-2035
  • Table 76: South Asia & Pacific Market Volume (Metric Tons) Forecast by Product Type, 2020-2035
  • Table 77: South Asia & Pacific Market Value (USD Billion) Forecast by Source Type, 2020-2035
  • Table 78: South Asia & Pacific Market Volume (Metric Tons) Forecast by Source Type, 2020-2035
  • Table 79: South Asia & Pacific Market Value (USD Billion) Forecast by Functionality, 2020-2035
  • Table 80: South Asia & Pacific Market Volume (Metric Tons) Forecast by Functionality, 2020-2035
  • Table 81: South Asia & Pacific Market Value (USD Billion) Forecast by Product Format, 2020-2035
  • Table 82: South Asia & Pacific Market Volume (Metric Tons) Forecast by Product Format, 2020-2035
  • Table 83: South Asia & Pacific Market Value (USD Billion) Forecast by Distribution Channel, 2020-2035
  • Table 84: South Asia & Pacific Market Volume (Metric Tons) Forecast by Distribution Channel, 2020-2035
  • Table 85: Middle East and Africa Market Value (USD Billion) Forecast by Country, 2020-2035
  • Table 86: Middle East and Africa Market Volume (Metric Tons) Forecast by Country, 2020-2035
  • Table 87: Middle East and Africa Market Value (USD Billion) Forecast by Product Type, 2020-2035
  • Table 88: Middle East and Africa Market Volume (Metric Tons) Forecast by Product Type, 2020-2035
  • Table 89: Middle East and Africa Market Value (USD Billion) Forecast by Source Type, 2020-2035
  • Table 90: Middle East and Africa Market Volume (Metric Tons) Forecast by Source Type, 2020-2035
  • Table 91: Middle East and Africa Market Value (USD Billion) Forecast by Functionality, 2020-2035
  • Table 92: Middle East and Africa Market Volume (Metric Tons) Forecast by Functionality, 2020-2035
  • Table 93: Middle East and Africa Market Value (USD Billion) Forecast by Product Format, 2020-2035
  • Table 94: Middle East and Africa Market Volume (Metric Tons) Forecast by Product Format, 2020-2035
  • Table 95: Middle East and Africa Market Value (USD Billion) Forecast by Distribution Channel, 2020-2035
  • Table 96: Middle East and Africa Market Volume (Metric Tons) Forecast by Distribution Channel, 2020-2035

List of Figures

  • Figure 1: Global Market Volume (Metric Tons) Forecast 2020-2035
  • Figure 2: Global Market Pricing Analysis
  • Figure 3: Global Market Value (USD Billion) Forecast 2020-2035
  • Figure 4: Global Market Value Share and BPS Analysis by Product Type, 2025 and 2035
  • Figure 5: Global Market Y-o-Y Growth Comparison by Product Type, 2025-2035
  • Figure 6: Global Market Attractiveness Analysis by Product Type
  • Figure 7: Global Market Value Share and BPS Analysis by Source Type, 2025 and 2035
  • Figure 8: Global Market Y-o-Y Growth Comparison by Source Type, 2025-2035
  • Figure 9: Global Market Attractiveness Analysis by Source Type
  • Figure 10: Global Market Value Share and BPS Analysis by Functionality, 2025 and 2035
  • Figure 11: Global Market Y-o-Y Growth Comparison by Functionality, 2025-2035
  • Figure 12: Global Market Attractiveness Analysis by Functionality
  • Figure 13: Global Market Value Share and BPS Analysis by Product Format, 2025 and 2035
  • Figure 14: Global Market Y-o-Y Growth Comparison by Product Format, 2025-2035
  • Figure 15: Global Market Attractiveness Analysis by Product Format
  • Figure 16: Global Market Value Share and BPS Analysis by Distribution Channel, 2025 and 2035
  • Figure 17: Global Market Y-o-Y Growth Comparison by Distribution Channel, 2025-2035
  • Figure 18: Global Market Attractiveness Analysis by Distribution Channel
  • Figure 19: Global Market Value (USD Billion) Share and BPS Analysis by Region, 2025 and 2035
  • Figure 20: Global Market Y-o-Y Growth Comparison by Region, 2025-2035
  • Figure 21: Global Market Attractiveness Analysis by Region
  • Figure 22: North America Market Incremental $ Opportunity, 2025-2035
  • Figure 23: Latin America Market Incremental $ Opportunity, 2025-2035
  • Figure 24: Western Europe Market Incremental $ Opportunity, 2025-2035
  • Figure 25: Eastern Europe Market Incremental $ Opportunity, 2025-2035
  • Figure 26: East Asia Market Incremental $ Opportunity, 2025-2035
  • Figure 27: South Asia & Pacific Market Incremental $ Opportunity, 2025-2035
  • Figure 28: Middle East and Africa Market Incremental $ Opportunity, 2025-2035
  • Figure 29: North America Market Value Share and BPS Analysis by Country, 2025 and 2035
  • Figure 30: North America Market Value Share and BPS Analysis by Product Type, 2025 and 2035
  • Figure 31: North America Market Y-o-Y Growth Comparison by Product Type, 2025-2035
  • Figure 32: North America Market Attractiveness Analysis by Product Type
  • Figure 33: North America Market Value Share and BPS Analysis by Source Type, 2025 and 2035
  • Figure 34: North America Market Y-o-Y Growth Comparison by Source Type, 2025-2035
  • Figure 35: North America Market Attractiveness Analysis by Source Type
  • Figure 36: North America Market Value Share and BPS Analysis by Functionality, 2025 and 2035
  • Figure 37: North America Market Y-o-Y Growth Comparison by Functionality, 2025-2035
  • Figure 38: North America Market Attractiveness Analysis by Functionality
  • Figure 39: North America Market Value Share and BPS Analysis by Product Format, 2025 and 2035
  • Figure 40: North America Market Y-o-Y Growth Comparison by Product Format, 2025-2035
  • Figure 41: North America Market Attractiveness Analysis by Product Format
  • Figure 42: North America Market Value Share and BPS Analysis by Distribution Channel, 2025 and 2035
  • Figure 43: North America Market Y-o-Y Growth Comparison by Distribution Channel, 2025-2035
  • Figure 44: North America Market Attractiveness Analysis by Distribution Channel
  • Figure 45: Latin America Market Value Share and BPS Analysis by Country, 2025 and 2035
  • Figure 46: Latin America Market Value Share and BPS Analysis by Product Type, 2025 and 2035
  • Figure 47: Latin America Market Y-o-Y Growth Comparison by Product Type, 2025-2035
  • Figure 48: Latin America Market Attractiveness Analysis by Product Type
  • Figure 49: Latin America Market Value Share and BPS Analysis by Source Type, 2025 and 2035
  • Figure 50: Latin America Market Y-o-Y Growth Comparison by Source Type, 2025-2035
  • Figure 51: Latin America Market Attractiveness Analysis by Source Type
  • Figure 52: Latin America Market Value Share and BPS Analysis by Functionality, 2025 and 2035
  • Figure 53: Latin America Market Y-o-Y Growth Comparison by Functionality, 2025-2035
  • Figure 54: Latin America Market Attractiveness Analysis by Functionality
  • Figure 55: Latin America Market Value Share and BPS Analysis by Product Format, 2025 and 2035
  • Figure 56: Latin America Market Y-o-Y Growth Comparison by Product Format, 2025-2035
  • Figure 57: Latin America Market Attractiveness Analysis by Product Format
  • Figure 58: Latin America Market Value Share and BPS Analysis by Distribution Channel, 2025 and 2035
  • Figure 59: Latin America Market Y-o-Y Growth Comparison by Distribution Channel, 2025-2035
  • Figure 60: Latin America Market Attractiveness Analysis by Distribution Channel
  • Figure 61: Western Europe Market Value Share and BPS Analysis by Country, 2025 and 2035
  • Figure 62: Western Europe Market Value Share and BPS Analysis by Product Type, 2025 and 2035
  • Figure 63: Western Europe Market Y-o-Y Growth Comparison by Product Type, 2025-2035
  • Figure 64: Western Europe Market Attractiveness Analysis by Product Type
  • Figure 65: Western Europe Market Value Share and BPS Analysis by Source Type, 2025 and 2035
  • Figure 66: Western Europe Market Y-o-Y Growth Comparison by Source Type, 2025-2035
  • Figure 67: Western Europe Market Attractiveness Analysis by Source Type
  • Figure 68: Western Europe Market Value Share and BPS Analysis by Functionality, 2025 and 2035
  • Figure 69: Western Europe Market Y-o-Y Growth Comparison by Functionality, 2025-2035
  • Figure 70: Western Europe Market Attractiveness Analysis by Functionality
  • Figure 71: Western Europe Market Value Share and BPS Analysis by Product Format, 2025 and 2035
  • Figure 72: Western Europe Market Y-o-Y Growth Comparison by Product Format, 2025-2035
  • Figure 73: Western Europe Market Attractiveness Analysis by Product Format
  • Figure 74: Western Europe Market Value Share and BPS Analysis by Distribution Channel, 2025 and 2035
  • Figure 75: Western Europe Market Y-o-Y Growth Comparison by Distribution Channel, 2025-2035
  • Figure 76: Western Europe Market Attractiveness Analysis by Distribution Channel
  • Figure 77: Eastern Europe Market Value Share and BPS Analysis by Country, 2025 and 2035
  • Figure 78: Eastern Europe Market Value Share and BPS Analysis by Product Type, 2025 and 2035
  • Figure 79: Eastern Europe Market Y-o-Y Growth Comparison by Product Type, 2025-2035
  • Figure 80: Eastern Europe Market Attractiveness Analysis by Product Type
  • Figure 81: Eastern Europe Market Value Share and BPS Analysis by Source Type, 2025 and 2035
  • Figure 82: Eastern Europe Market Y-o-Y Growth Comparison by Source Type, 2025-2035
  • Figure 83: Eastern Europe Market Attractiveness Analysis by Source Type
  • Figure 84: Eastern Europe Market Value Share and BPS Analysis by Functionality, 2025 and 2035
  • Figure 85: Eastern Europe Market Y-o-Y Growth Comparison by Functionality, 2025-2035
  • Figure 86: Eastern Europe Market Attractiveness Analysis by Functionality
  • Figure 87: Eastern Europe Market Value Share and BPS Analysis by Product Format, 2025 and 2035
  • Figure 88: Eastern Europe Market Y-o-Y Growth Comparison by Product Format, 2025-2035
  • Figure 89: Eastern Europe Market Attractiveness Analysis by Product Format
  • Figure 90: Eastern Europe Market Value Share and BPS Analysis by Distribution Channel, 2025 and 2035
  • Figure 91: Eastern Europe Market Y-o-Y Growth Comparison by Distribution Channel, 2025-2035
  • Figure 92: Eastern Europe Market Attractiveness Analysis by Distribution Channel
  • Figure 93: East Asia Market Value Share and BPS Analysis by Country, 2025 and 2035
  • Figure 94: East Asia Market Value Share and BPS Analysis by Product Type, 2025 and 2035
  • Figure 95: East Asia Market Y-o-Y Growth Comparison by Product Type, 2025-2035
  • Figure 96: East Asia Market Attractiveness Analysis by Product Type
  • Figure 97: East Asia Market Value Share and BPS Analysis by Source Type, 2025 and 2035
  • Figure 98: East Asia Market Y-o-Y Growth Comparison by Source Type, 2025-2035
  • Figure 99: East Asia Market Attractiveness Analysis by Source Type
  • Figure 100: East Asia Market Value Share and BPS Analysis by Functionality, 2025 and 2035
  • Figure 101: East Asia Market Y-o-Y Growth Comparison by Functionality, 2025-2035
  • Figure 102: East Asia Market Attractiveness Analysis by Functionality
  • Figure 103: East Asia Market Value Share and BPS Analysis by Product Format, 2025 and 2035
  • Figure 104: East Asia Market Y-o-Y Growth Comparison by Product Format, 2025-2035
  • Figure 105: East Asia Market Attractiveness Analysis by Product Format
  • Figure 106: East Asia Market Value Share and BPS Analysis by Distribution Channel, 2025 and 2035
  • Figure 107: East Asia Market Y-o-Y Growth Comparison by Distribution Channel, 2025-2035
  • Figure 108: East Asia Market Attractiveness Analysis by Distribution Channel
  • Figure 109: South Asia & Pacific Market Value Share and BPS Analysis by Country, 2025 and 2035
  • Figure 110: South Asia & Pacific Market Value Share and BPS Analysis by Product Type, 2025 and 2035
  • Figure 111: South Asia & Pacific Market Y-o-Y Growth Comparison by Product Type, 2025-2035
  • Figure 112: South Asia & Pacific Market Attractiveness Analysis by Product Type
  • Figure 113: South Asia & Pacific Market Value Share and BPS Analysis by Source Type, 2025 and 2035
  • Figure 114: South Asia & Pacific Market Y-o-Y Growth Comparison by Source Type, 2025-2035
  • Figure 115: South Asia & Pacific Market Attractiveness Analysis by Source Type
  • Figure 116: South Asia & Pacific Market Value Share and BPS Analysis by Functionality, 2025 and 2035
  • Figure 117: South Asia & Pacific Market Y-o-Y Growth Comparison by Functionality, 2025-2035
  • Figure 118: South Asia & Pacific Market Attractiveness Analysis by Functionality
  • Figure 119: South Asia & Pacific Market Value Share and BPS Analysis by Product Format, 2025 and 2035
  • Figure 120: South Asia & Pacific Market Y-o-Y Growth Comparison by Product Format, 2025-2035
  • Figure 121: South Asia & Pacific Market Attractiveness Analysis by Product Format
  • Figure 122: South Asia & Pacific Market Value Share and BPS Analysis by Distribution Channel, 2025 and 2035
  • Figure 123: South Asia & Pacific Market Y-o-Y Growth Comparison by Distribution Channel, 2025-2035
  • Figure 124: South Asia & Pacific Market Attractiveness Analysis by Distribution Channel
  • Figure 125: Middle East and Africa Market Value Share and BPS Analysis by Country, 2025 and 2035
  • Figure 126: Middle East and Africa Market Value Share and BPS Analysis by Product Type, 2025 and 2035
  • Figure 127: Middle East and Africa Market Y-o-Y Growth Comparison by Product Type, 2025-2035
  • Figure 128: Middle East and Africa Market Attractiveness Analysis by Product Type
  • Figure 129: Middle East and Africa Market Value Share and BPS Analysis by Source Type, 2025 and 2035
  • Figure 130: Middle East and Africa Market Y-o-Y Growth Comparison by Source Type, 2025-2035
  • Figure 131: Middle East and Africa Market Attractiveness Analysis by Source Type
  • Figure 132: Middle East and Africa Market Value Share and BPS Analysis by Functionality, 2025 and 2035
  • Figure 133: Middle East and Africa Market Y-o-Y Growth Comparison by Functionality, 2025-2035
  • Figure 134: Middle East and Africa Market Attractiveness Analysis by Functionality
  • Figure 135: Middle East and Africa Market Value Share and BPS Analysis by Product Format, 2025 and 2035
  • Figure 136: Middle East and Africa Market Y-o-Y Growth Comparison by Product Format, 2025-2035
  • Figure 137: Middle East and Africa Market Attractiveness Analysis by Product Format
  • Figure 138: Middle East and Africa Market Value Share and BPS Analysis by Distribution Channel, 2025 and 2035
  • Figure 139: Middle East and Africa Market Y-o-Y Growth Comparison by Distribution Channel, 2025-2035
  • Figure 140: Middle East and Africa Market Attractiveness Analysis by Distribution Channel
  • Figure 141: Global Market - Tier Structure Analysis
  • Figure 142: Global Market - Company Share Analysis

Frequently Asked Questions

What is the projected size of the peptide supplements market in 2025?

The market is valued at USD 4.1 billion in 2025.

What is the outlook on peptide supplements demand by 2035?

The market is forecasted to reach USD 11.2 billion by 2035, reflecting a CAGR of 10.4%.

Which segment leads the peptide supplements market by product format in 2025?

Tablets and capsules will lead the product format segment, accounting for 31.6% of the global market share in 2025.

What is the top distribution channel for the peptide supplements market in 2025?

Online retail will dominate the distribution channel segment with a 39.2% share in 2025.

Which country is projected to have the fastest-growing peptide supplements market?

The USA is projected to grow at the fastest rate, with a CAGR of 11.3% from 2025 to 2035.

Explore Similar Insights

Future Market Insights

Peptide Supplements Market