Collagen Peptide Market Forecast and Outlook 2025 to 2035

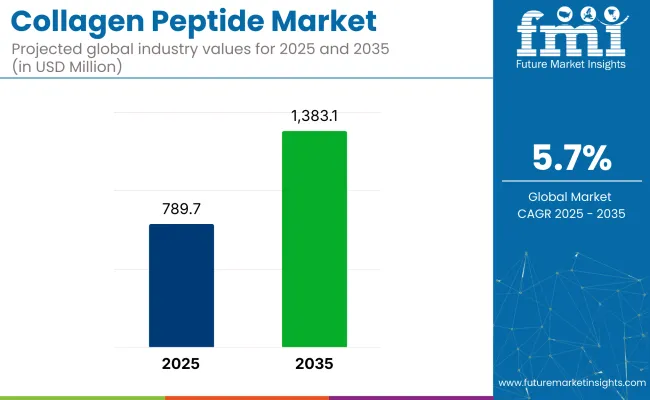
The global collagen peptide market is valued at USD 789.7 million in 2025 and is expected to reach USD 1,383.1 million by 2035, reflecting a CAGR of 5.7%. Growth is expected to be driven by increasing demand for health and wellness products, the expansion of nutraceutical applications, and the rising popularity of marine and poultry-based collagen sources due to bioavailability and sustainability benefits.
Quick Stats for Collagen Peptide Market

  • Market Value (2025): USD 789.7 million
  • Forecast Value (2035): USD 1,383.1 million
  • Forecast CAGR: 5.7%
  • Form Leader in 2025: Dry Collagen (73% Market Share)
  • Top Application Segment: Nutritional Products (42% Market Share)
  • Key Growth Region: North America (USA fastest-growing market with 5.8% CAGR)

Collagen Peptide Market

Metric Values
Estimated Size (2025E) USD 789.7 million
Projected Value (2035F) USD 1,383.1 million
CAGR (2025 to 2035) 5.7%

Moreover, the market is anticipated to benefit from the rapid adoption of collagen peptides in functional foods and beverages aimed at improving joint health, skin elasticity, and muscle repair.

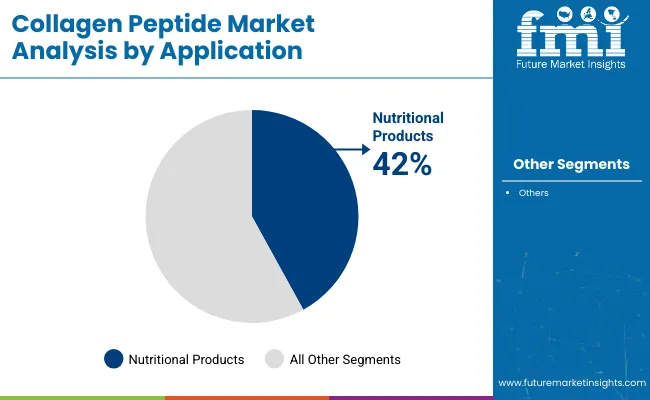
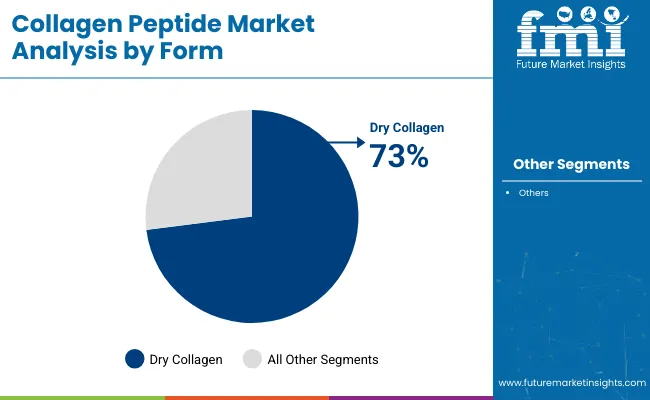
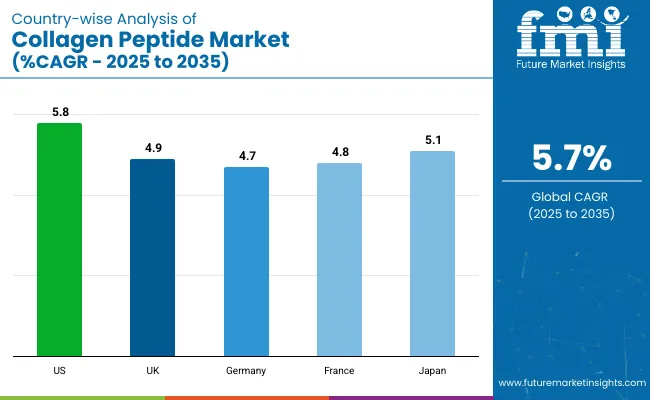
In 2025, the USA is likely to hold the largest market share, expanding at a CAGR of 5.8%. Meanwhile, Japan is projected to witness growth with a CAGR of 5.1%, followed closely by the UK at 4.9%. Within application segments, nutritional products are set to dominate with a 42% of the market share, driven by supplements and functional foods. Meanwhile, the dry form of collagen is expected to dominate the form segment with a prominent market share of 73%.

The market accounts for a small but growing share within its parent markets. It is estimated to represent approximately 3-4% of the global protein ingredients market, driven by its specialized functional benefits. Within the nutraceutical ingredients market, collagen peptides hold around 5-6% share, mainly due to their integration into beauty and joint health supplements.

In the food & beverage ingredients market, the share is relatively low at below 1%, given the broader scope of this sector. However, collagen peptides are increasingly capturing a notable proportion within the cosmeceuticals market, accounting for approximately 8-10% share due to high demand for anti-aging applications.

Collagen Peptide Market Analysis by Top Investment Segments

The global market is segmented by application type, source, form, and region. By application type, it includes nutritional products, cosmetics & personal care products, food & beverages, and pharmaceuticals. By source, it is segmented into marine & poultry, bovine, and porcine.

By form, it is segmented as dry and liquid. By region, it covers North America, Latin America, Western Europe, Eastern Europe, Balkans & Baltic, Russia & Belarus, Central Asia, East Asia, South Asia & Pacific, and Middle East & Africa.

By Application Type, Nutritional Products Account for 42% of the Market Share

Nutritional products are anticipated to remain the most lucrative application segment owing to their extensive usage in supplements, protein bars, and functional beverages, accounting for a 42% market share by 2035. This growth is driven by rising consumer preference for protein-rich diets and collagen’s benefits for joint health and skin elasticity.
  • Supplements and bars remain key drivers
  • Cosmetics adopting collagen for anti-aging
  • Pharmaceuticals utilising peptides in bone health

Collagen Peptide Market Analysis By Application

By Source, Marine & Poultry Accounts for 19% of the Market Share

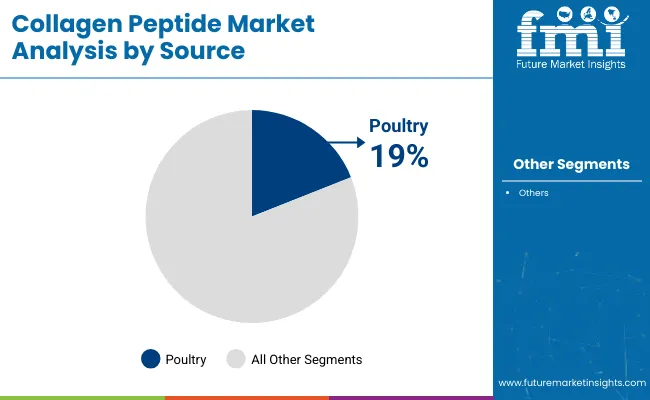
Marine & poultry sources are projected to experience the fastest growth, capturing a market share of 19% by 2035. Their rise is attributed to consumer preference for non-bovine sources driven by sustainability, dietary restrictions, and superior bioavailability. Sustainable and non-mammalian sources preferred
  • Bovine is still dominant in volume supply
  • Porcine is limited by dietary restrictions

Collagen Peptide Market Analysis By Source

By Form, Dry Collagen Accounts for 73% of the Market Share

Dry form is set to dominate the market with a share of 73% by 2035 due to its stability, easy transportation, and extended shelf life. Liquid forms are growing in ready-to-drink nutraceutical beverages, although they pose storage challenges.
  • Preferred for supplements and powder drinks
  • Liquid is gaining traction in RTD beverages
  • Dry offers better storage and logistics benefits

Collagen Peptide Market Analysis By Form

Top Collagen Peptide Market Dynamics

Recent Trends in the Collagen Peptide Market

  • Increasing incorporation of collagen peptides into functional foods and beverages for improved nutritional profiles.
  • Rising consumer demand for marine and poultry-based collagen due to sustainability and bioavailability advantages.

Challenges Facing the Collagen Peptide Market
  • Limited scalability for small and regional players due to high production costs and resource constraints.
  • Cultural and dietary restrictions are hindering the adoption of bovine and porcine collagen sources in several countries.

Analyzing Top Countries Manufacturing and Supplying Collagen Peptides

Collagen Peptide Market Country Wise Analysis

Between 2025 and 2035, the USA is projected to lead with a CAGR of 5.8%, driven by its strong nutraceutical market and widespread dietary supplement consumption. Japan follows closely with a CAGR of 5.1%, reflecting high demand for beauty and functional beverage applications.

France and the UK are expected to grow at 4.8% and 4.9% respectively, supported by beauty, skincare, and sports nutrition trends. Germany records the lowest growth among these countries at 4.7%, despite its strong pharmaceutical and nutraceutical sectors. Overall, the USA remains the fastest-growing among these top collagen peptide markets.

The report covers an in-depth analysis of 40+ countries; five top-performing OECD countries are highlighted below.

United States Collagen Peptides Market Analysis

The collagen peptide revenue in the USA is projected to grow at a CAGR of 5.8% from 2025 to 2035. Growth is expected to be driven by rising consumer awareness regarding health, wellness, and anti-aging benefits associated with collagen supplementation. The market is also supported by a mature nutraceutical sector and widespread consumption of dietary supplements. Moreover, the increasing integration of collagen peptides into ready-to-drink beverages and protein bars has broadened its consumer base.

  • Growing demand for collagen peptides in functional foods and beverages.
  • Rising popularity of anti-aging supplements among millennials and seniors.
  • Strong market presence of premium collagen peptide brands.

Collagen Peptides Demand Analysis in the UK

The revenue from the collagen peptide market in the UK is anticipated to rise at a CAGR of 4.9% from 2025 to 2035. Growth will be driven by increasing consumer focus on beauty and skin health, coupled with dietary trends emphasizing protein-rich and clean-label products.

Collagen peptides are being increasingly adopted in nutraceutical formulations targeting joint health and sports recovery. Moreover, regulatory frameworks promoting food safety and ingredient transparency support the market, while online retail platforms continue expanding collagen product accessibility across diverse consumer segments.

  • Rising use of collagen peptides in sports nutrition and recovery supplements.
  • Growing e-commerce penetration supports collagen peptide sales.
  • Demand is driven by consumers seeking natural anti-aging solutions.

Germany Collagen Peptides Sales Analysis

The sales of collagen peptides in Germany are estimated to flourish at a CAGR of 4.7% from 2025 to 2035. Growth is expected due to the country’s strong pharmaceutical and nutraceutical sectors, coupled with advanced R&D capabilities supporting product innovation.

German consumers prioritize scientifically backed products, leading to increasing adoption of collagen peptides for joint care and beauty applications.. Stringent quality standards and clean-label preferences drive demand for premium formulations, while collaborations between pharmaceutical companies and research institutions aid market expansion.

  • High trust in scientifically validated collagen peptide products.
  • Increasing collagen usage in functional foods and beverages.
  • Strong R&D ecosystem supporting innovative peptide formulations.

France Collagen Peptides Market Analysis

The revenue from collagen peptides in France is expected to expand at a CAGR of 4.8% from 2025 to 2035. Growth will be supported by rising consumer focus on beauty, skin care, and overall wellness. Collagen peptides are increasingly being used in premium cosmetic formulations and dietary supplements targeting anti-aging benefits.

The French nutraceutical sector’s emphasis on natural and sustainably sourced ingredients further drives this trend. Market expansion is facilitated by clean-label trends and partnerships between food, pharma, and beauty companies to develop multifunctional collagen-based products.

  • Strong demand for marine-based collagen peptides in beauty products.
  • Consumer inclination towards sustainably sourced collagen.
  • Increasing collagen integration in anti-aging nutraceuticals.

Japan Collagen Peptides Market Analysis

The collagen peptide market in Japan is predicted to rise at a CAGR of 5.1% from 2025 to 2035. Growth is driven by the cultural emphasis on beauty, youthfulness, and healthy aging. Collagen peptides are widely incorporated into functional beverages, supplements, and beauty products targeting skin elasticity and joint health.

Japanese companies continue to innovate with marine collagen products and ready-to-drink formulations. Additionally, strong marketing strategies combined with consumer trust in collagen’s effectiveness contribute to robust market demand across age groups.

  • High adoption of collagen peptides in beauty and skincare products.
  • Consumer preference for marine collagen due to its superior bioavailability.
  • Innovation in ready-to-drink collagen beverages is strengthening market growth.

Leading Collagen Peptide Suppliers

The market is moderately consolidated, with a few global leaders accounting for a significant share of revenues. Tier-one companies such as Darling Ingredients Inc., Gelita AG, and Nitta Gelatin Inc. compete based on product innovation, diversified sourcing, and expansion into personalized nutrition segments. These firms leverage strong R&D capabilities and global supply chains to maintain dominance, while mid-tier players focus on regional markets with specialized offerings in marine and poultry collagen peptides.

Company strategies revolve around sustainable sourcing, advanced extraction technologies, and premium segment targeting in beauty, nutraceutical, and sports nutrition applications. Leading players are investing in clinical research to validate health claims and collaborating with food and pharma companies to launch multifunctional collagen peptide formulations. Strategic acquisitions remain key, enabling firms to strengthen market presence, diversify portfolios, and enhance production capabilities to meet rising global demand.

Recent Collagen Peptide Market News

  • In May 2025, Darling Ingredients announced a major partnership with Tessenderlo Group to combine their collagen and gelatin businesses into a new company, Nextida™, aimed at accelerating growth in the collagen-based health, wellness, and nutrition sector.

Collagen Peptide Market Report Scope

Report Attributes Details
Current Total Market Size (2025) USD 789.7 million
Projected Market Size (2035) USD 1,383.1 million
CAGR (2025 to 2035) 5.7%
Base Year for Estimation 2024
Historical Period 2020 to 2024
Projections Period 2025 to 2035
Market Analysis Parameters Revenue in USD million/Volume in Units
By Application Type Nutritional Products, Cosmetics & Personal Care Products, Food & Beverages, Pharmaceuticals
By Source Marine & Poultry, Bovine, Porcine
By Form Dry, Liquid
Regions Covered North America, Latin America, Western Europe, Eastern Europe, Balkans & Baltic, Russia & Belarus, Central Asia, East Asia, South Asia & Pacific, Middle East & Africa
Countries Covered United States, Canada, United Kingdom, Germany, France, China, Japan, South Korea, Brazil, Australia
Key Players Darling Ingredients Inc., Gelita AG, Nitta Gelatin Inc., Tessenderlo Group, Holista Colltech Limited, Gelnex, BioCell Technology LLC, Italgelatine S.p.A., Ewald-Gelatine GmbH, Kewpie Corporation, Amicogen, Capsugel, Lapi Gelatine S.p.A., Junca Gelatines S.L., Danish Crown
Additional Attributes Dollar sales by value, market share analysis by region, and country-wise analysis

Key Segments of Collagen Peptide Report

By Application Type:

As per Application Type, the industry has been categorized into Nutritional Products, Cosmetics & Personal Care Products, Food & Beverages, and Pharmaceuticals.

By Source:

As per Source, the industry has been categorized into Marine & Poultry, Bovine, and Porcine.

By Form:

As per Form, the industry has been categorized into Dry and Liquid.

By Region:

Industry analysis has been carried out in key countries of North America, Latin America, Western Europe Eastern Europe, Balkans & Baltic, Russia & Belarus, Central Asia, East Asia, South Asia & Pacific, and Middle East & Africa.

Table of Content

  1. Executive Summary
    • Global Market Outlook
    • Demand-side Trends
    • Supply-side Trends
    • Technology Roadmap Analysis
    • Analysis and Recommendations
  2. Market Overview
    • Market Coverage / Taxonomy
    • Market Definition / Scope / Limitations
  3. Market Background
    • Market Dynamics
      • Drivers
      • Restraints
      • Opportunity
      • Trends
    • Scenario Forecast
      • Demand in Optimistic Scenario
      • Demand in Likely Scenario
      • Demand in Conservative Scenario
    • Opportunity Map Analysis
    • Product Life Cycle Analysis
    • Supply Chain Analysis
      • Supply Side Participants and their Roles
        • Producers
        • Mid-Level Participants (Traders/ Agents/ Brokers)
        • Wholesalers and Distributors
      • Value Added and Value Created at Node in the Supply Chain
      • List of Raw Material Suppliers
      • List of Existing and Potential Buyer’s
    • Investment Feasibility Matrix
    • Value Chain Analysis
      • Profit Margin Analysis
      • Wholesalers and Distributors
      • Retailers
    • PESTLE and Porter’s Analysis
    • Regulatory Landscape
      • By Key Regions
      • By Key Countries
    • Regional Parent Market Outlook
    • Production and Consumption Statistics
    • Import and Export Statistics
  4. Global Market Analysis 2020 to 2024 and Forecast, 2025 to 2035
    • Historical Market Size Value (USD Million) & Volume (units) Analysis, 2020 to 2024
    • Current and Future Market Size Value (USD Million) & Volume (units) Projections, 2025 to 2035
      • Y-o-Y Growth Trend Analysis
      • Absolute $ Opportunity Analysis
  5. Global Market Pricing Analysis 2020 to 2024 and Forecast 2025 to 2035
  6. Global Market Analysis 2020 to 2024 and Forecast 2025 to 2035, By Application Type
    • Introduction / Key Findings
    • Historical Market Size Value (USD Million) & Volume (units) Analysis By Application Type, 2020 to 2024
    • Current and Future Market Size Value (USD Million) & Volume (units) Analysis and Forecast By Application Type, 2025 to 2035
      • Nutritional Products
      • Cosmetics & Personal Care Products
      • Food & Beverages
      • Pharmaceuticals
    • Y-o-Y Growth Trend Analysis By Application Type, 2020 to 2024
    • Absolute $ Opportunity Analysis By Application Type, 2025 to 2035
  7. Global Market Analysis 2020 to 2024 and Forecast 2025 to 2035, By Source
    • Introduction / Key Findings
    • Historical Market Size Value (USD Million) & Volume (units) Analysis By Source, 2020 to 2024
    • Current and Future Market Size Value (USD Million) & Volume (units) Analysis and Forecast By Source, 2025 to 2035
      • Marine & Poultry
      • Bovine
      • Porcine
    • Y-o-Y Growth Trend Analysis By Source, 2020 to 2024
    • Absolute $ Opportunity Analysis By Source, 2025 to 2035
  8. Global Market Analysis 2020 to 2024 and Forecast 2025 to 2035, By Form
    • Introduction / Key Findings
    • Historical Market Size Value (USD Million) & Volume (units) Analysis By Form, 2020 to 2024
    • Current and Future Market Size Value (USD Million) & Volume (units) Analysis and Forecast By Form, 2025 to 2035
      • Dry
      • Liquid
    • Y-o-Y Growth Trend Analysis By Form, 2020 to 2024
    • Absolute $ Opportunity Analysis By Form, 2025 to 2035
  9. Global Market Analysis 2020 to 2024 and Forecast 2025 to 2035, By Region
    • Introduction
    • Historical Market Size Value (USD Million) & Volume (units) Analysis By Region, 2020 to 2024
    • Current Market Size Value (USD Million) & Volume (units) Analysis and Forecast By Region, 2025 to 2035
      • North America
      • Latin America
      • Western Europe
      • Eastern Europe
      • East Asia
      • South Asia & Pacific
      • Middle East and Africa
    • Market Attractiveness Analysis By Region
  10. North America Market Analysis 2020 to 2024 and Forecast 2025 to 2035, By Country
    • Historical Market Size Value (USD Million) & Volume (units) Trend Analysis By Market Taxonomy, 2020 to 2024
    • Market Size Value (USD Million) & Volume (units) Forecast By Market Taxonomy, 2025 to 2035
      • By Country
        • USA
        • Canada
        • Mexico
      • By Application Type
      • By Source
      • By Form
    • Market Attractiveness Analysis
      • By Country
      • By Application Type
      • By Source
      • By Form
    • Key Takeaways
  11. Latin America Market Analysis 2020 to 2024 and Forecast 2025 to 2035, By Country
    • Historical Market Size Value (USD Million) & Volume (units) Trend Analysis By Market Taxonomy, 2020 to 2024
    • Market Size Value (USD Million) & Volume (units) Forecast By Market Taxonomy, 2025 to 2035
      • By Country
        • Brazil
        • Argentina
        • Rest of LATAM
      • By Application Type
      • By Source
      • By Form
    • Market Attractiveness Analysis
      • By Country
      • By Application Type
      • By Source
      • By Form
    • Key Takeaways
  12. Western Europe Market Analysis 2020 to 2024 and Forecast 2025 to 2035, By Country
    • Historical Market Size Value (USD Million) & Volume (units) Trend Analysis By Market Taxonomy, 2020 to 2024
    • Market Size Value (USD Million) & Volume (units) Forecast By Market Taxonomy, 2025 to 2035
      • By Country
        • Germany
        • Italy
        • France
        • UK
        • Spain
        • BENELUX
        • Nordic
        • Rest of W.Europe
      • By Application Type
      • By Source
      • By Form
    • Market Attractiveness Analysis
      • By Country
      • By Application Type
      • By Source
      • By Form
    • Key Takeaways
  13. Eastern Europe Market Analysis 2020 to 2024 and Forecast 2025 to 2035, By Country
    • Historical Market Size Value (USD Million) & Volume (units) Trend Analysis By Market Taxonomy, 2020 to 2024
    • Market Size Value (USD Million) & Volume (units) Forecast By Market Taxonomy, 2025 to 2035
      • By Country
        • Russia
        • Hungary
        • Poland
        • Balkan & Baltics
        • Rest of E. Europe
      • By Application Type
      • By Source
      • By Form
    • Market Attractiveness Analysis
      • By Country
      • By Application Type
      • By Source
      • By Form
    • Key Takeaways
  14. East Asia Market Analysis 2020 to 2024 and Forecast 2025 to 2035, By Country
    • Historical Market Size Value (USD Million) & Volume (units) Trend Analysis By Market Taxonomy, 2020 to 2024
    • Market Size Value (USD Million) & Volume (units) Forecast By Market Taxonomy, 2025 to 2035
      • By Country
        • China
        • Japan
        • South Korea
      • By Application Type
      • By Source
      • By Form
    • Market Attractiveness Analysis
      • By Country
      • By Application Type
      • By Source
      • By Form
    • Key Takeaways
  15. South Asia & Pacific Market Analysis 2020 to 2024 and Forecast 2025 to 2035, By Country
    • Historical Market Size Value (USD Million) & Volume (units) Trend Analysis By Market Taxonomy, 2020 to 2024
    • Market Size Value (USD Million) & Volume (units) Forecast By Market Taxonomy, 2025 to 2035
      • By Country
        • India
        • Australia & New Zealand
        • ASEAN
        • Rest of SAP
      • By Application Type
      • By Source
      • By Form
    • Market Attractiveness Analysis
      • By Country
      • By Application Type
      • By Source
      • By Form
    • Key Takeaways
  16. Middle East and Africa Market Analysis 2020 to 2024 and Forecast 2025 to 2035, By Country
    • Historical Market Size Value (USD Million) & Volume (units) Trend Analysis By Market Taxonomy, 2020 to 2024
    • Market Size Value (USD Million) & Volume (units) Forecast By Market Taxonomy, 2025 to 2035
      • By Country
        • GCC Countries
        • Northern Africa
        • South Africa
        • Turkiye
        • Rest of MEA
      • By Application Type
      • By Source
      • By Form
    • Market Attractiveness Analysis
      • By Country
      • By Application Type
      • By Source
      • By Form
    • Key Takeaways
  17. Key Countries Market Analysis
    • USA
      • Pricing Analysis
      • Market Share Analysis, 2024
        • By Application Type
        • By Source
        • By Form
    • Canada
      • Pricing Analysis
      • Market Share Analysis, 2024
        • By Application Type
        • By Source
        • By Form
    • Brazil
      • Pricing Analysis
      • Market Share Analysis, 2024
        • By Application Type
        • By Source
        • By Form
    • Mexico
      • Pricing Analysis
      • Market Share Analysis, 2024
        • By Application Type
        • By Source
        • By Form
    • Argentina
      • Pricing Analysis
      • Market Share Analysis, 2024
        • By Application Type
        • By Source
        • By Form
  18. Market Structure Analysis
    • Competition Dashboard
    • Competition Benchmarking
    • Market Share Analysis of Top Players
      • By Regional
      • By Application Type
      • By Source
      • By Form
  19. Competition Analysis
    • Competition Deep Dive
      • Darling Ingredients Inc.
        • Overview
        • Product Portfolio
        • Profitability by Market Segments (Product/Age /Sales Channel/Region)
        • Sales Footprint
        • Strategy Overview
          • Marketing Strategy
          • Product Strategy
          • Channel Strategy
      • Gelita AG
        • Overview
        • Product Portfolio
        • Profitability by Market Segments (Product/Age /Sales Channel/Region)
        • Sales Footprint
        • Strategy Overview
          • Marketing Strategy
          • Product Strategy
          • Channel Strategy
      • Nitta Gelatin Inc.
        • Overview
        • Product Portfolio
        • Profitability by Market Segments (Product/Age /Sales Channel/Region)
        • Sales Footprint
        • Strategy Overview
          • Marketing Strategy
          • Product Strategy
          • Channel Strategy
      • Tessenderlo Group
        • Overview
        • Product Portfolio
        • Profitability by Market Segments (Product/Age /Sales Channel/Region)
        • Sales Footprint
        • Strategy Overview
          • Marketing Strategy
          • Product Strategy
          • Channel Strategy
      • Holista Colltech Limited
        • Overview
        • Product Portfolio
        • Profitability by Market Segments (Product/Age /Sales Channel/Region)
        • Sales Footprint
        • Strategy Overview
          • Marketing Strategy
          • Product Strategy
          • Channel Strategy
      • Gelnex
        • Overview
        • Product Portfolio
        • Profitability by Market Segments (Product/Age /Sales Channel/Region)
        • Sales Footprint
        • Strategy Overview
          • Marketing Strategy
          • Product Strategy
          • Channel Strategy
      • BioCell Technology LLC
        • Overview
        • Product Portfolio
        • Profitability by Market Segments (Product/Age /Sales Channel/Region)
        • Sales Footprint
        • Strategy Overview
          • Marketing Strategy
          • Product Strategy
          • Channel Strategy
      • Italgelatine S.p.A.
        • Overview
        • Product Portfolio
        • Profitability by Market Segments (Product/Age /Sales Channel/Region)
        • Sales Footprint
        • Strategy Overview
          • Marketing Strategy
          • Product Strategy
          • Channel Strategy
      • Ewald-Gelatine GmbH
        • Overview
        • Product Portfolio
        • Profitability by Market Segments (Product/Age /Sales Channel/Region)
        • Sales Footprint
        • Strategy Overview
          • Marketing Strategy
          • Product Strategy
          • Channel Strategy
      • Kewpie Corporation
        • Overview
        • Product Portfolio
        • Profitability by Market Segments (Product/Age /Sales Channel/Region)
        • Sales Footprint
        • Strategy Overview
          • Marketing Strategy
          • Product Strategy
          • Channel Strategy
      • Amicogen
        • Overview
        • Product Portfolio
        • Profitability by Market Segments (Product/Age /Sales Channel/Region)
        • Sales Footprint
        • Strategy Overview
          • Marketing Strategy
          • Product Strategy
          • Channel Strategy
      • Capsugel
        • Overview
        • Product Portfolio
        • Profitability by Market Segments (Product/Age /Sales Channel/Region)
        • Sales Footprint
        • Strategy Overview
          • Marketing Strategy
          • Product Strategy
          • Channel Strategy
      • Lapi Gelatine S.p.a.
        • Overview
        • Product Portfolio
        • Profitability by Market Segments (Product/Age /Sales Channel/Region)
        • Sales Footprint
        • Strategy Overview
          • Marketing Strategy
          • Product Strategy
          • Channel Strategy
      • Junca Gelatines, S.L.
        • Overview
        • Product Portfolio
        • Profitability by Market Segments (Product/Age /Sales Channel/Region)
        • Sales Footprint
        • Strategy Overview
          • Marketing Strategy
          • Product Strategy
          • Channel Strategy
      • Danish Crown
        • Overview
        • Product Portfolio
        • Profitability by Market Segments (Product/Age /Sales Channel/Region)
        • Sales Footprint
        • Strategy Overview
          • Marketing Strategy
          • Product Strategy
          • Channel Strategy
      • Others
        • Overview
        • Product Portfolio
        • Profitability by Market Segments (Product/Age /Sales Channel/Region)
        • Sales Footprint
        • Strategy Overview
          • Marketing Strategy
          • Product Strategy
          • Channel Strategy
  20. Assumptions & Acronyms Used
  21. Research Methodology

List of Tables

  • Table 1: Global Market Value (USD Million) Forecast by Region, 2020-2035
  • Table 2: Global Market Volume (units) Forecast by Region, 2020-2035
  • Table 3: Global Market Value (USD Million) Forecast by Application Type, 2020-2035
  • Table 4: Global Market Volume (units) Forecast by Application Type, 2020-2035
  • Table 5: Global Market Value (USD Million) Forecast by Source, 2020-2035
  • Table 6: Global Market Volume (units) Forecast by Source, 2020-2035
  • Table 7: Global Market Value (USD Million) Forecast by Form, 2020-2035
  • Table 8: Global Market Volume (units) Forecast by Form, 2020-2035
  • Table 9: North America Market Value (USD Million) Forecast by Country, 2020-2035
  • Table 10: North America Market Volume (units) Forecast by Country, 2020-2035
  • Table 11: North America Market Value (USD Million) Forecast by Application Type, 2020-2035
  • Table 12: North America Market Volume (units) Forecast by Application Type, 2020-2035
  • Table 13: North America Market Value (USD Million) Forecast by Source, 2020-2035
  • Table 14: North America Market Volume (units) Forecast by Source, 2020-2035
  • Table 15: North America Market Value (USD Million) Forecast by Form, 2020-2035
  • Table 16: North America Market Volume (units) Forecast by Form, 2020-2035
  • Table 17: Latin America Market Value (USD Million) Forecast by Country, 2020-2035
  • Table 18: Latin America Market Volume (units) Forecast by Country, 2020-2035
  • Table 19: Latin America Market Value (USD Million) Forecast by Application Type, 2020-2035
  • Table 20: Latin America Market Volume (units) Forecast by Application Type, 2020-2035
  • Table 21: Latin America Market Value (USD Million) Forecast by Source, 2020-2035
  • Table 22: Latin America Market Volume (units) Forecast by Source, 2020-2035
  • Table 23: Latin America Market Value (USD Million) Forecast by Form, 2020-2035
  • Table 24: Latin America Market Volume (units) Forecast by Form, 2020-2035
  • Table 25: Western Europe Market Value (USD Million) Forecast by Country, 2020-2035
  • Table 26: Western Europe Market Volume (units) Forecast by Country, 2020-2035
  • Table 27: Western Europe Market Value (USD Million) Forecast by Application Type, 2020-2035
  • Table 28: Western Europe Market Volume (units) Forecast by Application Type, 2020-2035
  • Table 29: Western Europe Market Value (USD Million) Forecast by Source, 2020-2035
  • Table 30: Western Europe Market Volume (units) Forecast by Source, 2020-2035
  • Table 31: Western Europe Market Value (USD Million) Forecast by Form, 2020-2035
  • Table 32: Western Europe Market Volume (units) Forecast by Form, 2020-2035
  • Table 33: Eastern Europe Market Value (USD Million) Forecast by Country, 2020-2035
  • Table 34: Eastern Europe Market Volume (units) Forecast by Country, 2020-2035
  • Table 35: Eastern Europe Market Value (USD Million) Forecast by Application Type, 2020-2035
  • Table 36: Eastern Europe Market Volume (units) Forecast by Application Type, 2020-2035
  • Table 37: Eastern Europe Market Value (USD Million) Forecast by Source, 2020-2035
  • Table 38: Eastern Europe Market Volume (units) Forecast by Source, 2020-2035
  • Table 39: Eastern Europe Market Value (USD Million) Forecast by Form, 2020-2035
  • Table 40: Eastern Europe Market Volume (units) Forecast by Form, 2020-2035
  • Table 41: East Asia Market Value (USD Million) Forecast by Country, 2020-2035
  • Table 42: East Asia Market Volume (units) Forecast by Country, 2020-2035
  • Table 43: East Asia Market Value (USD Million) Forecast by Application Type, 2020-2035
  • Table 44: East Asia Market Volume (units) Forecast by Application Type, 2020-2035
  • Table 45: East Asia Market Value (USD Million) Forecast by Source, 2020-2035
  • Table 46: East Asia Market Volume (units) Forecast by Source, 2020-2035
  • Table 47: East Asia Market Value (USD Million) Forecast by Form, 2020-2035
  • Table 48: East Asia Market Volume (units) Forecast by Form, 2020-2035
  • Table 49: South Asia & Pacific Market Value (USD Million) Forecast by Country, 2020-2035
  • Table 50: South Asia & Pacific Market Volume (units) Forecast by Country, 2020-2035
  • Table 51: South Asia & Pacific Market Value (USD Million) Forecast by Application Type, 2020-2035
  • Table 52: South Asia & Pacific Market Volume (units) Forecast by Application Type, 2020-2035
  • Table 53: South Asia & Pacific Market Value (USD Million) Forecast by Source, 2020-2035
  • Table 54: South Asia & Pacific Market Volume (units) Forecast by Source, 2020-2035
  • Table 55: South Asia & Pacific Market Value (USD Million) Forecast by Form, 2020-2035
  • Table 56: South Asia & Pacific Market Volume (units) Forecast by Form, 2020-2035
  • Table 57: Middle East and Africa Market Value (USD Million) Forecast by Country, 2020-2035
  • Table 58: Middle East and Africa Market Volume (units) Forecast by Country, 2020-2035
  • Table 59: Middle East and Africa Market Value (USD Million) Forecast by Application Type, 2020-2035
  • Table 60: Middle East and Africa Market Volume (units) Forecast by Application Type, 2020-2035
  • Table 61: Middle East and Africa Market Value (USD Million) Forecast by Source, 2020-2035
  • Table 62: Middle East and Africa Market Volume (units) Forecast by Source, 2020-2035
  • Table 63: Middle East and Africa Market Value (USD Million) Forecast by Form, 2020-2035
  • Table 64: Middle East and Africa Market Volume (units) Forecast by Form, 2020-2035

List of Figures

  • Figure 1: Global Market Volume (units) Forecast 2020-2035
  • Figure 2: Global Market Pricing Analysis
  • Figure 3: Global Market Value (USD Million) Forecast 2020-2035
  • Figure 4: Global Market Value Share and BPS Analysis by Application Type, 2025 and 2035
  • Figure 5: Global Market Y-o-Y Growth Comparison by Application Type, 2025-2035
  • Figure 6: Global Market Attractiveness Analysis by Application Type
  • Figure 7: Global Market Value Share and BPS Analysis by Source, 2025 and 2035
  • Figure 8: Global Market Y-o-Y Growth Comparison by Source, 2025-2035
  • Figure 9: Global Market Attractiveness Analysis by Source
  • Figure 10: Global Market Value Share and BPS Analysis by Form, 2025 and 2035
  • Figure 11: Global Market Y-o-Y Growth Comparison by Form, 2025-2035
  • Figure 12: Global Market Attractiveness Analysis by Form
  • Figure 13: Global Market Value (USD Million) Share and BPS Analysis by Region, 2025 and 2035
  • Figure 14: Global Market Y-o-Y Growth Comparison by Region, 2025-2035
  • Figure 15: Global Market Attractiveness Analysis by Region
  • Figure 16: North America Market Incremental $ Opportunity, 2025-2035
  • Figure 17: Latin America Market Incremental $ Opportunity, 2025-2035
  • Figure 18: Western Europe Market Incremental $ Opportunity, 2025-2035
  • Figure 19: Eastern Europe Market Incremental $ Opportunity, 2025-2035
  • Figure 20: East Asia Market Incremental $ Opportunity, 2025-2035
  • Figure 21: South Asia & Pacific Market Incremental $ Opportunity, 2025-2035
  • Figure 22: Middle East and Africa Market Incremental $ Opportunity, 2025-2035
  • Figure 23: North America Market Value Share and BPS Analysis by Country, 2025 and 2035
  • Figure 24: North America Market Value Share and BPS Analysis by Application Type, 2025 and 2035
  • Figure 25: North America Market Y-o-Y Growth Comparison by Application Type, 2025-2035
  • Figure 26: North America Market Attractiveness Analysis by Application Type
  • Figure 27: North America Market Value Share and BPS Analysis by Source, 2025 and 2035
  • Figure 28: North America Market Y-o-Y Growth Comparison by Source, 2025-2035
  • Figure 29: North America Market Attractiveness Analysis by Source
  • Figure 30: North America Market Value Share and BPS Analysis by Form, 2025 and 2035
  • Figure 31: North America Market Y-o-Y Growth Comparison by Form, 2025-2035
  • Figure 32: North America Market Attractiveness Analysis by Form
  • Figure 33: Latin America Market Value Share and BPS Analysis by Country, 2025 and 2035
  • Figure 34: Latin America Market Value Share and BPS Analysis by Application Type, 2025 and 2035
  • Figure 35: Latin America Market Y-o-Y Growth Comparison by Application Type, 2025-2035
  • Figure 36: Latin America Market Attractiveness Analysis by Application Type
  • Figure 37: Latin America Market Value Share and BPS Analysis by Source, 2025 and 2035
  • Figure 38: Latin America Market Y-o-Y Growth Comparison by Source, 2025-2035
  • Figure 39: Latin America Market Attractiveness Analysis by Source
  • Figure 40: Latin America Market Value Share and BPS Analysis by Form, 2025 and 2035
  • Figure 41: Latin America Market Y-o-Y Growth Comparison by Form, 2025-2035
  • Figure 42: Latin America Market Attractiveness Analysis by Form
  • Figure 43: Western Europe Market Value Share and BPS Analysis by Country, 2025 and 2035
  • Figure 44: Western Europe Market Value Share and BPS Analysis by Application Type, 2025 and 2035
  • Figure 45: Western Europe Market Y-o-Y Growth Comparison by Application Type, 2025-2035
  • Figure 46: Western Europe Market Attractiveness Analysis by Application Type
  • Figure 47: Western Europe Market Value Share and BPS Analysis by Source, 2025 and 2035
  • Figure 48: Western Europe Market Y-o-Y Growth Comparison by Source, 2025-2035
  • Figure 49: Western Europe Market Attractiveness Analysis by Source
  • Figure 50: Western Europe Market Value Share and BPS Analysis by Form, 2025 and 2035
  • Figure 51: Western Europe Market Y-o-Y Growth Comparison by Form, 2025-2035
  • Figure 52: Western Europe Market Attractiveness Analysis by Form
  • Figure 53: Eastern Europe Market Value Share and BPS Analysis by Country, 2025 and 2035
  • Figure 54: Eastern Europe Market Value Share and BPS Analysis by Application Type, 2025 and 2035
  • Figure 55: Eastern Europe Market Y-o-Y Growth Comparison by Application Type, 2025-2035
  • Figure 56: Eastern Europe Market Attractiveness Analysis by Application Type
  • Figure 57: Eastern Europe Market Value Share and BPS Analysis by Source, 2025 and 2035
  • Figure 58: Eastern Europe Market Y-o-Y Growth Comparison by Source, 2025-2035
  • Figure 59: Eastern Europe Market Attractiveness Analysis by Source
  • Figure 60: Eastern Europe Market Value Share and BPS Analysis by Form, 2025 and 2035
  • Figure 61: Eastern Europe Market Y-o-Y Growth Comparison by Form, 2025-2035
  • Figure 62: Eastern Europe Market Attractiveness Analysis by Form
  • Figure 63: East Asia Market Value Share and BPS Analysis by Country, 2025 and 2035
  • Figure 64: East Asia Market Value Share and BPS Analysis by Application Type, 2025 and 2035
  • Figure 65: East Asia Market Y-o-Y Growth Comparison by Application Type, 2025-2035
  • Figure 66: East Asia Market Attractiveness Analysis by Application Type
  • Figure 67: East Asia Market Value Share and BPS Analysis by Source, 2025 and 2035
  • Figure 68: East Asia Market Y-o-Y Growth Comparison by Source, 2025-2035
  • Figure 69: East Asia Market Attractiveness Analysis by Source
  • Figure 70: East Asia Market Value Share and BPS Analysis by Form, 2025 and 2035
  • Figure 71: East Asia Market Y-o-Y Growth Comparison by Form, 2025-2035
  • Figure 72: East Asia Market Attractiveness Analysis by Form
  • Figure 73: South Asia & Pacific Market Value Share and BPS Analysis by Country, 2025 and 2035
  • Figure 74: South Asia & Pacific Market Value Share and BPS Analysis by Application Type, 2025 and 2035
  • Figure 75: South Asia & Pacific Market Y-o-Y Growth Comparison by Application Type, 2025-2035
  • Figure 76: South Asia & Pacific Market Attractiveness Analysis by Application Type
  • Figure 77: South Asia & Pacific Market Value Share and BPS Analysis by Source, 2025 and 2035
  • Figure 78: South Asia & Pacific Market Y-o-Y Growth Comparison by Source, 2025-2035
  • Figure 79: South Asia & Pacific Market Attractiveness Analysis by Source
  • Figure 80: South Asia & Pacific Market Value Share and BPS Analysis by Form, 2025 and 2035
  • Figure 81: South Asia & Pacific Market Y-o-Y Growth Comparison by Form, 2025-2035
  • Figure 82: South Asia & Pacific Market Attractiveness Analysis by Form
  • Figure 83: Middle East and Africa Market Value Share and BPS Analysis by Country, 2025 and 2035
  • Figure 84: Middle East and Africa Market Value Share and BPS Analysis by Application Type, 2025 and 2035
  • Figure 85: Middle East and Africa Market Y-o-Y Growth Comparison by Application Type, 2025-2035
  • Figure 86: Middle East and Africa Market Attractiveness Analysis by Application Type
  • Figure 87: Middle East and Africa Market Value Share and BPS Analysis by Source, 2025 and 2035
  • Figure 88: Middle East and Africa Market Y-o-Y Growth Comparison by Source, 2025-2035
  • Figure 89: Middle East and Africa Market Attractiveness Analysis by Source
  • Figure 90: Middle East and Africa Market Value Share and BPS Analysis by Form, 2025 and 2035
  • Figure 91: Middle East and Africa Market Y-o-Y Growth Comparison by Form, 2025-2035
  • Figure 92: Middle East and Africa Market Attractiveness Analysis by Form
  • Figure 93: Global Market - Tier Structure Analysis
  • Figure 94: Global Market - Company Share Analysis

Frequently Asked Questions

What is the projected size of the collagen peptide market in 2025?

The market size is valued at USD 789.7 million in 2025.

What is the outlook on collagen peptide demand by 2035?

The market is forecasted to reach USD 1,383.1 million by 2035, reflecting a CAGR of 5.7%.

Which application type leads the collagen peptide market in 2025?

Nutritional products are expected to lead with a 42% share in 2025.

Which source segment will account for the largest market share in the collagen peptide market?

Marine & poultry sources are projected to hold a market share of 19% by 2035.

Which country is projected to have the fastest-growing collagen peptide market?

The USA is anticipated to be the fastest-growing market with a 5.8% CAGR from 2025 to 2035.

Explore Similar Insights

Future Market Insights

Collagen Peptide Market