Collagen Water Market Size and Share Forecast Outlook (2024 to 2034)

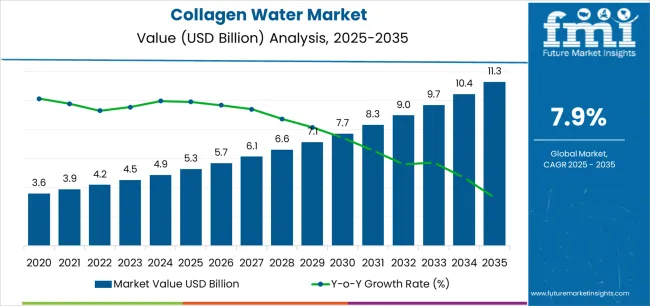
The global collagen water market is estimated to propagate through market hurdles during the forecasted period to achieve a USD 10.76 billion valuation by 2034. The estimated leap is attributed to a promising CAGR of 8.3%. Further, the subject market will gain a market size of USD 4.87 billion by 2024.

Attributes Key Insights
Estimated Market Size in 2024 USD 4.87 billion
Projected Market Value in 2034 USD 10.76 billion
Value-based CAGR from 2024 to 2034 8.3%

Key Trends and Emerging Opportunities in the Collagen Water Industry

  • Brands are developing their image under business ethicality. This surges the practice of ethical sourcing, which is a key market trend. It increases consumer attention, as more consumers are preferring this practice.
  • Sustainability has been an emerging trend in the global collagen water market. Manufacturers and consumers rely more on sustainable products, which can be produced using natural ingredients.
  • Flavor innovation, along with the medicinal properties of collagen products, is another key market trend. The increasing health awareness is driving the market trend.
  • Technological integration enables manufacturers to decide the composition of products accurately. This is another key market trend propelling the market.

Comparison of Demand Trends (2019 to 2023) vs Forecast Outlook (2024 to 2034)

The historical figures suggest that the global collagen water market propelled at a CAGR of 7.6% from 2019 to 2023. The market size increased from USD 3.57 billion to USD 4.77 billion during this period.

The increased prevalence of diseases caused by sedentary and ill-structured lifestyles surged the demand for healthy food products. A surge was observed in the pharmaceutical and food industry for such products. As an integral component of these products, collagens pushed the market during the historical period.

The lack of protein content was observed to have spiked significantly. Hence, it was essential to fill this gap with the help of relevant products. Collagen water, fulfilling the demand, resolved the patients’ complaints of joint pains. Hence, this is another important market driver.

The forecasted period is concerned with the growing cosmetic and personal care industry. The growth of the sector surges the demand for moisturizer products. Collagen, being an excellent water binder, provides better semi-solid liquids. Hence, this is likely to drive the subject market.

Historical CAGR from 2019 to 2023 7.6%
Forecast CAGR from 2024 to 2034 8.3%

Drivers Supporting the Expansion of the Collagen Water Market

  • The growing cosmetic industry is the fundamental market driver for the global collagen water market.
  • The increasing consumer awareness about skincare surges the demand for relevant products. Hence, this drives the subject market.
  • Due to the wide applications of collagen in different industries, many lucrative opportunities are created for the market, helping it propagate.
  • Beverage manufacturers and cosmetic brands collaborate, fueling the market growth as collagen water can be positioned and marketed as a beauty enhancer drink or elixir.

Challenges Affecting the Growth Trajectory of Collagen Water Products

  • Storage and management of collagen products might be the fundamental challenge for the collagen water market. They get rapidly degraded due to the overexposure to heat.
  • Collagen formulation is another key challenge. This is because collagen might change its properties after dissolving in some solvents.

Analysis of Top Countries Consuming and Distributing Collagen Water

Various regions actively contribute toward the development of the collagen water market. Asia-Pacific promises to be the highest-growing market in the forecasted period. Due to the emergence of new markets, new prospects for the subject market have become visible. This fuels its growth.

North America holds a significant market share, which fuels the growth of the subject market. Developed countries like Canada, the United States of America, etc. provide lucrative growth opportunities to the market. Apart from this, Europe also contributes substantially to the market progress.

Forecast CAGRs from 2024 to 2034

Countries Forecasted CAGR
Canada 6.7%
France 6.2%
Spain 6.6%
China 12.8%
India 9.4%

Embracing Sustainability Drives the Canadian Collagen Water Market

  • It is estimated that Canada will lead North America in the forecasted period by registering its advancement at a CAGR of 6.7%.
  • The fundamental market driver can be attributed to the rising inclination toward sustainability. Consumers have started to prefer sustainable and environmentally safe products.
  • Sustainable collagen water sourcing, mostly from marine sources, attracts more consumers.
  • Apart from this, ethical sourcing practice is another market driver for the Canadian market.
  • Therefore, these factors influence consumer inclination toward products, driving the subject market.

Culinary Innovation Drives the French Market

  • France contributes to the European market significantly and forecasts its advancement at a moderate CAGR of 6.2%.
  • The French culture embraces different cultures and enjoys exploring them in health and wellness.
  • To meet this, culinary innovation is the medium is chosen, which surges the demand for flavor sophistication through the seamless integration with collagen.
  • Due to this, collagen water becomes an integral part of the French pallet.

Mediterranean Diet and Lifestyle is Responsible for the Growth of the Spanish Collagen Water Market

  • The Spanish culture adheres to its traditional diet and lifestyle, focusing on the Mediterranean diet.
  • Consequently, more emphasis is placed on healthy and nutrient-rich food items. These food items can be enriched with antioxidants using collagen water.
  • Apart from this, the shelf-life and longevity of food items increase due to the active role of collagen.
  • This supports the Spanish market’s progress, forecasting its advancement at a CAGR of 6.6%.

Medicinal Values of Collagen Water Elevate its Demand in China

  • The Chinese population is more inclined toward anti-aging solutions and medicines that will help their skin remain wrinkle-free.
  • Collagen possesses properties that benefit the skin health of an individual. Also, it is closely related to the traditional Chinese medicines.
  • This increases consumer preferences for collagen water products, surging the Chinese market.
  • Apart from this, emphasizing anti-aging benefits leads to increased sales of products, driving the subject market.
  • Therefore, these factors drive the Chinese collagen water market at a CAGR of 12.8%, helping the country lead the Asia-Pacific region.

Growing Health and Wellness Trends Drive the Indian Market

  • India is the second-largest growing market in Asia-Pacific in terms of its growth rate. It forecasts the market advancement at a CAGR of 9.4%.
  • The Indian population, especially the current generation, is keen on health and wellness.
  • They frequently seek healthy products through food items and beverages, leveraging the demand for relevant ingredients.
  • The collagen water market is positioned in the Indian market that aims to attract health-affectionate population.
  • Fitness enhancement, skin benefits, and nutrient intake are properties of collagen products that attract consumers in India, driving the market.

Collagen Water Industry Analysis by Top Investment Segments

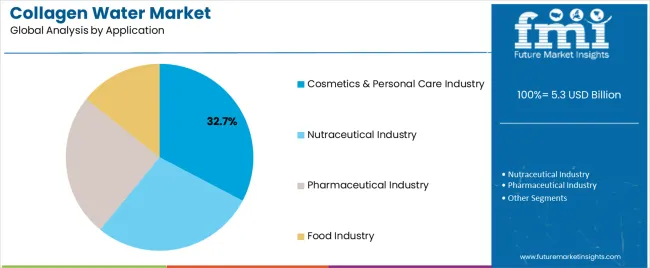
Based on the application, the cosmetic and personal care industry will secure the largest market in 2024, equalling 32.7%.

Category Application (Cosmetics & Personal Care Industry)
Market Share in 2024 32.7%
Market Segment Drivers

Due to its great water-binding capacity, collagen often finds demand in preparing moisturizers, which is currently being surged., Rising skincare awareness is surging the skin care products, whose collagen is an integral part., Therefore, these factors drive the subject market segment, furling its substantial market share.

Based on sales channels, specialty stores are estimated to secure the largest market share of 23.5% by 2024.

Category Sales Channel (Specialty Stores)
Market Share in 2024 23.5%
Market Segment Drivers Due to different organizations' bolstered distribution channel network, efficient store supply of collagen water can be ensured., Apart from this, specialty stores have a better consumer reach, supporting efficient branding., Therefore, these factors drive the subject market’s sales channel segment, ensuring its significant market share.

Competitive Landscape of the Collagen Water Market

The global collagen water market is highly exploited, evident from its growing size. However, the presence of competitors in the competitive landscape creates a fierce competitive force.

The new entrant must innovate and develop its products to withstand the force. Moreover, it is crucial to emphasize marketing and branding strategies to gain a competitive edge.

Key marketers create a strong presence through their innovative products. Also, they use different strategies to expand in the market. Strategic collaborations, partnerships, mergers and acquisitions, global expansions, etc., are key strategic initiatives helping these businesses acquire a sustainable competitive edge.

Key Market Developments

  • In November 2021, Great Lakes Gelatin Company introduced quick-dissolve collagen peptide products. Clinically researched ingredients promise to add health benefits, fulfilling the consumer demand. Hence, this gives a competitive niche to the organization.
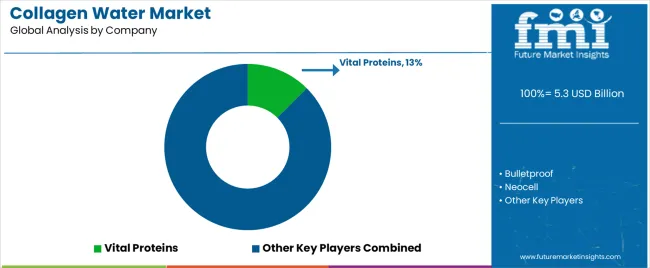
  • In February 2022, Nestlé Health Science acquired Vital Proteins. This move helps the latter business expand geographically in different countries. It allows business to bolster its strategic position in the competitive market space.
  • In October 2022, BioCell Technology was critically acclaimed and certified by Halal, an Islamic Information Documentation and Certification GmbH (IIDC). This helps the business penetrate the market deeply. Moreover, it allows business to expand geographically, as IIDC is accepted in all the Islamic countries in the Middle East and Asia Pacific.

Coverage of the Collagen Water Market Report

  • Strategic analysis of market dynamics and fueling factors.
  • Emerging regions’ analysis providing a complete overview of the market niche in developing and developed markets.
  • Strategic initiatives taken by key players in the collagen water market.
  • Competitive landscape analyzed with the help of theoretical frameworks.
  • Key coverage of market drivers, restraints, opportunities, and challenges.
  • Key growth indicators of the market with respect to its historical position.

Overview of Analytical Coverage and Study Boundaries for the Collagen Water Industry

Attributes Details
Estimated Market Size in 2024 USD 4.87 billion
Projected Market Valuation in 2034 USD 10.76 billion
Value-based CAGR 2024 to 2034 8.3%
Forecast Period 2024 to 2034
Historical Data Available for 2019 to 2023
Market Analysis Value in USD billion
Key Regions Covered North America; Latin America; Western Europe; Eastern Europe; South Asia and Pacific; East Asia; The Middle East and Africa
Key Market Segments Covered By Source, By Form, Application, Sales Channel, Region
Key Countries Profiled

The United States, Canada, Brazil, Mexico, Germany, The United Kingdom, France, Spain, Italy, Poland, Russia, Czech Republic, Romania, India, Bangladesh, Australia, New Zealand, China, Japan, South Korea, GCC Countries, South Africa, Israel

Key Companies Profiled Vital Proteins; Bulletproof; Neocell; Youtheory; Reserveage Nutrition; Health Logics; BioCell Technology; Great Lakes Gelatin Company; Zint; Ancient Nutrition; Applied Nutrition; BUBS Naturals; Primal Kitchen; Nordic Naturals; Collagen Matrix

Top Segments Studied in the Collagen Water Market Report

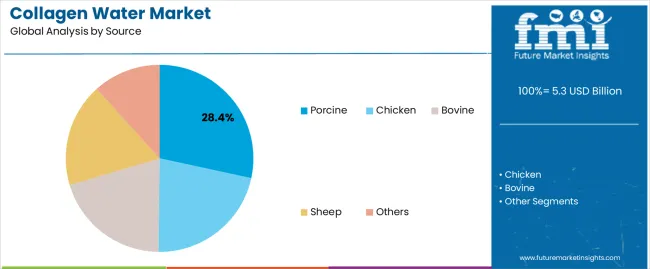
By Source:

  • Porcine
  • Chicken
  • Bovine
  • Sheep
  • Others

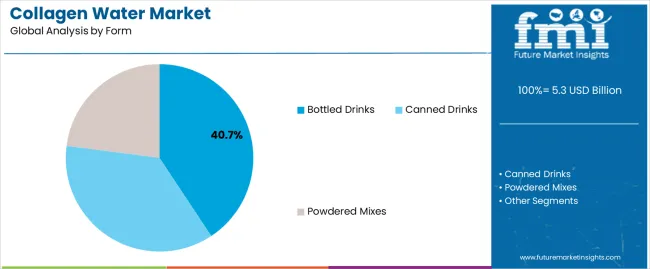
By Form:

  • Bottled Drinks
  • Canned Drinks
  • Powdered Mixes

By Application:

  • Food Industry
  • Cosmetics & Personal Care Industry
  • Nutraceutical Industry
  • Pharmaceutical Industry
  • Others

By Sales Channel:

  • Modern Trade
  • Specialty Stores
  • Drug Stores
  • Online Retail Stores
  • Others

By Region:

  • North America
  • Latin America
  • Western Europe
  • Eastern Europe
  • South Asia and Pacific
  • East Asia
  • The Middle East and Africa

Table of Content

  • 1. Executive Summary
  • 2. Market Overview
  • 3. Market Background
  • 4. Global Market Analysis 2019 to 2023 and Forecast, 2024 to 2034
  • 5. Global Market Analysis 2019 to 2023 and Forecast 2024 to 2034, By Source
    • 5.1. Porcine
    • 5.2. Chicken
    • 5.3. Bovine
    • 5.4. Sheep
    • 5.5. Others
  • 6. Global Market Analysis 2019 to 2023 and Forecast 2024 to 2034, By Form
    • 6.1. Bottled Drinks
    • 6.2. Canned Drinks
    • 6.3. Powdered Mixes
  • 7. Global Market Analysis 2019 to 2023 and Forecast 2024 to 2034, By Application
    • 7.1. Food Industry
    • 7.2. Cosmetics & Personal Care Industry
    • 7.3. Nutraceutical Industry
    • 7.4. Pharmaceutical Industry
    • 7.5. Others
  • 8. Global Market Analysis 2019 to 2023 and Forecast 2024 to 2034, By Sales Channel
    • 8.1. Modern Trade
    • 8.2. Specialty Stores
    • 8.3. Drug Stores
    • 8.4. Online Retail Stores
    • 8.5. Others
  • 9. Global Market Analysis 2019 to 2023 and Forecast 2024 to 2034, By Region
    • 9.1. North America
    • 9.2. Latin America
    • 9.3. Western Europe
    • 9.4. Eastern Europe
    • 9.5. South Asia and Pacific
    • 9.6. East Asia
    • 9.7. Middle East and Africa
  • 10. North America Market Analysis 2019 to 2023 and Forecast 2024 to 2034, By Country
  • 11. Latin America Market Analysis 2019 to 2023 and Forecast 2024 to 2034, By Country
  • 12. Western Europe Market Analysis 2019 to 2023 and Forecast 2024 to 2034, By Country
  • 13. Eastern Europe Market Analysis 2019 to 2023 and Forecast 2024 to 2034, By Country
  • 14. South Asia and Pacific Market Analysis 2019 to 2023 and Forecast 2024 to 2034, By Country
  • 15. East Asia Market Analysis 2019 to 2023 and Forecast 2024 to 2034, By Country
  • 16. Middle East and Africa Market Analysis 2019 to 2023 and Forecast 2024 to 2034, By Country
  • 17. Key Countries Market Analysis
  • 18. Market Structure Analysis
  • 19. Competition Analysis
    • 19.1. Vital Proteins
    • 19.2. Bulletproof
    • 19.3. Neocell
    • 19.4. Youtheory
    • 19.5. Reserveage Nutrition
    • 19.6. Health Logics
    • 19.7. BioCell Technology
    • 19.8. Great Lakes Gelatin Company
    • 19.9. Zint
    • 19.10. Ancient Nutrition
    • 19.11. Applied Nutrition
    • 19.12. BUSANaturals
    • 19.13. Primal Kitchen
    • 19.14. Nordic Naturals
    • 19.15. Collagen Matrix
  • 20. Assumptions & Acronyms Used
  • 21. Research Methodology

List of Tables

Table 1: Global Market Value (US$ Million) Forecast by Region, 2019 to 2034

Table 2: Global Market Volume (Unit Pack) Forecast by Region, 2019 to 2034

Table 3: Global Market Value (US$ Million) Forecast by Source, 2019 to 2034

Table 4: Global Market Volume (Unit Pack) Forecast by Source, 2019 to 2034

Table 5: Global Market Value (US$ Million) Forecast by Form, 2019 to 2034

Table 6: Global Market Volume (Unit Pack) Forecast by Form, 2019 to 2034

Table 7: Global Market Value (US$ Million) Forecast by Application, 2019 to 2034

Table 8: Global Market Volume (Unit Pack) Forecast by Application, 2019 to 2034

Table 9: Global Market Value (US$ Million) Forecast by Sales Channel, 2019 to 2034

Table 10: Global Market Volume (Unit Pack) Forecast by Sales Channel, 2019 to 2034

Table 11: North America Market Value (US$ Million) Forecast by Country, 2019 to 2034

Table 12: North America Market Volume (Unit Pack) Forecast by Country, 2019 to 2034

Table 13: North America Market Value (US$ Million) Forecast by Source, 2019 to 2034

Table 14: North America Market Volume (Unit Pack) Forecast by Source, 2019 to 2034

Table 15: North America Market Value (US$ Million) Forecast by Form, 2019 to 2034

Table 16: North America Market Volume (Unit Pack) Forecast by Form, 2019 to 2034

Table 17: North America Market Value (US$ Million) Forecast by Application, 2019 to 2034

Table 18: North America Market Volume (Unit Pack) Forecast by Application, 2019 to 2034

Table 19: North America Market Value (US$ Million) Forecast by Sales Channel, 2019 to 2034

Table 20: North America Market Volume (Unit Pack) Forecast by Sales Channel, 2019 to 2034

Table 21: Latin America Market Value (US$ Million) Forecast by Country, 2019 to 2034

Table 22: Latin America Market Volume (Unit Pack) Forecast by Country, 2019 to 2034

Table 23: Latin America Market Value (US$ Million) Forecast by Source, 2019 to 2034

Table 24: Latin America Market Volume (Unit Pack) Forecast by Source, 2019 to 2034

Table 25: Latin America Market Value (US$ Million) Forecast by Form, 2019 to 2034

Table 26: Latin America Market Volume (Unit Pack) Forecast by Form, 2019 to 2034

Table 27: Latin America Market Value (US$ Million) Forecast by Application, 2019 to 2034

Table 28: Latin America Market Volume (Unit Pack) Forecast by Application, 2019 to 2034

Table 29: Latin America Market Value (US$ Million) Forecast by Sales Channel, 2019 to 2034

Table 30: Latin America Market Volume (Unit Pack) Forecast by Sales Channel, 2019 to 2034

Table 31: Western Europe Market Value (US$ Million) Forecast by Country, 2019 to 2034

Table 32: Western Europe Market Volume (Unit Pack) Forecast by Country, 2019 to 2034

Table 33: Western Europe Market Value (US$ Million) Forecast by Source, 2019 to 2034

Table 34: Western Europe Market Volume (Unit Pack) Forecast by Source, 2019 to 2034

Table 35: Western Europe Market Value (US$ Million) Forecast by Form, 2019 to 2034

Table 36: Western Europe Market Volume (Unit Pack) Forecast by Form, 2019 to 2034

Table 37: Western Europe Market Value (US$ Million) Forecast by Application, 2019 to 2034

Table 38: Western Europe Market Volume (Unit Pack) Forecast by Application, 2019 to 2034

Table 39: Western Europe Market Value (US$ Million) Forecast by Sales Channel, 2019 to 2034

Table 40: Western Europe Market Volume (Unit Pack) Forecast by Sales Channel, 2019 to 2034

Table 41: Eastern Europe Market Value (US$ Million) Forecast by Country, 2019 to 2034

Table 42: Eastern Europe Market Volume (Unit Pack) Forecast by Country, 2019 to 2034

Table 43: Eastern Europe Market Value (US$ Million) Forecast by Source, 2019 to 2034

Table 44: Eastern Europe Market Volume (Unit Pack) Forecast by Source, 2019 to 2034

Table 45: Eastern Europe Market Value (US$ Million) Forecast by Form, 2019 to 2034

Table 46: Eastern Europe Market Volume (Unit Pack) Forecast by Form, 2019 to 2034

Table 47: Eastern Europe Market Value (US$ Million) Forecast by Application, 2019 to 2034

Table 48: Eastern Europe Market Volume (Unit Pack) Forecast by Application, 2019 to 2034

Table 49: Eastern Europe Market Value (US$ Million) Forecast by Sales Channel, 2019 to 2034

Table 50: Eastern Europe Market Volume (Unit Pack) Forecast by Sales Channel, 2019 to 2034

Table 51: South Asia and Pacific Market Value (US$ Million) Forecast by Country, 2019 to 2034

Table 52: South Asia and Pacific Market Volume (Unit Pack) Forecast by Country, 2019 to 2034

Table 53: South Asia and Pacific Market Value (US$ Million) Forecast by Source, 2019 to 2034

Table 54: South Asia and Pacific Market Volume (Unit Pack) Forecast by Source, 2019 to 2034

Table 55: South Asia and Pacific Market Value (US$ Million) Forecast by Form, 2019 to 2034

Table 56: South Asia and Pacific Market Volume (Unit Pack) Forecast by Form, 2019 to 2034

Table 57: South Asia and Pacific Market Value (US$ Million) Forecast by Application, 2019 to 2034

Table 58: South Asia and Pacific Market Volume (Unit Pack) Forecast by Application, 2019 to 2034

Table 59: South Asia and Pacific Market Value (US$ Million) Forecast by Sales Channel, 2019 to 2034

Table 60: South Asia and Pacific Market Volume (Unit Pack) Forecast by Sales Channel, 2019 to 2034

Table 61: East Asia Market Value (US$ Million) Forecast by Country, 2019 to 2034

Table 62: East Asia Market Volume (Unit Pack) Forecast by Country, 2019 to 2034

Table 63: East Asia Market Value (US$ Million) Forecast by Source, 2019 to 2034

Table 64: East Asia Market Volume (Unit Pack) Forecast by Source, 2019 to 2034

Table 65: East Asia Market Value (US$ Million) Forecast by Form, 2019 to 2034

Table 66: East Asia Market Volume (Unit Pack) Forecast by Form, 2019 to 2034

Table 67: East Asia Market Value (US$ Million) Forecast by Application, 2019 to 2034

Table 68: East Asia Market Volume (Unit Pack) Forecast by Application, 2019 to 2034

Table 69: East Asia Market Value (US$ Million) Forecast by Sales Channel, 2019 to 2034

Table 70: East Asia Market Volume (Unit Pack) Forecast by Sales Channel, 2019 to 2034

Table 71: Middle East and Africa Market Value (US$ Million) Forecast by Country, 2019 to 2034

Table 72: Middle East and Africa Market Volume (Unit Pack) Forecast by Country, 2019 to 2034

Table 73: Middle East and Africa Market Value (US$ Million) Forecast by Source, 2019 to 2034

Table 74: Middle East and Africa Market Volume (Unit Pack) Forecast by Source, 2019 to 2034

Table 75: Middle East and Africa Market Value (US$ Million) Forecast by Form, 2019 to 2034

Table 76: Middle East and Africa Market Volume (Unit Pack) Forecast by Form, 2019 to 2034

Table 77: Middle East and Africa Market Value (US$ Million) Forecast by Application, 2019 to 2034

Table 78: Middle East and Africa Market Volume (Unit Pack) Forecast by Application, 2019 to 2034

Table 79: Middle East and Africa Market Value (US$ Million) Forecast by Sales Channel, 2019 to 2034

Table 80: Middle East and Africa Market Volume (Unit Pack) Forecast by Sales Channel, 2019 to 2034

List of Figures

Figure 1: Global Market Value (US$ Million) by Source, 2024 to 2034

Figure 2: Global Market Value (US$ Million) by Form, 2024 to 2034

Figure 3: Global Market Value (US$ Million) by Application, 2024 to 2034

Figure 4: Global Market Value (US$ Million) by Sales Channel, 2024 to 2034

Figure 5: Global Market Value (US$ Million) by Region, 2024 to 2034

Figure 6: Global Market Value (US$ Million) Analysis by Region, 2019 to 2034

Figure 7: Global Market Volume (Unit Pack) Analysis by Region, 2019 to 2034

Figure 8: Global Market Value Share (%) and BPS Analysis by Region, 2024 to 2034

Figure 9: Global Market Y-o-Y Growth (%) Projections by Region, 2024 to 2034

Figure 10: Global Market Value (US$ Million) Analysis by Source, 2019 to 2034

Figure 11: Global Market Volume (Unit Pack) Analysis by Source, 2019 to 2034

Figure 12: Global Market Value Share (%) and BPS Analysis by Source, 2024 to 2034

Figure 13: Global Market Y-o-Y Growth (%) Projections by Source, 2024 to 2034

Figure 14: Global Market Value (US$ Million) Analysis by Form, 2019 to 2034

Figure 15: Global Market Volume (Unit Pack) Analysis by Form, 2019 to 2034

Figure 16: Global Market Value Share (%) and BPS Analysis by Form, 2024 to 2034

Figure 17: Global Market Y-o-Y Growth (%) Projections by Form, 2024 to 2034

Figure 18: Global Market Value (US$ Million) Analysis by Application, 2019 to 2034

Figure 19: Global Market Volume (Unit Pack) Analysis by Application, 2019 to 2034

Figure 20: Global Market Value Share (%) and BPS Analysis by Application, 2024 to 2034

Figure 21: Global Market Y-o-Y Growth (%) Projections by Application, 2024 to 2034

Figure 22: Global Market Value (US$ Million) Analysis by Sales Channel, 2019 to 2034

Figure 23: Global Market Volume (Unit Pack) Analysis by Sales Channel, 2019 to 2034

Figure 24: Global Market Value Share (%) and BPS Analysis by Sales Channel, 2024 to 2034

Figure 25: Global Market Y-o-Y Growth (%) Projections by Sales Channel, 2024 to 2034

Figure 26: Global Market Attractiveness by Source, 2024 to 2034

Figure 27: Global Market Attractiveness by Form, 2024 to 2034

Figure 28: Global Market Attractiveness by Application, 2024 to 2034

Figure 29: Global Market Attractiveness by Sales Channel, 2024 to 2034

Figure 30: Global Market Attractiveness by Region, 2024 to 2034

Figure 31: North America Market Value (US$ Million) by Source, 2024 to 2034

Figure 32: North America Market Value (US$ Million) by Form, 2024 to 2034

Figure 33: North America Market Value (US$ Million) by Application, 2024 to 2034

Figure 34: North America Market Value (US$ Million) by Sales Channel, 2024 to 2034

Figure 35: North America Market Value (US$ Million) by Country, 2024 to 2034

Figure 36: North America Market Value (US$ Million) Analysis by Country, 2019 to 2034

Figure 37: North America Market Volume (Unit Pack) Analysis by Country, 2019 to 2034

Figure 38: North America Market Value Share (%) and BPS Analysis by Country, 2024 to 2034

Figure 39: North America Market Y-o-Y Growth (%) Projections by Country, 2024 to 2034

Figure 40: North America Market Value (US$ Million) Analysis by Source, 2019 to 2034

Figure 41: North America Market Volume (Unit Pack) Analysis by Source, 2019 to 2034

Figure 42: North America Market Value Share (%) and BPS Analysis by Source, 2024 to 2034

Figure 43: North America Market Y-o-Y Growth (%) Projections by Source, 2024 to 2034

Figure 44: North America Market Value (US$ Million) Analysis by Form, 2019 to 2034

Figure 45: North America Market Volume (Unit Pack) Analysis by Form, 2019 to 2034

Figure 46: North America Market Value Share (%) and BPS Analysis by Form, 2024 to 2034

Figure 47: North America Market Y-o-Y Growth (%) Projections by Form, 2024 to 2034

Figure 48: North America Market Value (US$ Million) Analysis by Application, 2019 to 2034

Figure 49: North America Market Volume (Unit Pack) Analysis by Application, 2019 to 2034

Figure 50: North America Market Value Share (%) and BPS Analysis by Application, 2024 to 2034

Figure 51: North America Market Y-o-Y Growth (%) Projections by Application, 2024 to 2034

Figure 52: North America Market Value (US$ Million) Analysis by Sales Channel, 2019 to 2034

Figure 53: North America Market Volume (Unit Pack) Analysis by Sales Channel, 2019 to 2034

Figure 54: North America Market Value Share (%) and BPS Analysis by Sales Channel, 2024 to 2034

Figure 55: North America Market Y-o-Y Growth (%) Projections by Sales Channel, 2024 to 2034

Figure 56: North America Market Attractiveness by Source, 2024 to 2034

Figure 57: North America Market Attractiveness by Form, 2024 to 2034

Figure 58: North America Market Attractiveness by Application, 2024 to 2034

Figure 59: North America Market Attractiveness by Sales Channel, 2024 to 2034

Figure 60: North America Market Attractiveness by Country, 2024 to 2034

Figure 61: Latin America Market Value (US$ Million) by Source, 2024 to 2034

Figure 62: Latin America Market Value (US$ Million) by Form, 2024 to 2034

Figure 63: Latin America Market Value (US$ Million) by Application, 2024 to 2034

Figure 64: Latin America Market Value (US$ Million) by Sales Channel, 2024 to 2034

Figure 65: Latin America Market Value (US$ Million) by Country, 2024 to 2034

Figure 66: Latin America Market Value (US$ Million) Analysis by Country, 2019 to 2034

Figure 67: Latin America Market Volume (Unit Pack) Analysis by Country, 2019 to 2034

Figure 68: Latin America Market Value Share (%) and BPS Analysis by Country, 2024 to 2034

Figure 69: Latin America Market Y-o-Y Growth (%) Projections by Country, 2024 to 2034

Figure 70: Latin America Market Value (US$ Million) Analysis by Source, 2019 to 2034

Figure 71: Latin America Market Volume (Unit Pack) Analysis by Source, 2019 to 2034

Figure 72: Latin America Market Value Share (%) and BPS Analysis by Source, 2024 to 2034

Figure 73: Latin America Market Y-o-Y Growth (%) Projections by Source, 2024 to 2034

Figure 74: Latin America Market Value (US$ Million) Analysis by Form, 2019 to 2034

Figure 75: Latin America Market Volume (Unit Pack) Analysis by Form, 2019 to 2034

Figure 76: Latin America Market Value Share (%) and BPS Analysis by Form, 2024 to 2034

Figure 77: Latin America Market Y-o-Y Growth (%) Projections by Form, 2024 to 2034

Figure 78: Latin America Market Value (US$ Million) Analysis by Application, 2019 to 2034

Figure 79: Latin America Market Volume (Unit Pack) Analysis by Application, 2019 to 2034

Figure 80: Latin America Market Value Share (%) and BPS Analysis by Application, 2024 to 2034

Figure 81: Latin America Market Y-o-Y Growth (%) Projections by Application, 2024 to 2034

Figure 82: Latin America Market Value (US$ Million) Analysis by Sales Channel, 2019 to 2034

Figure 83: Latin America Market Volume (Unit Pack) Analysis by Sales Channel, 2019 to 2034

Figure 84: Latin America Market Value Share (%) and BPS Analysis by Sales Channel, 2024 to 2034

Figure 85: Latin America Market Y-o-Y Growth (%) Projections by Sales Channel, 2024 to 2034

Figure 86: Latin America Market Attractiveness by Source, 2024 to 2034

Figure 87: Latin America Market Attractiveness by Form, 2024 to 2034

Figure 88: Latin America Market Attractiveness by Application, 2024 to 2034

Figure 89: Latin America Market Attractiveness by Sales Channel, 2024 to 2034

Figure 90: Latin America Market Attractiveness by Country, 2024 to 2034

Figure 91: Western Europe Market Value (US$ Million) by Source, 2024 to 2034

Figure 92: Western Europe Market Value (US$ Million) by Form, 2024 to 2034

Figure 93: Western Europe Market Value (US$ Million) by Application, 2024 to 2034

Figure 94: Western Europe Market Value (US$ Million) by Sales Channel, 2024 to 2034

Figure 95: Western Europe Market Value (US$ Million) by Country, 2024 to 2034

Figure 96: Western Europe Market Value (US$ Million) Analysis by Country, 2019 to 2034

Figure 97: Western Europe Market Volume (Unit Pack) Analysis by Country, 2019 to 2034

Figure 98: Western Europe Market Value Share (%) and BPS Analysis by Country, 2024 to 2034

Figure 99: Western Europe Market Y-o-Y Growth (%) Projections by Country, 2024 to 2034

Figure 100: Western Europe Market Value (US$ Million) Analysis by Source, 2019 to 2034

Figure 101: Western Europe Market Volume (Unit Pack) Analysis by Source, 2019 to 2034

Figure 102: Western Europe Market Value Share (%) and BPS Analysis by Source, 2024 to 2034

Figure 103: Western Europe Market Y-o-Y Growth (%) Projections by Source, 2024 to 2034

Figure 104: Western Europe Market Value (US$ Million) Analysis by Form, 2019 to 2034

Figure 105: Western Europe Market Volume (Unit Pack) Analysis by Form, 2019 to 2034

Figure 106: Western Europe Market Value Share (%) and BPS Analysis by Form, 2024 to 2034

Figure 107: Western Europe Market Y-o-Y Growth (%) Projections by Form, 2024 to 2034

Figure 108: Western Europe Market Value (US$ Million) Analysis by Application, 2019 to 2034

Figure 109: Western Europe Market Volume (Unit Pack) Analysis by Application, 2019 to 2034

Figure 110: Western Europe Market Value Share (%) and BPS Analysis by Application, 2024 to 2034

Figure 111: Western Europe Market Y-o-Y Growth (%) Projections by Application, 2024 to 2034

Figure 112: Western Europe Market Value (US$ Million) Analysis by Sales Channel, 2019 to 2034

Figure 113: Western Europe Market Volume (Unit Pack) Analysis by Sales Channel, 2019 to 2034

Figure 114: Western Europe Market Value Share (%) and BPS Analysis by Sales Channel, 2024 to 2034

Figure 115: Western Europe Market Y-o-Y Growth (%) Projections by Sales Channel, 2024 to 2034

Figure 116: Western Europe Market Attractiveness by Source, 2024 to 2034

Figure 117: Western Europe Market Attractiveness by Form, 2024 to 2034

Figure 118: Western Europe Market Attractiveness by Application, 2024 to 2034

Figure 119: Western Europe Market Attractiveness by Sales Channel, 2024 to 2034

Figure 120: Western Europe Market Attractiveness by Country, 2024 to 2034

Figure 121: Eastern Europe Market Value (US$ Million) by Source, 2024 to 2034

Figure 122: Eastern Europe Market Value (US$ Million) by Form, 2024 to 2034

Figure 123: Eastern Europe Market Value (US$ Million) by Application, 2024 to 2034

Figure 124: Eastern Europe Market Value (US$ Million) by Sales Channel, 2024 to 2034

Figure 125: Eastern Europe Market Value (US$ Million) by Country, 2024 to 2034

Figure 126: Eastern Europe Market Value (US$ Million) Analysis by Country, 2019 to 2034

Figure 127: Eastern Europe Market Volume (Unit Pack) Analysis by Country, 2019 to 2034

Figure 128: Eastern Europe Market Value Share (%) and BPS Analysis by Country, 2024 to 2034

Figure 129: Eastern Europe Market Y-o-Y Growth (%) Projections by Country, 2024 to 2034

Figure 130: Eastern Europe Market Value (US$ Million) Analysis by Source, 2019 to 2034

Figure 131: Eastern Europe Market Volume (Unit Pack) Analysis by Source, 2019 to 2034

Figure 132: Eastern Europe Market Value Share (%) and BPS Analysis by Source, 2024 to 2034

Figure 133: Eastern Europe Market Y-o-Y Growth (%) Projections by Source, 2024 to 2034

Figure 134: Eastern Europe Market Value (US$ Million) Analysis by Form, 2019 to 2034

Figure 135: Eastern Europe Market Volume (Unit Pack) Analysis by Form, 2019 to 2034

Figure 136: Eastern Europe Market Value Share (%) and BPS Analysis by Form, 2024 to 2034

Figure 137: Eastern Europe Market Y-o-Y Growth (%) Projections by Form, 2024 to 2034

Figure 138: Eastern Europe Market Value (US$ Million) Analysis by Application, 2019 to 2034

Figure 139: Eastern Europe Market Volume (Unit Pack) Analysis by Application, 2019 to 2034

Figure 140: Eastern Europe Market Value Share (%) and BPS Analysis by Application, 2024 to 2034

Figure 141: Eastern Europe Market Y-o-Y Growth (%) Projections by Application, 2024 to 2034

Figure 142: Eastern Europe Market Value (US$ Million) Analysis by Sales Channel, 2019 to 2034

Figure 143: Eastern Europe Market Volume (Unit Pack) Analysis by Sales Channel, 2019 to 2034

Figure 144: Eastern Europe Market Value Share (%) and BPS Analysis by Sales Channel, 2024 to 2034

Figure 145: Eastern Europe Market Y-o-Y Growth (%) Projections by Sales Channel, 2024 to 2034

Figure 146: Eastern Europe Market Attractiveness by Source, 2024 to 2034

Figure 147: Eastern Europe Market Attractiveness by Form, 2024 to 2034

Figure 148: Eastern Europe Market Attractiveness by Application, 2024 to 2034

Figure 149: Eastern Europe Market Attractiveness by Sales Channel, 2024 to 2034

Figure 150: Eastern Europe Market Attractiveness by Country, 2024 to 2034

Figure 151: South Asia and Pacific Market Value (US$ Million) by Source, 2024 to 2034

Figure 152: South Asia and Pacific Market Value (US$ Million) by Form, 2024 to 2034

Figure 153: South Asia and Pacific Market Value (US$ Million) by Application, 2024 to 2034

Figure 154: South Asia and Pacific Market Value (US$ Million) by Sales Channel, 2024 to 2034

Figure 155: South Asia and Pacific Market Value (US$ Million) by Country, 2024 to 2034

Figure 156: South Asia and Pacific Market Value (US$ Million) Analysis by Country, 2019 to 2034

Figure 157: South Asia and Pacific Market Volume (Unit Pack) Analysis by Country, 2019 to 2034

Figure 158: South Asia and Pacific Market Value Share (%) and BPS Analysis by Country, 2024 to 2034

Figure 159: South Asia and Pacific Market Y-o-Y Growth (%) Projections by Country, 2024 to 2034

Figure 160: South Asia and Pacific Market Value (US$ Million) Analysis by Source, 2019 to 2034

Figure 161: South Asia and Pacific Market Volume (Unit Pack) Analysis by Source, 2019 to 2034

Figure 162: South Asia and Pacific Market Value Share (%) and BPS Analysis by Source, 2024 to 2034

Figure 163: South Asia and Pacific Market Y-o-Y Growth (%) Projections by Source, 2024 to 2034

Figure 164: South Asia and Pacific Market Value (US$ Million) Analysis by Form, 2019 to 2034

Figure 165: South Asia and Pacific Market Volume (Unit Pack) Analysis by Form, 2019 to 2034

Figure 166: South Asia and Pacific Market Value Share (%) and BPS Analysis by Form, 2024 to 2034

Figure 167: South Asia and Pacific Market Y-o-Y Growth (%) Projections by Form, 2024 to 2034

Figure 168: South Asia and Pacific Market Value (US$ Million) Analysis by Application, 2019 to 2034

Figure 169: South Asia and Pacific Market Volume (Unit Pack) Analysis by Application, 2019 to 2034

Figure 170: South Asia and Pacific Market Value Share (%) and BPS Analysis by Application, 2024 to 2034

Figure 171: South Asia and Pacific Market Y-o-Y Growth (%) Projections by Application, 2024 to 2034

Figure 172: South Asia and Pacific Market Value (US$ Million) Analysis by Sales Channel, 2019 to 2034

Figure 173: South Asia and Pacific Market Volume (Unit Pack) Analysis by Sales Channel, 2019 to 2034

Figure 174: South Asia and Pacific Market Value Share (%) and BPS Analysis by Sales Channel, 2024 to 2034

Figure 175: South Asia and Pacific Market Y-o-Y Growth (%) Projections by Sales Channel, 2024 to 2034

Figure 176: South Asia and Pacific Market Attractiveness by Source, 2024 to 2034

Figure 177: South Asia and Pacific Market Attractiveness by Form, 2024 to 2034

Figure 178: South Asia and Pacific Market Attractiveness by Application, 2024 to 2034

Figure 179: South Asia and Pacific Market Attractiveness by Sales Channel, 2024 to 2034

Figure 180: South Asia and Pacific Market Attractiveness by Country, 2024 to 2034

Figure 181: East Asia Market Value (US$ Million) by Source, 2024 to 2034

Figure 182: East Asia Market Value (US$ Million) by Form, 2024 to 2034

Figure 183: East Asia Market Value (US$ Million) by Application, 2024 to 2034

Figure 184: East Asia Market Value (US$ Million) by Sales Channel, 2024 to 2034

Figure 185: East Asia Market Value (US$ Million) by Country, 2024 to 2034

Figure 186: East Asia Market Value (US$ Million) Analysis by Country, 2019 to 2034

Figure 187: East Asia Market Volume (Unit Pack) Analysis by Country, 2019 to 2034

Figure 188: East Asia Market Value Share (%) and BPS Analysis by Country, 2024 to 2034

Figure 189: East Asia Market Y-o-Y Growth (%) Projections by Country, 2024 to 2034

Figure 190: East Asia Market Value (US$ Million) Analysis by Source, 2019 to 2034

Figure 191: East Asia Market Volume (Unit Pack) Analysis by Source, 2019 to 2034

Figure 192: East Asia Market Value Share (%) and BPS Analysis by Source, 2024 to 2034

Figure 193: East Asia Market Y-o-Y Growth (%) Projections by Source, 2024 to 2034

Figure 194: East Asia Market Value (US$ Million) Analysis by Form, 2019 to 2034

Figure 195: East Asia Market Volume (Unit Pack) Analysis by Form, 2019 to 2034

Figure 196: East Asia Market Value Share (%) and BPS Analysis by Form, 2024 to 2034

Figure 197: East Asia Market Y-o-Y Growth (%) Projections by Form, 2024 to 2034

Figure 198: East Asia Market Value (US$ Million) Analysis by Application, 2019 to 2034

Figure 199: East Asia Market Volume (Unit Pack) Analysis by Application, 2019 to 2034

Figure 200: East Asia Market Value Share (%) and BPS Analysis by Application, 2024 to 2034

Figure 201: East Asia Market Y-o-Y Growth (%) Projections by Application, 2024 to 2034

Figure 202: East Asia Market Value (US$ Million) Analysis by Sales Channel, 2019 to 2034

Figure 203: East Asia Market Volume (Unit Pack) Analysis by Sales Channel, 2019 to 2034

Figure 204: East Asia Market Value Share (%) and BPS Analysis by Sales Channel, 2024 to 2034

Figure 205: East Asia Market Y-o-Y Growth (%) Projections by Sales Channel, 2024 to 2034

Figure 206: East Asia Market Attractiveness by Source, 2024 to 2034

Figure 207: East Asia Market Attractiveness by Form, 2024 to 2034

Figure 208: East Asia Market Attractiveness by Application, 2024 to 2034

Figure 209: East Asia Market Attractiveness by Sales Channel, 2024 to 2034

Figure 210: East Asia Market Attractiveness by Country, 2024 to 2034

Figure 211: Middle East and Africa Market Value (US$ Million) by Source, 2024 to 2034

Figure 212: Middle East and Africa Market Value (US$ Million) by Form, 2024 to 2034

Figure 213: Middle East and Africa Market Value (US$ Million) by Application, 2024 to 2034

Figure 214: Middle East and Africa Market Value (US$ Million) by Sales Channel, 2024 to 2034

Figure 215: Middle East and Africa Market Value (US$ Million) by Country, 2024 to 2034

Figure 216: Middle East and Africa Market Value (US$ Million) Analysis by Country, 2019 to 2034

Figure 217: Middle East and Africa Market Volume (Unit Pack) Analysis by Country, 2019 to 2034

Figure 218: Middle East and Africa Market Value Share (%) and BPS Analysis by Country, 2024 to 2034

Figure 219: Middle East and Africa Market Y-o-Y Growth (%) Projections by Country, 2024 to 2034

Figure 220: Middle East and Africa Market Value (US$ Million) Analysis by Source, 2019 to 2034

Figure 221: Middle East and Africa Market Volume (Unit Pack) Analysis by Source, 2019 to 2034

Figure 222: Middle East and Africa Market Value Share (%) and BPS Analysis by Source, 2024 to 2034

Figure 223: Middle East and Africa Market Y-o-Y Growth (%) Projections by Source, 2024 to 2034

Figure 224: Middle East and Africa Market Value (US$ Million) Analysis by Form, 2019 to 2034

Figure 225: Middle East and Africa Market Volume (Unit Pack) Analysis by Form, 2019 to 2034

Figure 226: Middle East and Africa Market Value Share (%) and BPS Analysis by Form, 2024 to 2034

Figure 227: Middle East and Africa Market Y-o-Y Growth (%) Projections by Form, 2024 to 2034

Figure 228: Middle East and Africa Market Value (US$ Million) Analysis by Application, 2019 to 2034

Figure 229: Middle East and Africa Market Volume (Unit Pack) Analysis by Application, 2019 to 2034

Figure 230: Middle East and Africa Market Value Share (%) and BPS Analysis by Application, 2024 to 2034

Figure 231: Middle East and Africa Market Y-o-Y Growth (%) Projections by Application, 2024 to 2034

Figure 232: Middle East and Africa Market Value (US$ Million) Analysis by Sales Channel, 2019 to 2034

Figure 233: Middle East and Africa Market Volume (Unit Pack) Analysis by Sales Channel, 2019 to 2034

Figure 234: Middle East and Africa Market Value Share (%) and BPS Analysis by Sales Channel, 2024 to 2034

Figure 235: Middle East and Africa Market Y-o-Y Growth (%) Projections by Sales Channel, 2024 to 2034

Figure 236: Middle East and Africa Market Attractiveness by Source, 2024 to 2034

Figure 237: Middle East and Africa Market Attractiveness by Form, 2024 to 2034

Figure 238: Middle East and Africa Market Attractiveness by Application, 2024 to 2034

Figure 239: Middle East and Africa Market Attractiveness by Sales Channel, 2024 to 2034

Figure 240: Middle East and Africa Market Attractiveness by Country, 2024 to 2034

Frequently Asked Questions

At what rate will the collagen water market propel during the forecasted period?

The collagen water market will progress at a CAGR of 8.3% through 2034.

What will the market size of the collagen water market be by 2034?

The collagen water market will reach USD 10.76 billion by 2034.

What will the market size of the collagen water market be by 2024?

The collagen water market will reach USD 4.87 billion by 2024.

Based on application, which category will secure the highest market share in the collagen water market?

The collagen water market's cosmetics and personal care industry segment will hold the largest, 32.7% of the market space.

Based on the sales channel, which category will secure the highest market share in the collagen water market?

The collagen water market's specialty stores segment will hold the largest, 23.5% of the market space.

Explore Similar Insights

Future Market Insights

Collagen Water Market