Reports

- Global Locations -

Headquarters

Future Market Insights, Inc.

Christiana Corporate, 200
Continental Drive, Suite 401,
Newark, Delaware - 19713,
United States

T: +1-845-579-5705

Americas

Future Market Insights, Inc.

616 Corporate Way, Suite 2-9018,
Valley Cottage, NY 10989, United States

T: +1-347-918-3531

MEA

Future Market Insights

1602-6 Jumeirah Bay X2 Tower, Plot No: JLT-PH2-X2A,
Jumeirah Lakes Towers, Dubai,
United Arab Emirates

Europe

Future Market Insights

3rd Floor, 207 Regent Street,
W1B 3HH London
United Kingdom

T: + 44 (0) 20 8123 9659
D: +44 (0) 20 3287 4268

Asia Pacific

Future Market Insights

IndiaLand Global Tech Park, Unit UG-1, Behind Grand HighStreet, Phase 1, Hinjawadi, MH, Pune – 411057, India

Global Collagen Supplement Market Outlook for 2024 to 2034

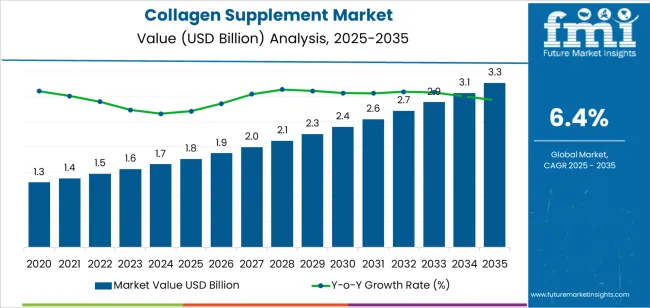
The global collagen supplement market size is estimated to be valued at around US$ 1,655.7 million in 2024. The global demand for collagen supplement drinks and food items is predicted to grow at a moderate CAGR of 6.4% during the forecast period. The global collagen supplement industry share is forecast to reach a value of nearly US$ 3,089.7 million by 2034.

Collagen Supplement Market Trends & Analysis

  • Increases in healthcare and personal care expenditures across the globe, most notably in developing countries.
  • Healthcare supplements are being developed to meet the needs of an expanding urban population.
  • Continuous introduction of skin care products that are more environmentally friendly and effective against broader skin care regimes to grow the market.
  • A growing market for immune health supplements requires an increase in consumer awareness.
Report Attribute Details
Collagen Supplement Market Size (2024) US$ 1,655.7 million
Market Anticipated Forecast Value (2034) US$ 3,089.7 million
Market Projected Growth Rate (2024 to 2034) 6.4% CAGR

Don't pay for what you don't need

Customize your report by selecting specific countries or regions and save 30%!

Global Collagen Supplement Market Historical Analysis Vs Forecast Outlook

The global collagen supplement market was valued at US$ 1,269.7 million in 2019. The overall market value increased at a rate of 5.99% between 2019 and 2023 culminating at a valuation of US$ 1,655.7 million by 2023 end.

The pandemic affected the market by temporarily closing businesses and retail outlets. Despite this, wholesalers and exporters were been able to find new ways to increase productivity and improve safety protocols because of this pandemic. Moreover, the pandemic period emphasized the role of supplements in maintaining health and wellness of Covid-19 patients with mild symptoms.

Attributes Details
Collagen Supplement Market Value (2019) US$ 1,269.7 million
Market Historical Growth Rate (CAGR 2019 to 2023) 5.99% CAGR

Prominent Factors Fuelling the Global Collagen Supplement Market Growth

The demand for collagen supplements is likely to be driven by a growing preference for supplements that reduce medical costs. Also, a growing middle-class population as well as the growing import demand for collagen has been facilitated by the emergence of nutritional awareness. In addition, the scientific evidence supporting the claims of the company will also be introduced which will further boost collagen supplement sales.

There is a growing demand from consumers for flavored gummies, which is expected to continue to drive the market further. As a result, increased spending on research and development activities by key players to develop collagen supplements with native fruits and ingredients is expected to strengthen the market outlook.

Nandini Roy Choudhury

Principal Consultant

Talk to Analyst

Find your sweet spots for generating winning opportunities in this market.

Comparative View of Adjacent Collagen Supplement Market

The section below represents a comparative overview of trends and opportunities in different other markets that are related to the target market. Collagen supplements sales are likely to account for nearly 2% of the overall dietary supplements market value which is expected to be US$ 74.3 billion in 2024. On the other hand, a promising growth prospect for the global oral clinical nutrition supplement market is likely to create more opportunities for collagen supplement manufacturers.

Collagen Supplement Market:

Attributes Collagen Supplement Market
CAGR (2024 to 2034) 6.4%
Growth Factor Collagen peptides including di and tripeptides are becoming more widely known for their nutritious effects on human nutrition.
Market Opportunities The increasing purchasing power of consumers in developing economies is expected to contribute to further expansion of the market.
Market Challenges The supplement-infused beauty industry is transforming faster than regulations can keep up with.

Dietary Supplement Market:

Attributes Dietary Supplement Market
CAGR (2024 to 2034) 9.5%
Growth Factor Dietary supplements provide medical benefits such as relieving pain and preventing or reducing cartilage breakdown and joint pain.
Market Opportunities Pharmacy is emerging as the most sustainable distribution channel type for dietary supplements.
Market Challenges Sourcing of raw materials and ingredients for the production of dietary supplements is getting limited with rising competition.

Oral Clinical Nutrition Supplement Market:

Attributes Oral Clinical Nutrition Supplement Market
CAGR (2024 to 2034) 6.2%
Growth Factor Growing healthcare and medicine costs are influencing consumers to choose oral clinical nutrition supplements.
Market Opportunities The increased consumer awareness and the development of new delivery forms to fuel clinical nutrition supplement sales.
Market Challenges Clinical nutrition ingredients costs have more than doubled in recent years, owing to supply constraints.

Country-wise Insights

The table below lists the prominent countries that are figured to thrive at a lucrative CAGR in sales of collagen supplement food and beverages.

Regional Market Comparison CAGR (2024 to 2034)
United States 6.2%
Germany 6%
Japan 5%
India 5.8%
China 5.4%

Higher Spending Capacity of the United States Citizens Favors Collagen Supplement Sales

The United States dominates the North American collagen supplement market and is likely to register a 6.2% CAGR through 2034.

  • The rise in consumer awareness regarding the potential advantages of collagen tripeptides and peptides incorporated into health and nutrition.
  • An upsurge in collagen manufacturers' investment opportunities, combined with the increases in consumer consciousness of collagen supplements.

Elderly People are driving the demand for Collagen Supplements in Germany

Demand for collagen supplements in Germany is expected to grow at a rate of 6% over the forecast years.

  • Joint and bone health supplements have become one of the most popular nutritional supplement choices among the elderly in the country,
  • Hydrolyzed collagen supplements have gained traction both in the cosmetics and nutrition product manufacturing industries based in Germany.

Higher Use of Collagen Supplements for Athletes and Sportsmen of China

The collagen supplement industry in China is expected to expand at a rate of 5.4% through the projected years.

  • Greater emphasis on diet plans for athletes has increased the sales of collagen-infused drinks and food items in the country.
  • The increasing geriatric population in China is anticipated to drive the sales of collagen supplements through the projected years.

Collagen Supplement is Boon for Japanese Striving for Natural Beauty

Collagen sales in Japan are likely to increase at a rate of 5% per year between 2024 and 2034.

  • An increasing number of Japanese consumers are consuming supplements and vitamins for natural beauty.
  • Japanese are also increasingly inculcating collagen supplements as a remedy for inflammatory bone diseases, arthritis, and rheumatoid arthritis.

India to Emerge Most Promising Market for Collagen Supplement Suppliers in Asia

India is expected to witness the most lucrative CAGR of 5.8% for sales of collagen supplements in Asia through 2034.

  • A rising disposable income and a growing awareness of the importance of skin and hair are anticipated to fuel the demand for collagen supplements.
  • The better performance of the collagen supplement industry in this country can be attributed to the promotion of Ayurvedic medicines and trust in natural and organic ingredients.

Get the data you need at a Fraction of the cost

Personalize your report by choosing insights you need
and save 40%!

Category-wise Insights

Gelatin is Preferred more than other Types of Collagen

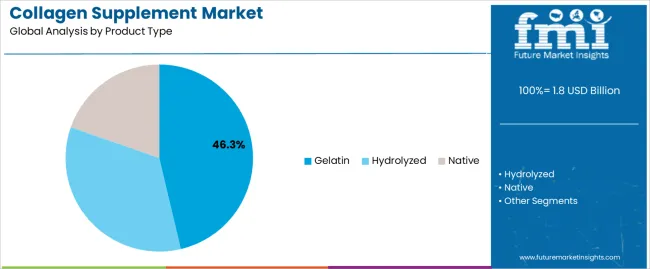
On the basis of product type, gelatin collagen supplements are expected to account for 62.7% of the global market. However, the hydrolyzed collagen supplements are expected to witness a significant growth rate over the forecast period.

Attributes Details
Top Product Type or Segment Gelatin
Total Market Share in 2024 62.7%
  • Owing to its ability to encourage bone development, the gelatin is gaining popularity in nutritional products as a bone void filler.
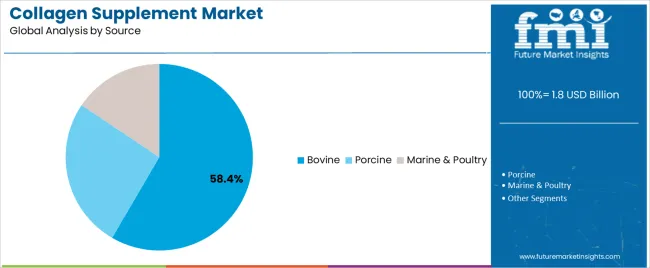
  • Bovine-based raw materials are easily accessible and have lower prices than marine and porcine.

Collagen Supplements are sold more in Pills and Gummy Form

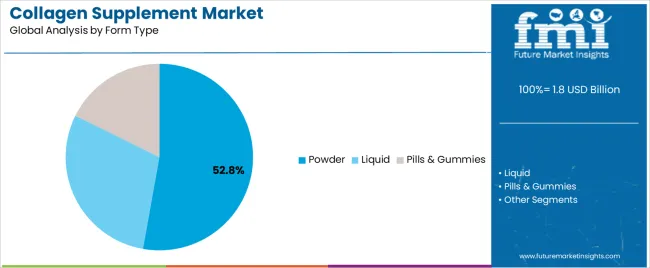
According to FMI, pills & gummies are expected to contribute to 58.7% of the total sales in the global market. On the other hand, powder collagen supplements are expected to witness a lucrative growth rate over the forecast period.

Attributes Details
Top Form Type or Segment Pills & Gummies
Total Market Share in 2024 58.7%
  • Healthy changes in daily routines as a result of increased consciousness about preventative medicine, have resulted in increased consumption of gummies.
  • The sales of collagen pills and gummies via modern trade or online retail stores are expected to further strengthen this market segment.

Competitive Landscape for Collagen Supplement Market

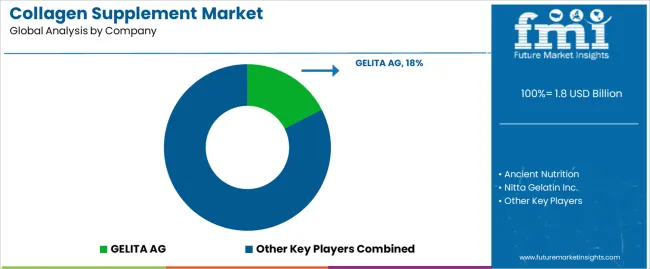
The global collagen protein supplement market is currently moderately competitive and the rivalry is expected to intense during the projected years. Key players operating in collagen supplements have limited manufacturing capacity, with product manufacturing plants located close to raw material sources, resulting in low prices of raw materials. Manufacturers are also involved in the product's distribution via vast distribution channels distributed across developed economies such as North America and Europe.

Recent Developments in the Global Collagen Supplement Market

  • In February 2024, Loreal developed the second iteration of its Age Perfect Collagen Royal Anti-Aging Face Cream, effectively tapping into the rapidly expanding recombinant collagen market in China.
  • In November 2023, Elemis declared to introduce Pro-Collagen Skin Future Supplements in 2024. The product containing food-grade hyaluronic acid, an antioxidant combination, chlorella, and vitamins A and C ingredients is priced at US$ 99 and is available only at QVC.
  • In 2020, Life Extension Introduces a New Hydrolyzed Collagen Supplement: Peptides of Collagen for Skin and Joints.
  • In 2021, Ancient Nutrition, a supplement company based on regenerative agriculture, launched its latest line of collagen peptide formulas, which are clinically proven to deliver efficacious results in as little as one day.

Key Players Profiled in the Collagen Supplement Market Report

  • Ancient Nutrition
  • Nitta Gelatin Inc.
  • Darling Ingredients Inc.
  • Koninklijke DSM N.V.
  • CONNOILS LL
  • Collagen Matrix
  • Titan Biotech Ltd
  • Protein SA
  • Life Extension
  • GELITA AG
  • Weishardt
  • Tessenderlo Group NV
  • LAPI GELATINE S.p.a.
  • ITALGELATINE S.p.A.
  • Trobas Gelatine B.V.

Key Coverage in the Collagen Supplement Market Report

  • Adjacent study on oral collagen supplement market.
  • Market overview of marine collagen supplement products
  • Emerging trends in beuty collagen supplements
  • Consumer demand for joint collagen supplements
  • Collagen peptides industry analysis

Collagen Supplement Market Report Scope

Attribute Details
Estimated Market Size (2024) US$ 1,655.7 million
Projected Market Size (2034) US$ 3,089.7 million
Anticipated Growth Rate (2024 to 2034) 6.4%
Forecast Period 2024 to 2034
Historical Data Available for 2019 to 2023
Market Analysis US$ million or billion for Value and Units for Volume
Key Regions Covered North America, Latin America, Europe, Middle East & Africa (MEA), East Asia, South Asia and Oceania
Key Countries Covered United States, Canada, Brazil, Mexico, Germany, Spain, Italy, France, United Kingdom, Russia, China, India, Australia & New Zealand, GCC Countries, and South Africa
Key Segments Covered By Product Type, By Form, By Source, By End Use Verticals, B Sales Channel, and By Region
Key Companies Profiled
  • Ancient Nutrition
  • Nitta Gelatin Inc.
  • Darling Ingredients Inc.
  • Koninklijke DSM N.V.
  • CONNOILS LL
  • Collagen Matrix
  • Titan Biotech Ltd
  • Protein SA
  • Life Extension
  • GELITA AG
  • Weishardt
  • Tessenderlo Group NV
  • LAPI GELATINE S.p.a.
  • ITALGELATINE S.p.A.
  • Trobas Gelatine B.V.
Report Coverage Market Forecast, Company Share Analysis, Competition Intelligence, DROT Analysis, Market Dynamics and Challenges, and Strategic Growth Initiatives
Customization & Pricing Available upon Request

Key Segments Covered by Collagen Supplement Industry Survey Report

By Product Type:

  • Gelatin
  • Hydrolyzed
  • Native

By Form Type:

  • Powder
  • Liquid
  • Pills & Gummies

By Source:

  • Bovine
  • Porcine
  • Marine & Poultry

By End Use:

  • Nutritional Products
  • Snacks & Cereals
  • Dairy Products
  • Beverages
  • Meat & Poultry
  • Bakery & Confectionery
  • Other End Users

By Sales Channel:

  • B2B or Direct Sales
  • B2C or Indirect Sales
    • Modern Trade
    • Traditional Grocery Stores
    • Convenience Stores
    • Specialty Stores
    • Online Retail Stores
    • Others

By Region:

  • North America
  • Latin America
  • Europe
  • East Asia
  • South Asia and Pacific
  • Middle East and Africa (MEA)

Frequently Asked Questions

How Big is the Global Collagen Supplement Market Currently?

The global collagen supplement market is estimated to be US$ 1,655.7 million in 2024.

What is the Growth Outlook of the Collagen Supplement Market?

The global collagen supplement market is to grow at 6.4% during the forecast period.

What is the projected Value of Collagen Supplement Market by 2034?

The global collagen supplement market to be valued at US$ 3,089.7 million by 2034.

What was the Historical Size of the Collagen Supplement Market?

The global collagen supplement market was valued at US$ 1,269.7 million in 2019.

Which Product Type Sales more in the Global Collagen Supplement Market?

Gelatin accounts for nearly 62.7% share of the global collagen supplement market.

Which Regional Collagen Supplement Market has the Highest Growth Potential?

The United States to witness 6.2% CAGR in sales of collagen supplement through 2034.

Table of Content

1. Executive Summary

    1.1. Global Market Outlook

    1.2. Demand-side Trends

    1.3. Supply-side Trends

    1.4. Technology Roadmap Analysis

    1.5. Analysis and Recommendations

2. Market Overview

    2.1. Market Coverage / Taxonomy

    2.2. Market Definition / Scope / Limitations

3. Market Background

    3.1. Market Dynamics

        3.1.1. Drivers

        3.1.2. Restraints

        3.1.3. Opportunity

        3.1.4. Trends

    3.2. Scenario Forecast

        3.2.1. Demand in Optimistic Scenario

        3.2.2. Demand in Likely Scenario

        3.2.3. Demand in Conservative Scenario

    3.3. Opportunity Map Analysis

    3.4. Product Life Cycle Analysis

    3.5. Supply Chain Analysis

        3.5.1. Supply Side Participants and their Roles

            3.5.1.1. Manufacturer

            3.5.1.2. Mid-Level Participants (Traders)

            3.5.1.3. Wholesalers and Distributors

        3.5.2. Value Added and Value Created at Node in the Supply Chain

        3.5.3. List of Raw Material Suppliers

        3.5.4. List of Existing and Potential Buyer’s

    3.6. Investment Feasibility Matrix

    3.7. Value Chain Analysis

        3.7.1. Profit Margin Analysis

        3.7.2. Wholesalers and Distributors

        3.7.3. Retailers

    3.8. PESTLE and Porter’s Analysis

    3.9. Regulatory Landscape

        3.9.1. By Key Regions

        3.9.2. By Key Countries

    3.10. Regional Parent Market Outlook

    3.11. Production and Consumption Statistics

    3.12. Import and Export Statistics

4. Global Market Analysis 2019 to 2023 and Forecast, 2024 to 2034

    4.1. Historical Market Size Value (US$ Million) & Volume (Unit Pack) Analysis, 2019 to 2023

    4.2. Current and Future Market Size Value (US$ Million) & Volume (Unit Pack) Projections, 2024 to 2034

        4.2.1. Y-o-Y Growth Trend Analysis

        4.2.2. Absolute $ Opportunity Analysis

5. Global Market Analysis 2019 to 2023 and Forecast 2024 to 2034, By Product Type

    5.1. Introduction / Key Findings

    5.2. Historical Market Size Value (US$ Million) & Volume (Unit Pack) Analysis By Product Type, 2019 to 2023

    5.3. Current and Future Market Size Value (US$ Million) & Volume (Unit Pack) Analysis and Forecast By Product Type, 2024 to 2034

        5.3.1. Gelatin

        5.3.2. Hydrolyzed

        5.3.3. Native

    5.4. Y-o-Y Growth Trend Analysis By Product Type, 2019 to 2023

    5.5. Absolute $ Opportunity Analysis By Product Type, 2024 to 2034

6. Global Market Analysis 2019 to 2023 and Forecast 2024 to 2034, By Form

    6.1. Introduction / Key Findings

    6.2. Historical Market Size Value (US$ Million) & Volume (Unit Pack) Analysis By Form, 2019 to 2023

    6.3. Current and Future Market Size Value (US$ Million) & Volume (Unit Pack) Analysis and Forecast By Form, 2024 to 2034

        6.3.1. Powder

        6.3.2. Liquid

        6.3.3. Pills & Gummies

    6.4. Y-o-Y Growth Trend Analysis By Form, 2019 to 2023

    6.5. Absolute $ Opportunity Analysis By Form, 2024 to 2034

7. Global Market Analysis 2019 to 2023 and Forecast 2024 to 2034, By Source

    7.1. Introduction / Key Findings

    7.2. Historical Market Size Value (US$ Million) & Volume (Unit Pack) Analysis By Source, 2019 to 2023

    7.3. Current and Future Market Size Value (US$ Million) & Volume (Unit Pack) Analysis and Forecast By Source, 2024 to 2034

        7.3.1. Bovine

        7.3.2. Porcine

        7.3.3. Marine & Poultry

        7.3.4. Plant

    7.4. Y-o-Y Growth Trend Analysis By Source, 2019 to 2023

    7.5. Absolute $ Opportunity Analysis By Source, 2024 to 2034

8. Global Market Analysis 2019 to 2023 and Forecast 2024 to 2034, By End-User

    8.1. Introduction / Key Findings

    8.2. Historical Market Size Value (US$ Million) & Volume (Unit Pack) Analysis By End-User, 2019 to 2023

    8.3. Current and Future Market Size Value (US$ Million) & Volume (Unit Pack) Analysis and Forecast By End-User, 2024 to 2034

        8.3.1. Nutritional Products

        8.3.2. Snacks & Cereals

        8.3.3. Dairy Products

        8.3.4. Beverages

        8.3.5. Meat & Poultry

        8.3.6. Bakery & Confectionery

    8.4. Y-o-Y Growth Trend Analysis By End-User, 2019 to 2023

    8.5. Absolute $ Opportunity Analysis By End-User, 2024 to 2034

9. Global Market Analysis 2019 to 2023 and Forecast 2024 to 2034, By Sales Channel

    9.1. Introduction / Key Findings

    9.2. Historical Market Size Value (US$ Million) & Volume (Unit Pack) Analysis By Sales Channel, 2019 to 2023

    9.3. Current and Future Market Size Value (US$ Million) & Volume (Unit Pack) Analysis and Forecast By Sales Channel, 2024 to 2034

        9.3.1. B2B/Direct Sales

        9.3.2. B2C/Indirect Sales

            9.3.2.1. Modern Trade

            9.3.2.2. Traditional Grocery Stores

            9.3.2.3. Convenience Stores

            9.3.2.4. Specialty Stores

            9.3.2.5. Online Retail Stores

            9.3.2.6. Others

    9.4. Y-o-Y Growth Trend Analysis By Sales Channel, 2019 to 2023

    9.5. Absolute $ Opportunity Analysis By Sales Channel, 2024 to 2034

10. Global Market Analysis 2019 to 2023 and Forecast 2024 to 2034, By Region

    10.1. Introduction

    10.2. Historical Market Size Value (US$ Million) & Volume (Unit Pack) Analysis By Region, 2019 to 2023

    10.3. Current Market Size Value (US$ Million) & Volume (Unit Pack) Analysis and Forecast By Region, 2024 to 2034

        10.3.1. North America

        10.3.2. Latin America

        10.3.3. Western Europe

        10.3.4. Eastern Europe

        10.3.5. South Asia and Pacific

        10.3.6. East Asia

        10.3.7. Middle East and Africa

    10.4. Market Attractiveness Analysis By Region

11. North America Market Analysis 2019 to 2023 and Forecast 2024 to 2034, By Country

    11.1. Historical Market Size Value (US$ Million) & Volume (Unit Pack) Trend Analysis By Market Taxonomy, 2019 to 2023

    11.2. Market Size Value (US$ Million) & Volume (Unit Pack) Forecast By Market Taxonomy, 2024 to 2034

        11.2.1. By Country

            11.2.1.1. USA

            11.2.1.2. Canada

        11.2.2. By Product Type

        11.2.3. By Form

        11.2.4. By Source

        11.2.5. By End-User

        11.2.6. By Sales Channel

    11.3. Market Attractiveness Analysis

        11.3.1. By Country

        11.3.2. By Product Type

        11.3.3. By Form

        11.3.4. By Source

        11.3.5. By End-User

        11.3.6. By Sales Channel

    11.4. Key Takeaways

12. Latin America Market Analysis 2019 to 2023 and Forecast 2024 to 2034, By Country

    12.1. Historical Market Size Value (US$ Million) & Volume (Unit Pack) Trend Analysis By Market Taxonomy, 2019 to 2023

    12.2. Market Size Value (US$ Million) & Volume (Unit Pack) Forecast By Market Taxonomy, 2024 to 2034

        12.2.1. By Country

            12.2.1.1. Brazil

            12.2.1.2. Mexico

            12.2.1.3. Rest of Latin America

        12.2.2. By Product Type

        12.2.3. By Form

        12.2.4. By Source

        12.2.5. By End-User

        12.2.6. By Sales Channel

    12.3. Market Attractiveness Analysis

        12.3.1. By Country

        12.3.2. By Product Type

        12.3.3. By Form

        12.3.4. By Source

        12.3.5. By End-User

        12.3.6. By Sales Channel

    12.4. Key Takeaways

13. Western Europe Market Analysis 2019 to 2023 and Forecast 2024 to 2034, By Country

    13.1. Historical Market Size Value (US$ Million) & Volume (Unit Pack) Trend Analysis By Market Taxonomy, 2019 to 2023

    13.2. Market Size Value (US$ Million) & Volume (Unit Pack) Forecast By Market Taxonomy, 2024 to 2034

        13.2.1. By Country

            13.2.1.1. Germany

            13.2.1.2. UK

            13.2.1.3. France

            13.2.1.4. Spain

            13.2.1.5. Italy

            13.2.1.6. Rest of Western Europe

        13.2.2. By Product Type

        13.2.3. By Form

        13.2.4. By Source

        13.2.5. By End-User

        13.2.6. By Sales Channel

    13.3. Market Attractiveness Analysis

        13.3.1. By Country

        13.3.2. By Product Type

        13.3.3. By Form

        13.3.4. By Source

        13.3.5. By End-User

        13.3.6. By Sales Channel

    13.4. Key Takeaways

14. Eastern Europe Market Analysis 2019 to 2023 and Forecast 2024 to 2034, By Country

    14.1. Historical Market Size Value (US$ Million) & Volume (Unit Pack) Trend Analysis By Market Taxonomy, 2019 to 2023

    14.2. Market Size Value (US$ Million) & Volume (Unit Pack) Forecast By Market Taxonomy, 2024 to 2034

        14.2.1. By Country

            14.2.1.1. Poland

            14.2.1.2. Russia

            14.2.1.3. Czech Republic

            14.2.1.4. Romania

            14.2.1.5. Rest of Eastern Europe

        14.2.2. By Product Type

        14.2.3. By Form

        14.2.4. By Source

        14.2.5. By End-User

        14.2.6. By Sales Channel

    14.3. Market Attractiveness Analysis

        14.3.1. By Country

        14.3.2. By Product Type

        14.3.3. By Form

        14.3.4. By Source

        14.3.5. By End-User

        14.3.6. By Sales Channel

    14.4. Key Takeaways

15. South Asia and Pacific Market Analysis 2019 to 2023 and Forecast 2024 to 2034, By Country

    15.1. Historical Market Size Value (US$ Million) & Volume (Unit Pack) Trend Analysis By Market Taxonomy, 2019 to 2023

    15.2. Market Size Value (US$ Million) & Volume (Unit Pack) Forecast By Market Taxonomy, 2024 to 2034

        15.2.1. By Country

            15.2.1.1. India

            15.2.1.2. Bangladesh

            15.2.1.3. Australia

            15.2.1.4. New Zealand

            15.2.1.5. Rest of South Asia and Pacific

        15.2.2. By Product Type

        15.2.3. By Form

        15.2.4. By Source

        15.2.5. By End-User

        15.2.6. By Sales Channel

    15.3. Market Attractiveness Analysis

        15.3.1. By Country

        15.3.2. By Product Type

        15.3.3. By Form

        15.3.4. By Source

        15.3.5. By End-User

        15.3.6. By Sales Channel

    15.4. Key Takeaways

16. East Asia Market Analysis 2019 to 2023 and Forecast 2024 to 2034, By Country

    16.1. Historical Market Size Value (US$ Million) & Volume (Unit Pack) Trend Analysis By Market Taxonomy, 2019 to 2023

    16.2. Market Size Value (US$ Million) & Volume (Unit Pack) Forecast By Market Taxonomy, 2024 to 2034

        16.2.1. By Country

            16.2.1.1. China

            16.2.1.2. Japan

            16.2.1.3. South Korea

        16.2.2. By Product Type

        16.2.3. By Form

        16.2.4. By Source

        16.2.5. By End-User

        16.2.6. By Sales Channel

    16.3. Market Attractiveness Analysis

        16.3.1. By Country

        16.3.2. By Product Type

        16.3.3. By Form

        16.3.4. By Source

        16.3.5. By End-User

        16.3.6. By Sales Channel

    16.4. Key Takeaways

17. Middle East and Africa Market Analysis 2019 to 2023 and Forecast 2024 to 2034, By Country

    17.1. Historical Market Size Value (US$ Million) & Volume (Unit Pack) Trend Analysis By Market Taxonomy, 2019 to 2023

    17.2. Market Size Value (US$ Million) & Volume (Unit Pack) Forecast By Market Taxonomy, 2024 to 2034

        17.2.1. By Country

            17.2.1.1. GCC Countries

            17.2.1.2. South Africa

            17.2.1.3. Israel

            17.2.1.4. Rest of MEA

        17.2.2. By Product Type

        17.2.3. By Form

        17.2.4. By Source

        17.2.5. By End-User

        17.2.6. By Sales Channel

    17.3. Market Attractiveness Analysis

        17.3.1. By Country

        17.3.2. By Product Type

        17.3.3. By Form

        17.3.4. By Source

        17.3.5. By End-User

        17.3.6. By Sales Channel

    17.4. Key Takeaways

18. Key Countries Market Analysis

    18.1. USA

        18.1.1. Pricing Analysis

        18.1.2. Market Share Analysis, 2023

            18.1.2.1. By Product Type

            18.1.2.2. By Form

            18.1.2.3. By Source

            18.1.2.4. By End-User

            18.1.2.5. By Sales Channel

    18.2. Canada

        18.2.1. Pricing Analysis

        18.2.2. Market Share Analysis, 2023

            18.2.2.1. By Product Type

            18.2.2.2. By Form

            18.2.2.3. By Source

            18.2.2.4. By End-User

            18.2.2.5. By Sales Channel

    18.3. Brazil

        18.3.1. Pricing Analysis

        18.3.2. Market Share Analysis, 2023

            18.3.2.1. By Product Type

            18.3.2.2. By Form

            18.3.2.3. By Source

            18.3.2.4. By End-User

            18.3.2.5. By Sales Channel

    18.4. Mexico

        18.4.1. Pricing Analysis

        18.4.2. Market Share Analysis, 2023

            18.4.2.1. By Product Type

            18.4.2.2. By Form

            18.4.2.3. By Source

            18.4.2.4. By End-User

            18.4.2.5. By Sales Channel

    18.5. Germany

        18.5.1. Pricing Analysis

        18.5.2. Market Share Analysis, 2023

            18.5.2.1. By Product Type

            18.5.2.2. By Form

            18.5.2.3. By Source

            18.5.2.4. By End-User

            18.5.2.5. By Sales Channel

    18.6. UK

        18.6.1. Pricing Analysis

        18.6.2. Market Share Analysis, 2023

            18.6.2.1. By Product Type

            18.6.2.2. By Form

            18.6.2.3. By Source

            18.6.2.4. By End-User

            18.6.2.5. By Sales Channel

    18.7. France

        18.7.1. Pricing Analysis

        18.7.2. Market Share Analysis, 2023

            18.7.2.1. By Product Type

            18.7.2.2. By Form

            18.7.2.3. By Source

            18.7.2.4. By End-User

            18.7.2.5. By Sales Channel

    18.8. Spain

        18.8.1. Pricing Analysis

        18.8.2. Market Share Analysis, 2023

            18.8.2.1. By Product Type

            18.8.2.2. By Form

            18.8.2.3. By Source

            18.8.2.4. By End-User

            18.8.2.5. By Sales Channel

    18.9. Italy

        18.9.1. Pricing Analysis

        18.9.2. Market Share Analysis, 2023

            18.9.2.1. By Product Type

            18.9.2.2. By Form

            18.9.2.3. By Source

            18.9.2.4. By End-User

            18.9.2.5. By Sales Channel

    18.10. Poland

        18.10.1. Pricing Analysis

        18.10.2. Market Share Analysis, 2023

            18.10.2.1. By Product Type

            18.10.2.2. By Form

            18.10.2.3. By Source

            18.10.2.4. By End-User

            18.10.2.5. By Sales Channel

    18.11. Russia

        18.11.1. Pricing Analysis

        18.11.2. Market Share Analysis, 2023

            18.11.2.1. By Product Type

            18.11.2.2. By Form

            18.11.2.3. By Source

            18.11.2.4. By End-User

            18.11.2.5. By Sales Channel

    18.12. Czech Republic

        18.12.1. Pricing Analysis

        18.12.2. Market Share Analysis, 2023

            18.12.2.1. By Product Type

            18.12.2.2. By Form

            18.12.2.3. By Source

            18.12.2.4. By End-User

            18.12.2.5. By Sales Channel

    18.13. Romania

        18.13.1. Pricing Analysis

        18.13.2. Market Share Analysis, 2023

            18.13.2.1. By Product Type

            18.13.2.2. By Form

            18.13.2.3. By Source

            18.13.2.4. By End-User

            18.13.2.5. By Sales Channel

    18.14. India

        18.14.1. Pricing Analysis

        18.14.2. Market Share Analysis, 2023

            18.14.2.1. By Product Type

            18.14.2.2. By Form

            18.14.2.3. By Source

            18.14.2.4. By End-User

            18.14.2.5. By Sales Channel

    18.15. Bangladesh

        18.15.1. Pricing Analysis

        18.15.2. Market Share Analysis, 2023

            18.15.2.1. By Product Type

            18.15.2.2. By Form

            18.15.2.3. By Source

            18.15.2.4. By End-User

            18.15.2.5. By Sales Channel

    18.16. Australia

        18.16.1. Pricing Analysis

        18.16.2. Market Share Analysis, 2023

            18.16.2.1. By Product Type

            18.16.2.2. By Form

            18.16.2.3. By Source

            18.16.2.4. By End-User

            18.16.2.5. By Sales Channel

    18.17. New Zealand

        18.17.1. Pricing Analysis

        18.17.2. Market Share Analysis, 2023

            18.17.2.1. By Product Type

            18.17.2.2. By Form

            18.17.2.3. By Source

            18.17.2.4. By End-User

            18.17.2.5. By Sales Channel

    18.18. China

        18.18.1. Pricing Analysis

        18.18.2. Market Share Analysis, 2023

            18.18.2.1. By Product Type

            18.18.2.2. By Form

            18.18.2.3. By Source

            18.18.2.4. By End-User

            18.18.2.5. By Sales Channel

    18.19. Japan

        18.19.1. Pricing Analysis

        18.19.2. Market Share Analysis, 2023

            18.19.2.1. By Product Type

            18.19.2.2. By Form

            18.19.2.3. By Source

            18.19.2.4. By End-User

            18.19.2.5. By Sales Channel

    18.20. South Korea

        18.20.1. Pricing Analysis

        18.20.2. Market Share Analysis, 2023

            18.20.2.1. By Product Type

            18.20.2.2. By Form

            18.20.2.3. By Source

            18.20.2.4. By End-User

            18.20.2.5. By Sales Channel

    18.21. GCC Countries

        18.21.1. Pricing Analysis

        18.21.2. Market Share Analysis, 2023

            18.21.2.1. By Product Type

            18.21.2.2. By Form

            18.21.2.3. By Source

            18.21.2.4. By End-User

            18.21.2.5. By Sales Channel

    18.22. South Africa

        18.22.1. Pricing Analysis

        18.22.2. Market Share Analysis, 2023

            18.22.2.1. By Product Type

            18.22.2.2. By Form

            18.22.2.3. By Source

            18.22.2.4. By End-User

            18.22.2.5. By Sales Channel

    18.23. Israel

        18.23.1. Pricing Analysis

        18.23.2. Market Share Analysis, 2023

            18.23.2.1. By Product Type

            18.23.2.2. By Form

            18.23.2.3. By Source

            18.23.2.4. By End-User

            18.23.2.5. By Sales Channel

19. Market Structure Analysis

    19.1. Competition Dashboard

    19.2. Competition Benchmarking

    19.3. Market Share Analysis of Top Players

        19.3.1. By Regional

        19.3.2. By Product Type

        19.3.3. By Form

        19.3.4. By Source

        19.3.5. By End-User

        19.3.6. By Sales Channel

20. Competition Analysis

    20.1. Competition Deep Dive

        20.1.1. Ancient Nutrition

            20.1.1.1. Overview

            20.1.1.2. Product Portfolio

            20.1.1.3. Profitability by Market Segments

            20.1.1.4. Sales Footprint

            20.1.1.5. Strategy Overview

                20.1.1.5.1. Marketing Strategy

                20.1.1.5.2. Product Strategy

                20.1.1.5.3. Channel Strategy

        20.1.2. Nitta Gelatin Inc.

            20.1.2.1. Overview

            20.1.2.2. Product Portfolio

            20.1.2.3. Profitability by Market Segments

            20.1.2.4. Sales Footprint

            20.1.2.5. Strategy Overview

                20.1.2.5.1. Marketing Strategy

                20.1.2.5.2. Product Strategy

                20.1.2.5.3. Channel Strategy

        20.1.3. Darling Ingredients Inc.

            20.1.3.1. Overview

            20.1.3.2. Product Portfolio

            20.1.3.3. Profitability by Market Segments

            20.1.3.4. Sales Footprint

            20.1.3.5. Strategy Overview

                20.1.3.5.1. Marketing Strategy

                20.1.3.5.2. Product Strategy

                20.1.3.5.3. Channel Strategy

        20.1.4. Koninklijke DSM N.V.

            20.1.4.1. Overview

            20.1.4.2. Product Portfolio

            20.1.4.3. Profitability by Market Segments

            20.1.4.4. Sales Footprint

            20.1.4.5. Strategy Overview

                20.1.4.5.1. Marketing Strategy

                20.1.4.5.2. Product Strategy

                20.1.4.5.3. Channel Strategy

        20.1.5. CONNOILS LL

            20.1.5.1. Overview

            20.1.5.2. Product Portfolio

            20.1.5.3. Profitability by Market Segments

            20.1.5.4. Sales Footprint

            20.1.5.5. Strategy Overview

                20.1.5.5.1. Marketing Strategy

                20.1.5.5.2. Product Strategy

                20.1.5.5.3. Channel Strategy

        20.1.6. Collagen Matrix

            20.1.6.1. Overview

            20.1.6.2. Product Portfolio

            20.1.6.3. Profitability by Market Segments

            20.1.6.4. Sales Footprint

            20.1.6.5. Strategy Overview

                20.1.6.5.1. Marketing Strategy

                20.1.6.5.2. Product Strategy

                20.1.6.5.3. Channel Strategy

        20.1.7. Titan Biotech Ltd

            20.1.7.1. Overview

            20.1.7.2. Product Portfolio

            20.1.7.3. Profitability by Market Segments

            20.1.7.4. Sales Footprint

            20.1.7.5. Strategy Overview

                20.1.7.5.1. Marketing Strategy

                20.1.7.5.2. Product Strategy

                20.1.7.5.3. Channel Strategy

        20.1.8. Protein SA

            20.1.8.1. Overview

            20.1.8.2. Product Portfolio

            20.1.8.3. Profitability by Market Segments

            20.1.8.4. Sales Footprint

            20.1.8.5. Strategy Overview

                20.1.8.5.1. Marketing Strategy

                20.1.8.5.2. Product Strategy

                20.1.8.5.3. Channel Strategy

        20.1.9. Life Extension

            20.1.9.1. Overview

            20.1.9.2. Product Portfolio

            20.1.9.3. Profitability by Market Segments

            20.1.9.4. Sales Footprint

            20.1.9.5. Strategy Overview

                20.1.9.5.1. Marketing Strategy

                20.1.9.5.2. Product Strategy

                20.1.9.5.3. Channel Strategy

        20.1.10. GELITA AG

            20.1.10.1. Overview

            20.1.10.2. Product Portfolio

            20.1.10.3. Profitability by Market Segments

            20.1.10.4. Sales Footprint

            20.1.10.5. Strategy Overview

                20.1.10.5.1. Marketing Strategy

                20.1.10.5.2. Product Strategy

                20.1.10.5.3. Channel Strategy

        20.1.11. Weishardt

            20.1.11.1. Overview

            20.1.11.2. Product Portfolio

            20.1.11.3. Profitability by Market Segments

            20.1.11.4. Sales Footprint

            20.1.11.5. Strategy Overview

                20.1.11.5.1. Marketing Strategy

                20.1.11.5.2. Product Strategy

                20.1.11.5.3. Channel Strategy

        20.1.12. Tessenderlo Group NV

            20.1.12.1. Overview

            20.1.12.2. Product Portfolio

            20.1.12.3. Profitability by Market Segments

            20.1.12.4. Sales Footprint

            20.1.12.5. Strategy Overview

                20.1.12.5.1. Marketing Strategy

                20.1.12.5.2. Product Strategy

                20.1.12.5.3. Channel Strategy

        20.1.13. LAPI GELATINE S.p.a.

            20.1.13.1. Overview

            20.1.13.2. Product Portfolio

            20.1.13.3. Profitability by Market Segments

            20.1.13.4. Sales Footprint

            20.1.13.5. Strategy Overview

                20.1.13.5.1. Marketing Strategy

                20.1.13.5.2. Product Strategy

                20.1.13.5.3. Channel Strategy

        20.1.14. ITALGELATINE S.p.A.

            20.1.14.1. Overview

            20.1.14.2. Product Portfolio

            20.1.14.3. Profitability by Market Segments

            20.1.14.4. Sales Footprint

            20.1.14.5. Strategy Overview

                20.1.14.5.1. Marketing Strategy

                20.1.14.5.2. Product Strategy

                20.1.14.5.3. Channel Strategy

21. Assumptions & Acronyms Used

22. Research Methodology

List of Tables

Table 1: Global Market Value (US$ Million) Forecast by Region, 2019 to 2034

Table 2: Global Market Volume (Unit Pack) Forecast by Region, 2019 to 2034

Table 3: Global Market Value (US$ Million) Forecast by Product Type, 2019 to 2034

Table 4: Global Market Volume (Unit Pack) Forecast by Product Type, 2019 to 2034

Table 5: Global Market Value (US$ Million) Forecast by Form, 2019 to 2034

Table 6: Global Market Volume (Unit Pack) Forecast by Form, 2019 to 2034

Table 7: Global Market Value (US$ Million) Forecast by Source, 2019 to 2034

Table 8: Global Market Volume (Unit Pack) Forecast by Source, 2019 to 2034

Table 9: Global Market Value (US$ Million) Forecast by End-User, 2019 to 2034

Table 10: Global Market Volume (Unit Pack) Forecast by End-User, 2019 to 2034

Table 11: Global Market Value (US$ Million) Forecast by Sales Channel, 2019 to 2034

Table 12: Global Market Volume (Unit Pack) Forecast by Sales Channel, 2019 to 2034

Table 13: North America Market Value (US$ Million) Forecast by Country, 2019 to 2034

Table 14: North America Market Volume (Unit Pack) Forecast by Country, 2019 to 2034

Table 15: North America Market Value (US$ Million) Forecast by Product Type, 2019 to 2034

Table 16: North America Market Volume (Unit Pack) Forecast by Product Type, 2019 to 2034

Table 17: North America Market Value (US$ Million) Forecast by Form, 2019 to 2034

Table 18: North America Market Volume (Unit Pack) Forecast by Form, 2019 to 2034

Table 19: North America Market Value (US$ Million) Forecast by Source, 2019 to 2034

Table 20: North America Market Volume (Unit Pack) Forecast by Source, 2019 to 2034

Table 21: North America Market Value (US$ Million) Forecast by End-User, 2019 to 2034

Table 22: North America Market Volume (Unit Pack) Forecast by End-User, 2019 to 2034

Table 23: North America Market Value (US$ Million) Forecast by Sales Channel, 2019 to 2034

Table 24: North America Market Volume (Unit Pack) Forecast by Sales Channel, 2019 to 2034

Table 25: Latin America Market Value (US$ Million) Forecast by Country, 2019 to 2034

Table 26: Latin America Market Volume (Unit Pack) Forecast by Country, 2019 to 2034

Table 27: Latin America Market Value (US$ Million) Forecast by Product Type, 2019 to 2034

Table 28: Latin America Market Volume (Unit Pack) Forecast by Product Type, 2019 to 2034

Table 29: Latin America Market Value (US$ Million) Forecast by Form, 2019 to 2034

Table 30: Latin America Market Volume (Unit Pack) Forecast by Form, 2019 to 2034

Table 31: Latin America Market Value (US$ Million) Forecast by Source, 2019 to 2034

Table 32: Latin America Market Volume (Unit Pack) Forecast by Source, 2019 to 2034

Table 33: Latin America Market Value (US$ Million) Forecast by End-User, 2019 to 2034

Table 34: Latin America Market Volume (Unit Pack) Forecast by End-User, 2019 to 2034

Table 35: Latin America Market Value (US$ Million) Forecast by Sales Channel, 2019 to 2034

Table 36: Latin America Market Volume (Unit Pack) Forecast by Sales Channel, 2019 to 2034

Table 37: Western Europe Market Value (US$ Million) Forecast by Country, 2019 to 2034

Table 38: Western Europe Market Volume (Unit Pack) Forecast by Country, 2019 to 2034

Table 39: Western Europe Market Value (US$ Million) Forecast by Product Type, 2019 to 2034

Table 40: Western Europe Market Volume (Unit Pack) Forecast by Product Type, 2019 to 2034

Table 41: Western Europe Market Value (US$ Million) Forecast by Form, 2019 to 2034

Table 42: Western Europe Market Volume (Unit Pack) Forecast by Form, 2019 to 2034

Table 43: Western Europe Market Value (US$ Million) Forecast by Source, 2019 to 2034

Table 44: Western Europe Market Volume (Unit Pack) Forecast by Source, 2019 to 2034

Table 45: Western Europe Market Value (US$ Million) Forecast by End-User, 2019 to 2034

Table 46: Western Europe Market Volume (Unit Pack) Forecast by End-User, 2019 to 2034

Table 47: Western Europe Market Value (US$ Million) Forecast by Sales Channel, 2019 to 2034

Table 48: Western Europe Market Volume (Unit Pack) Forecast by Sales Channel, 2019 to 2034

Table 49: Eastern Europe Market Value (US$ Million) Forecast by Country, 2019 to 2034

Table 50: Eastern Europe Market Volume (Unit Pack) Forecast by Country, 2019 to 2034

Table 51: Eastern Europe Market Value (US$ Million) Forecast by Product Type, 2019 to 2034

Table 52: Eastern Europe Market Volume (Unit Pack) Forecast by Product Type, 2019 to 2034

Table 53: Eastern Europe Market Value (US$ Million) Forecast by Form, 2019 to 2034

Table 54: Eastern Europe Market Volume (Unit Pack) Forecast by Form, 2019 to 2034

Table 55: Eastern Europe Market Value (US$ Million) Forecast by Source, 2019 to 2034

Table 56: Eastern Europe Market Volume (Unit Pack) Forecast by Source, 2019 to 2034

Table 57: Eastern Europe Market Value (US$ Million) Forecast by End-User, 2019 to 2034

Table 58: Eastern Europe Market Volume (Unit Pack) Forecast by End-User, 2019 to 2034

Table 59: Eastern Europe Market Value (US$ Million) Forecast by Sales Channel, 2019 to 2034

Table 60: Eastern Europe Market Volume (Unit Pack) Forecast by Sales Channel, 2019 to 2034

Table 61: South Asia and Pacific Market Value (US$ Million) Forecast by Country, 2019 to 2034

Table 62: South Asia and Pacific Market Volume (Unit Pack) Forecast by Country, 2019 to 2034

Table 63: South Asia and Pacific Market Value (US$ Million) Forecast by Product Type, 2019 to 2034

Table 64: South Asia and Pacific Market Volume (Unit Pack) Forecast by Product Type, 2019 to 2034

Table 65: South Asia and Pacific Market Value (US$ Million) Forecast by Form, 2019 to 2034

Table 66: South Asia and Pacific Market Volume (Unit Pack) Forecast by Form, 2019 to 2034

Table 67: South Asia and Pacific Market Value (US$ Million) Forecast by Source, 2019 to 2034

Table 68: South Asia and Pacific Market Volume (Unit Pack) Forecast by Source, 2019 to 2034

Table 69: South Asia and Pacific Market Value (US$ Million) Forecast by End-User, 2019 to 2034

Table 70: South Asia and Pacific Market Volume (Unit Pack) Forecast by End-User, 2019 to 2034

Table 71: South Asia and Pacific Market Value (US$ Million) Forecast by Sales Channel, 2019 to 2034

Table 72: South Asia and Pacific Market Volume (Unit Pack) Forecast by Sales Channel, 2019 to 2034

Table 73: East Asia Market Value (US$ Million) Forecast by Country, 2019 to 2034

Table 74: East Asia Market Volume (Unit Pack) Forecast by Country, 2019 to 2034

Table 75: East Asia Market Value (US$ Million) Forecast by Product Type, 2019 to 2034

Table 76: East Asia Market Volume (Unit Pack) Forecast by Product Type, 2019 to 2034

Table 77: East Asia Market Value (US$ Million) Forecast by Form, 2019 to 2034

Table 78: East Asia Market Volume (Unit Pack) Forecast by Form, 2019 to 2034

Table 79: East Asia Market Value (US$ Million) Forecast by Source, 2019 to 2034

Table 80: East Asia Market Volume (Unit Pack) Forecast by Source, 2019 to 2034

Table 81: East Asia Market Value (US$ Million) Forecast by End-User, 2019 to 2034

Table 82: East Asia Market Volume (Unit Pack) Forecast by End-User, 2019 to 2034

Table 83: East Asia Market Value (US$ Million) Forecast by Sales Channel, 2019 to 2034

Table 84: East Asia Market Volume (Unit Pack) Forecast by Sales Channel, 2019 to 2034

Table 85: Middle East and Africa Market Value (US$ Million) Forecast by Country, 2019 to 2034

Table 86: Middle East and Africa Market Volume (Unit Pack) Forecast by Country, 2019 to 2034

Table 87: Middle East and Africa Market Value (US$ Million) Forecast by Product Type, 2019 to 2034

Table 88: Middle East and Africa Market Volume (Unit Pack) Forecast by Product Type, 2019 to 2034

Table 89: Middle East and Africa Market Value (US$ Million) Forecast by Form, 2019 to 2034

Table 90: Middle East and Africa Market Volume (Unit Pack) Forecast by Form, 2019 to 2034

Table 91: Middle East and Africa Market Value (US$ Million) Forecast by Source, 2019 to 2034

Table 92: Middle East and Africa Market Volume (Unit Pack) Forecast by Source, 2019 to 2034

Table 93: Middle East and Africa Market Value (US$ Million) Forecast by End-User, 2019 to 2034

Table 94: Middle East and Africa Market Volume (Unit Pack) Forecast by End-User, 2019 to 2034

Table 95: Middle East and Africa Market Value (US$ Million) Forecast by Sales Channel, 2019 to 2034

Table 96: Middle East and Africa Market Volume (Unit Pack) Forecast by Sales Channel, 2019 to 2034

List of Charts

Figure 1: Global Market Value (US$ Million) by Product Type, 2024 to 2034

Figure 2: Global Market Value (US$ Million) by Form, 2024 to 2034

Figure 3: Global Market Value (US$ Million) by Source, 2024 to 2034

Figure 4: Global Market Value (US$ Million) by End-User, 2024 to 2034

Figure 5: Global Market Value (US$ Million) by Sales Channel, 2024 to 2034

Figure 6: Global Market Value (US$ Million) by Region, 2024 to 2034

Figure 7: Global Market Value (US$ Million) Analysis by Region, 2019 to 2034

Figure 8: Global Market Volume (Unit Pack) Analysis by Region, 2019 to 2034

Figure 9: Global Market Value Share (%) and BPS Analysis by Region, 2024 to 2034

Figure 10: Global Market Y-o-Y Growth (%) Projections by Region, 2024 to 2034

Figure 11: Global Market Value (US$ Million) Analysis by Product Type, 2019 to 2034

Figure 12: Global Market Volume (Unit Pack) Analysis by Product Type, 2019 to 2034

Figure 13: Global Market Value Share (%) and BPS Analysis by Product Type, 2024 to 2034

Figure 14: Global Market Y-o-Y Growth (%) Projections by Product Type, 2024 to 2034

Figure 15: Global Market Value (US$ Million) Analysis by Form, 2019 to 2034

Figure 16: Global Market Volume (Unit Pack) Analysis by Form, 2019 to 2034

Figure 17: Global Market Value Share (%) and BPS Analysis by Form, 2024 to 2034

Figure 18: Global Market Y-o-Y Growth (%) Projections by Form, 2024 to 2034

Figure 19: Global Market Value (US$ Million) Analysis by Source, 2019 to 2034

Figure 20: Global Market Volume (Unit Pack) Analysis by Source, 2019 to 2034

Figure 21: Global Market Value Share (%) and BPS Analysis by Source, 2024 to 2034

Figure 22: Global Market Y-o-Y Growth (%) Projections by Source, 2024 to 2034

Figure 23: Global Market Value (US$ Million) Analysis by End-User, 2019 to 2034

Figure 24: Global Market Volume (Unit Pack) Analysis by End-User, 2019 to 2034

Figure 25: Global Market Value Share (%) and BPS Analysis by End-User, 2024 to 2034

Figure 26: Global Market Y-o-Y Growth (%) Projections by End-User, 2024 to 2034

Figure 27: Global Market Value (US$ Million) Analysis by Sales Channel, 2019 to 2034

Figure 28: Global Market Volume (Unit Pack) Analysis by Sales Channel, 2019 to 2034

Figure 29: Global Market Value Share (%) and BPS Analysis by Sales Channel, 2024 to 2034

Figure 30: Global Market Y-o-Y Growth (%) Projections by Sales Channel, 2024 to 2034

Figure 31: Global Market Attractiveness by Product Type, 2024 to 2034

Figure 32: Global Market Attractiveness by Form, 2024 to 2034

Figure 33: Global Market Attractiveness by Source, 2024 to 2034

Figure 34: Global Market Attractiveness by End-User, 2024 to 2034

Figure 35: Global Market Attractiveness by Sales Channel, 2024 to 2034

Figure 36: Global Market Attractiveness by Region, 2024 to 2034

Figure 37: North America Market Value (US$ Million) by Product Type, 2024 to 2034

Figure 38: North America Market Value (US$ Million) by Form, 2024 to 2034

Figure 39: North America Market Value (US$ Million) by Source, 2024 to 2034

Figure 40: North America Market Value (US$ Million) by End-User, 2024 to 2034

Figure 41: North America Market Value (US$ Million) by Sales Channel, 2024 to 2034

Figure 42: North America Market Value (US$ Million) by Country, 2024 to 2034

Figure 43: North America Market Value (US$ Million) Analysis by Country, 2019 to 2034

Figure 44: North America Market Volume (Unit Pack) Analysis by Country, 2019 to 2034

Figure 45: North America Market Value Share (%) and BPS Analysis by Country, 2024 to 2034

Figure 46: North America Market Y-o-Y Growth (%) Projections by Country, 2024 to 2034

Figure 47: North America Market Value (US$ Million) Analysis by Product Type, 2019 to 2034

Figure 48: North America Market Volume (Unit Pack) Analysis by Product Type, 2019 to 2034

Figure 49: North America Market Value Share (%) and BPS Analysis by Product Type, 2024 to 2034

Figure 50: North America Market Y-o-Y Growth (%) Projections by Product Type, 2024 to 2034

Figure 51: North America Market Value (US$ Million) Analysis by Form, 2019 to 2034

Figure 52: North America Market Volume (Unit Pack) Analysis by Form, 2019 to 2034

Figure 53: North America Market Value Share (%) and BPS Analysis by Form, 2024 to 2034

Figure 54: North America Market Y-o-Y Growth (%) Projections by Form, 2024 to 2034

Figure 55: North America Market Value (US$ Million) Analysis by Source, 2019 to 2034

Figure 56: North America Market Volume (Unit Pack) Analysis by Source, 2019 to 2034

Figure 57: North America Market Value Share (%) and BPS Analysis by Source, 2024 to 2034

Figure 58: North America Market Y-o-Y Growth (%) Projections by Source, 2024 to 2034

Figure 59: North America Market Value (US$ Million) Analysis by End-User, 2019 to 2034

Figure 60: North America Market Volume (Unit Pack) Analysis by End-User, 2019 to 2034

Figure 61: North America Market Value Share (%) and BPS Analysis by End-User, 2024 to 2034

Figure 62: North America Market Y-o-Y Growth (%) Projections by End-User, 2024 to 2034

Figure 63: North America Market Value (US$ Million) Analysis by Sales Channel, 2019 to 2034

Figure 64: North America Market Volume (Unit Pack) Analysis by Sales Channel, 2019 to 2034

Figure 65: North America Market Value Share (%) and BPS Analysis by Sales Channel, 2024 to 2034

Figure 66: North America Market Y-o-Y Growth (%) Projections by Sales Channel, 2024 to 2034

Figure 67: North America Market Attractiveness by Product Type, 2024 to 2034

Figure 68: North America Market Attractiveness by Form, 2024 to 2034

Figure 69: North America Market Attractiveness by Source, 2024 to 2034

Figure 70: North America Market Attractiveness by End-User, 2024 to 2034

Figure 71: North America Market Attractiveness by Sales Channel, 2024 to 2034

Figure 72: North America Market Attractiveness by Country, 2024 to 2034

Figure 73: Latin America Market Value (US$ Million) by Product Type, 2024 to 2034

Figure 74: Latin America Market Value (US$ Million) by Form, 2024 to 2034

Figure 75: Latin America Market Value (US$ Million) by Source, 2024 to 2034

Figure 76: Latin America Market Value (US$ Million) by End-User, 2024 to 2034

Figure 77: Latin America Market Value (US$ Million) by Sales Channel, 2024 to 2034

Figure 78: Latin America Market Value (US$ Million) by Country, 2024 to 2034

Figure 79: Latin America Market Value (US$ Million) Analysis by Country, 2019 to 2034

Figure 80: Latin America Market Volume (Unit Pack) Analysis by Country, 2019 to 2034

Figure 81: Latin America Market Value Share (%) and BPS Analysis by Country, 2024 to 2034

Figure 82: Latin America Market Y-o-Y Growth (%) Projections by Country, 2024 to 2034

Figure 83: Latin America Market Value (US$ Million) Analysis by Product Type, 2019 to 2034

Figure 84: Latin America Market Volume (Unit Pack) Analysis by Product Type, 2019 to 2034

Figure 85: Latin America Market Value Share (%) and BPS Analysis by Product Type, 2024 to 2034

Figure 86: Latin America Market Y-o-Y Growth (%) Projections by Product Type, 2024 to 2034

Figure 87: Latin America Market Value (US$ Million) Analysis by Form, 2019 to 2034

Figure 88: Latin America Market Volume (Unit Pack) Analysis by Form, 2019 to 2034

Figure 89: Latin America Market Value Share (%) and BPS Analysis by Form, 2024 to 2034

Figure 90: Latin America Market Y-o-Y Growth (%) Projections by Form, 2024 to 2034

Figure 91: Latin America Market Value (US$ Million) Analysis by Source, 2019 to 2034

Figure 92: Latin America Market Volume (Unit Pack) Analysis by Source, 2019 to 2034

Figure 93: Latin America Market Value Share (%) and BPS Analysis by Source, 2024 to 2034

Figure 94: Latin America Market Y-o-Y Growth (%) Projections by Source, 2024 to 2034

Figure 95: Latin America Market Value (US$ Million) Analysis by End-User, 2019 to 2034

Figure 96: Latin America Market Volume (Unit Pack) Analysis by End-User, 2019 to 2034

Figure 97: Latin America Market Value Share (%) and BPS Analysis by End-User, 2024 to 2034

Figure 98: Latin America Market Y-o-Y Growth (%) Projections by End-User, 2024 to 2034

Figure 99: Latin America Market Value (US$ Million) Analysis by Sales Channel, 2019 to 2034

Figure 100: Latin America Market Volume (Unit Pack) Analysis by Sales Channel, 2019 to 2034

Figure 101: Latin America Market Value Share (%) and BPS Analysis by Sales Channel, 2024 to 2034

Figure 102: Latin America Market Y-o-Y Growth (%) Projections by Sales Channel, 2024 to 2034

Figure 103: Latin America Market Attractiveness by Product Type, 2024 to 2034

Figure 104: Latin America Market Attractiveness by Form, 2024 to 2034

Figure 105: Latin America Market Attractiveness by Source, 2024 to 2034

Figure 106: Latin America Market Attractiveness by End-User, 2024 to 2034

Figure 107: Latin America Market Attractiveness by Sales Channel, 2024 to 2034

Figure 108: Latin America Market Attractiveness by Country, 2024 to 2034

Figure 109: Western Europe Market Value (US$ Million) by Product Type, 2024 to 2034

Figure 110: Western Europe Market Value (US$ Million) by Form, 2024 to 2034

Figure 111: Western Europe Market Value (US$ Million) by Source, 2024 to 2034

Figure 112: Western Europe Market Value (US$ Million) by End-User, 2024 to 2034

Figure 113: Western Europe Market Value (US$ Million) by Sales Channel, 2024 to 2034

Figure 114: Western Europe Market Value (US$ Million) by Country, 2024 to 2034

Figure 115: Western Europe Market Value (US$ Million) Analysis by Country, 2019 to 2034

Figure 116: Western Europe Market Volume (Unit Pack) Analysis by Country, 2019 to 2034

Figure 117: Western Europe Market Value Share (%) and BPS Analysis by Country, 2024 to 2034

Figure 118: Western Europe Market Y-o-Y Growth (%) Projections by Country, 2024 to 2034

Figure 119: Western Europe Market Value (US$ Million) Analysis by Product Type, 2019 to 2034

Figure 120: Western Europe Market Volume (Unit Pack) Analysis by Product Type, 2019 to 2034

Figure 121: Western Europe Market Value Share (%) and BPS Analysis by Product Type, 2024 to 2034

Figure 122: Western Europe Market Y-o-Y Growth (%) Projections by Product Type, 2024 to 2034

Figure 123: Western Europe Market Value (US$ Million) Analysis by Form, 2019 to 2034

Figure 124: Western Europe Market Volume (Unit Pack) Analysis by Form, 2019 to 2034

Figure 125: Western Europe Market Value Share (%) and BPS Analysis by Form, 2024 to 2034

Figure 126: Western Europe Market Y-o-Y Growth (%) Projections by Form, 2024 to 2034

Figure 127: Western Europe Market Value (US$ Million) Analysis by Source, 2019 to 2034

Figure 128: Western Europe Market Volume (Unit Pack) Analysis by Source, 2019 to 2034

Figure 129: Western Europe Market Value Share (%) and BPS Analysis by Source, 2024 to 2034

Figure 130: Western Europe Market Y-o-Y Growth (%) Projections by Source, 2024 to 2034

Figure 131: Western Europe Market Value (US$ Million) Analysis by End-User, 2019 to 2034

Figure 132: Western Europe Market Volume (Unit Pack) Analysis by End-User, 2019 to 2034

Figure 133: Western Europe Market Value Share (%) and BPS Analysis by End-User, 2024 to 2034

Figure 134: Western Europe Market Y-o-Y Growth (%) Projections by End-User, 2024 to 2034

Figure 135: Western Europe Market Value (US$ Million) Analysis by Sales Channel, 2019 to 2034

Figure 136: Western Europe Market Volume (Unit Pack) Analysis by Sales Channel, 2019 to 2034

Figure 137: Western Europe Market Value Share (%) and BPS Analysis by Sales Channel, 2024 to 2034

Figure 138: Western Europe Market Y-o-Y Growth (%) Projections by Sales Channel, 2024 to 2034

Figure 139: Western Europe Market Attractiveness by Product Type, 2024 to 2034

Figure 140: Western Europe Market Attractiveness by Form, 2024 to 2034

Figure 141: Western Europe Market Attractiveness by Source, 2024 to 2034

Figure 142: Western Europe Market Attractiveness by End-User, 2024 to 2034

Figure 143: Western Europe Market Attractiveness by Sales Channel, 2024 to 2034

Figure 144: Western Europe Market Attractiveness by Country, 2024 to 2034

Figure 145: Eastern Europe Market Value (US$ Million) by Product Type, 2024 to 2034

Figure 146: Eastern Europe Market Value (US$ Million) by Form, 2024 to 2034

Figure 147: Eastern Europe Market Value (US$ Million) by Source, 2024 to 2034

Figure 148: Eastern Europe Market Value (US$ Million) by End-User, 2024 to 2034

Figure 149: Eastern Europe Market Value (US$ Million) by Sales Channel, 2024 to 2034

Figure 150: Eastern Europe Market Value (US$ Million) by Country, 2024 to 2034

Figure 151: Eastern Europe Market Value (US$ Million) Analysis by Country, 2019 to 2034

Figure 152: Eastern Europe Market Volume (Unit Pack) Analysis by Country, 2019 to 2034

Figure 153: Eastern Europe Market Value Share (%) and BPS Analysis by Country, 2024 to 2034

Figure 154: Eastern Europe Market Y-o-Y Growth (%) Projections by Country, 2024 to 2034

Figure 155: Eastern Europe Market Value (US$ Million) Analysis by Product Type, 2019 to 2034

Figure 156: Eastern Europe Market Volume (Unit Pack) Analysis by Product Type, 2019 to 2034

Figure 157: Eastern Europe Market Value Share (%) and BPS Analysis by Product Type, 2024 to 2034

Figure 158: Eastern Europe Market Y-o-Y Growth (%) Projections by Product Type, 2024 to 2034

Figure 159: Eastern Europe Market Value (US$ Million) Analysis by Form, 2019 to 2034

Figure 160: Eastern Europe Market Volume (Unit Pack) Analysis by Form, 2019 to 2034

Figure 161: Eastern Europe Market Value Share (%) and BPS Analysis by Form, 2024 to 2034

Figure 162: Eastern Europe Market Y-o-Y Growth (%) Projections by Form, 2024 to 2034

Figure 163: Eastern Europe Market Value (US$ Million) Analysis by Source, 2019 to 2034

Figure 164: Eastern Europe Market Volume (Unit Pack) Analysis by Source, 2019 to 2034

Figure 165: Eastern Europe Market Value Share (%) and BPS Analysis by Source, 2024 to 2034

Figure 166: Eastern Europe Market Y-o-Y Growth (%) Projections by Source, 2024 to 2034

Figure 167: Eastern Europe Market Value (US$ Million) Analysis by End-User, 2019 to 2034

Figure 168: Eastern Europe Market Volume (Unit Pack) Analysis by End-User, 2019 to 2034

Figure 169: Eastern Europe Market Value Share (%) and BPS Analysis by End-User, 2024 to 2034

Figure 170: Eastern Europe Market Y-o-Y Growth (%) Projections by End-User, 2024 to 2034

Figure 171: Eastern Europe Market Value (US$ Million) Analysis by Sales Channel, 2019 to 2034

Figure 172: Eastern Europe Market Volume (Unit Pack) Analysis by Sales Channel, 2019 to 2034

Figure 173: Eastern Europe Market Value Share (%) and BPS Analysis by Sales Channel, 2024 to 2034

Figure 174: Eastern Europe Market Y-o-Y Growth (%) Projections by Sales Channel, 2024 to 2034

Figure 175: Eastern Europe Market Attractiveness by Product Type, 2024 to 2034

Figure 176: Eastern Europe Market Attractiveness by Form, 2024 to 2034

Figure 177: Eastern Europe Market Attractiveness by Source, 2024 to 2034

Figure 178: Eastern Europe Market Attractiveness by End-User, 2024 to 2034

Figure 179: Eastern Europe Market Attractiveness by Sales Channel, 2024 to 2034

Figure 180: Eastern Europe Market Attractiveness by Country, 2024 to 2034

Figure 181: South Asia and Pacific Market Value (US$ Million) by Product Type, 2024 to 2034

Figure 182: South Asia and Pacific Market Value (US$ Million) by Form, 2024 to 2034

Figure 183: South Asia and Pacific Market Value (US$ Million) by Source, 2024 to 2034

Figure 184: South Asia and Pacific Market Value (US$ Million) by End-User, 2024 to 2034

Figure 185: South Asia and Pacific Market Value (US$ Million) by Sales Channel, 2024 to 2034

Figure 186: South Asia and Pacific Market Value (US$ Million) by Country, 2024 to 2034

Figure 187: South Asia and Pacific Market Value (US$ Million) Analysis by Country, 2019 to 2034

Figure 188: South Asia and Pacific Market Volume (Unit Pack) Analysis by Country, 2019 to 2034

Figure 189: South Asia and Pacific Market Value Share (%) and BPS Analysis by Country, 2024 to 2034

Figure 190: South Asia and Pacific Market Y-o-Y Growth (%) Projections by Country, 2024 to 2034

Figure 191: South Asia and Pacific Market Value (US$ Million) Analysis by Product Type, 2019 to 2034

Figure 192: South Asia and Pacific Market Volume (Unit Pack) Analysis by Product Type, 2019 to 2034

Figure 193: South Asia and Pacific Market Value Share (%) and BPS Analysis by Product Type, 2024 to 2034

Figure 194: South Asia and Pacific Market Y-o-Y Growth (%) Projections by Product Type, 2024 to 2034

Figure 195: South Asia and Pacific Market Value (US$ Million) Analysis by Form, 2019 to 2034

Figure 196: South Asia and Pacific Market Volume (Unit Pack) Analysis by Form, 2019 to 2034

Figure 197: South Asia and Pacific Market Value Share (%) and BPS Analysis by Form, 2024 to 2034

Figure 198: South Asia and Pacific Market Y-o-Y Growth (%) Projections by Form, 2024 to 2034

Figure 199: South Asia and Pacific Market Value (US$ Million) Analysis by Source, 2019 to 2034

Figure 200: South Asia and Pacific Market Volume (Unit Pack) Analysis by Source, 2019 to 2034

Figure 201: South Asia and Pacific Market Value Share (%) and BPS Analysis by Source, 2024 to 2034

Figure 202: South Asia and Pacific Market Y-o-Y Growth (%) Projections by Source, 2024 to 2034

Figure 203: South Asia and Pacific Market Value (US$ Million) Analysis by End-User, 2019 to 2034

Figure 204: South Asia and Pacific Market Volume (Unit Pack) Analysis by End-User, 2019 to 2034

Figure 205: South Asia and Pacific Market Value Share (%) and BPS Analysis by End-User, 2024 to 2034

Figure 206: South Asia and Pacific Market Y-o-Y Growth (%) Projections by End-User, 2024 to 2034

Figure 207: South Asia and Pacific Market Value (US$ Million) Analysis by Sales Channel, 2019 to 2034

Figure 208: South Asia and Pacific Market Volume (Unit Pack) Analysis by Sales Channel, 2019 to 2034

Figure 209: South Asia and Pacific Market Value Share (%) and BPS Analysis by Sales Channel, 2024 to 2034

Figure 210: South Asia and Pacific Market Y-o-Y Growth (%) Projections by Sales Channel, 2024 to 2034

Figure 211: South Asia and Pacific Market Attractiveness by Product Type, 2024 to 2034

Figure 212: South Asia and Pacific Market Attractiveness by Form, 2024 to 2034

Figure 213: South Asia and Pacific Market Attractiveness by Source, 2024 to 2034

Figure 214: South Asia and Pacific Market Attractiveness by End-User, 2024 to 2034

Figure 215: South Asia and Pacific Market Attractiveness by Sales Channel, 2024 to 2034

Figure 216: South Asia and Pacific Market Attractiveness by Country, 2024 to 2034

Figure 217: East Asia Market Value (US$ Million) by Product Type, 2024 to 2034

Figure 218: East Asia Market Value (US$ Million) by Form, 2024 to 2034

Figure 219: East Asia Market Value (US$ Million) by Source, 2024 to 2034

Figure 220: East Asia Market Value (US$ Million) by End-User, 2024 to 2034

Figure 221: East Asia Market Value (US$ Million) by Sales Channel, 2024 to 2034

Figure 222: East Asia Market Value (US$ Million) by Country, 2024 to 2034

Figure 223: East Asia Market Value (US$ Million) Analysis by Country, 2019 to 2034

Figure 224: East Asia Market Volume (Unit Pack) Analysis by Country, 2019 to 2034

Figure 225: East Asia Market Value Share (%) and BPS Analysis by Country, 2024 to 2034

Figure 226: East Asia Market Y-o-Y Growth (%) Projections by Country, 2024 to 2034

Figure 227: East Asia Market Value (US$ Million) Analysis by Product Type, 2019 to 2034

Figure 228: East Asia Market Volume (Unit Pack) Analysis by Product Type, 2019 to 2034

Figure 229: East Asia Market Value Share (%) and BPS Analysis by Product Type, 2024 to 2034

Figure 230: East Asia Market Y-o-Y Growth (%) Projections by Product Type, 2024 to 2034

Figure 231: East Asia Market Value (US$ Million) Analysis by Form, 2019 to 2034

Figure 232: East Asia Market Volume (Unit Pack) Analysis by Form, 2019 to 2034

Figure 233: East Asia Market Value Share (%) and BPS Analysis by Form, 2024 to 2034

Figure 234: East Asia Market Y-o-Y Growth (%) Projections by Form, 2024 to 2034

Figure 235: East Asia Market Value (US$ Million) Analysis by Source, 2019 to 2034

Figure 236: East Asia Market Volume (Unit Pack) Analysis by Source, 2019 to 2034

Figure 237: East Asia Market Value Share (%) and BPS Analysis by Source, 2024 to 2034

Figure 238: East Asia Market Y-o-Y Growth (%) Projections by Source, 2024 to 2034

Figure 239: East Asia Market Value (US$ Million) Analysis by End-User, 2019 to 2034

Figure 240: East Asia Market Volume (Unit Pack) Analysis by End-User, 2019 to 2034

Figure 241: East Asia Market Value Share (%) and BPS Analysis by End-User, 2024 to 2034

Figure 242: East Asia Market Y-o-Y Growth (%) Projections by End-User, 2024 to 2034

Figure 243: East Asia Market Value (US$ Million) Analysis by Sales Channel, 2019 to 2034

Figure 244: East Asia Market Volume (Unit Pack) Analysis by Sales Channel, 2019 to 2034

Figure 245: East Asia Market Value Share (%) and BPS Analysis by Sales Channel, 2024 to 2034

Figure 246: East Asia Market Y-o-Y Growth (%) Projections by Sales Channel, 2024 to 2034

Figure 247: East Asia Market Attractiveness by Product Type, 2024 to 2034

Figure 248: East Asia Market Attractiveness by Form, 2024 to 2034

Figure 249: East Asia Market Attractiveness by Source, 2024 to 2034

Figure 250: East Asia Market Attractiveness by End-User, 2024 to 2034

Figure 251: East Asia Market Attractiveness by Sales Channel, 2024 to 2034

Figure 252: East Asia Market Attractiveness by Country, 2024 to 2034

Figure 253: Middle East and Africa Market Value (US$ Million) by Product Type, 2024 to 2034

Figure 254: Middle East and Africa Market Value (US$ Million) by Form, 2024 to 2034

Figure 255: Middle East and Africa Market Value (US$ Million) by Source, 2024 to 2034

Figure 256: Middle East and Africa Market Value (US$ Million) by End-User, 2024 to 2034

Figure 257: Middle East and Africa Market Value (US$ Million) by Sales Channel, 2024 to 2034

Figure 258: Middle East and Africa Market Value (US$ Million) by Country, 2024 to 2034

Figure 259: Middle East and Africa Market Value (US$ Million) Analysis by Country, 2019 to 2034

Figure 260: Middle East and Africa Market Volume (Unit Pack) Analysis by Country, 2019 to 2034

Figure 261: Middle East and Africa Market Value Share (%) and BPS Analysis by Country, 2024 to 2034

Figure 262: Middle East and Africa Market Y-o-Y Growth (%) Projections by Country, 2024 to 2034

Figure 263: Middle East and Africa Market Value (US$ Million) Analysis by Product Type, 2019 to 2034

Figure 264: Middle East and Africa Market Volume (Unit Pack) Analysis by Product Type, 2019 to 2034

Figure 265: Middle East and Africa Market Value Share (%) and BPS Analysis by Product Type, 2024 to 2034

Figure 266: Middle East and Africa Market Y-o-Y Growth (%) Projections by Product Type, 2024 to 2034

Figure 267: Middle East and Africa Market Value (US$ Million) Analysis by Form, 2019 to 2034

Figure 268: Middle East and Africa Market Volume (Unit Pack) Analysis by Form, 2019 to 2034

Figure 269: Middle East and Africa Market Value Share (%) and BPS Analysis by Form, 2024 to 2034

Figure 270: Middle East and Africa Market Y-o-Y Growth (%) Projections by Form, 2024 to 2034

Figure 271: Middle East and Africa Market Value (US$ Million) Analysis by Source, 2019 to 2034

Figure 272: Middle East and Africa Market Volume (Unit Pack) Analysis by Source, 2019 to 2034

Figure 273: Middle East and Africa Market Value Share (%) and BPS Analysis by Source, 2024 to 2034

Figure 274: Middle East and Africa Market Y-o-Y Growth (%) Projections by Source, 2024 to 2034

Figure 275: Middle East and Africa Market Value (US$ Million) Analysis by End-User, 2019 to 2034

Figure 276: Middle East and Africa Market Volume (Unit Pack) Analysis by End-User, 2019 to 2034

Figure 277: Middle East and Africa Market Value Share (%) and BPS Analysis by End-User, 2024 to 2034

Figure 278: Middle East and Africa Market Y-o-Y Growth (%) Projections by End-User, 2024 to 2034

Figure 279: Middle East and Africa Market Value (US$ Million) Analysis by Sales Channel, 2019 to 2034

Figure 280: Middle East and Africa Market Volume (Unit Pack) Analysis by Sales Channel, 2019 to 2034

Figure 281: Middle East and Africa Market Value Share (%) and BPS Analysis by Sales Channel, 2024 to 2034

Figure 282: Middle East and Africa Market Y-o-Y Growth (%) Projections by Sales Channel, 2024 to 2034

Figure 283: Middle East and Africa Market Attractiveness by Product Type, 2024 to 2034

Figure 284: Middle East and Africa Market Attractiveness by Form, 2024 to 2034

Figure 285: Middle East and Africa Market Attractiveness by Source, 2024 to 2034

Figure 286: Middle East and Africa Market Attractiveness by End-User, 2024 to 2034

Figure 287: Middle East and Africa Market Attractiveness by Sales Channel, 2024 to 2034

Figure 288: Middle East and Africa Market Attractiveness by Country, 2024 to 2034

Recommendations

Food and Beverage

Collagen Drinks Market

Published : May 2023

Food and Beverage

Collagen Casings Market

Published : March 2023

Explore Food and Beverage Insights

View Reports

Collagen Supplement Market