Collagen Skin Matrix Market Size and Share Forecast Outlook (2025 to 2035)

The Collagen Skin Matrix Market is estimated to be valued at USD 623.4 million in 2025 and is projected to reach USD 1075.6 million by 2035, registering a compound annual growth rate (CAGR) of 5.6% over the forecast period.
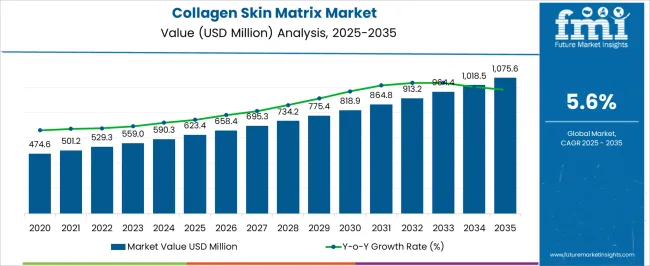
Quick Stats for Collagen Skin Matrix Market

  • Collagen Skin Matrix Market Industry Value (2025): USD 623.4 million
  • Collagen Skin Matrix Market Forecast Value (2035): USD 1075.6 million
  • Collagen Skin Matrix Market Forecast CAGR: 5.6%
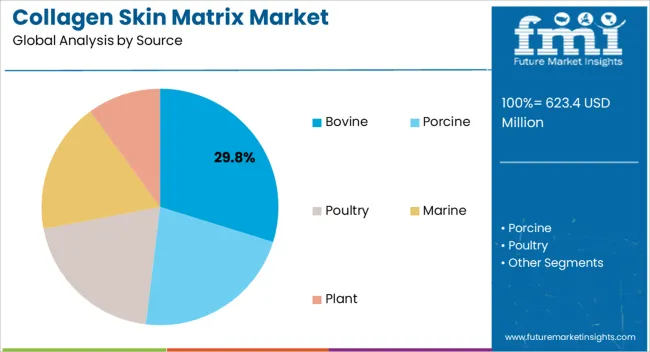
  • Leading Segment in Collagen Skin Matrix Market in 2025: Bovine (29.8%)
  • Key Growth Region in Collagen Skin Matrix Market: North America, Asia-Pacific, Europe
  • Top Key Players in Collagen Skin Matrix Market: B. Braun Medical Inc., Mölnlycke Health Care US, LLC, Organogenesis Holdings Inc., Johnson & Johnson LLC, Medline Industries, Inc., 3M, Essity Health & Medical, Smith+Nephew, Inc., Coloplast Group, Cardinal Health Inc.

Collagen Skin Matrix Market Market Value Analysis

Metric Value
Collagen Skin Matrix Market Estimated Value in (2025 E) USD 623.4 million
Collagen Skin Matrix Market Forecast Value in (2035 F) USD 1075.6 million
Forecast CAGR (2025 to 2035) 5.6%

Rationale for Segmental Growth in the Collagen Skin Matrix Market

The Collagen Skin Matrix market is experiencing robust growth, driven by the increasing demand for advanced wound healing and regenerative skin therapies across healthcare sectors. Rising prevalence of chronic wounds, surgical procedures, and dermatological conditions is creating significant demand for high-quality collagen-based skin matrices. Adoption is being supported by the proven biocompatibility, enhanced tissue regeneration, and reduced healing time offered by collagen matrices derived from natural sources.

Continuous research and development in scaffold technologies and cross-linking methods are improving structural integrity, stability, and functional performance. Hospitals, clinics, and specialized care centers are increasingly integrating collagen matrices into patient care protocols, leveraging their effectiveness in complex wound management. Regulatory approvals and clinical validation have further enhanced confidence in the use of these products.

As healthcare providers focus on improving patient outcomes and reducing recovery times, the Collagen Skin Matrix market is poised for sustained expansion Growing investments in regenerative medicine and wound care infrastructure, coupled with awareness among healthcare professionals, are expected to continue fueling market growth over the coming decade.
Segmental Analysis

Insights into the Bovine Source Segment

Collagen Skin Matrix Market Analysis By Source

The bovine source segment is projected to hold 29.8% of the market revenue in 2025, establishing it as the leading source category. Growth in this segment is being driven by the high availability, cost-effectiveness, and proven biocompatibility of bovine-derived collagen for clinical applications. Bovine collagen offers structural integrity and supports effective tissue regeneration, which is critical in wound healing and surgical procedures.

Its adoption is reinforced by standardized processing methods, ensuring consistent quality and safety. The ability to modify collagen matrices to suit specific therapeutic needs, such as different thicknesses and cross-linking densities, further strengthens its appeal among healthcare providers.

Hospitals and clinical centers increasingly prefer bovine-derived products due to their reliability, established safety profile, and compatibility with various medical applications As demand for scalable and effective wound care solutions grows, the bovine source segment is expected to maintain its leadership, supported by ongoing innovations in collagen processing and application-specific customization.
Insights into the Wound Care Application Segment

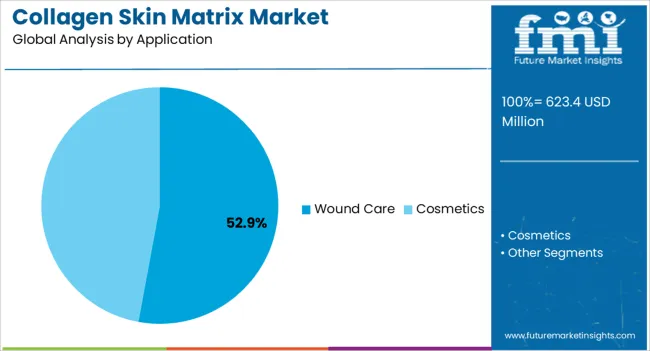
Collagen Skin Matrix Market Analysis By Application

The wound care application segment is anticipated to account for 52.9% of the market revenue in 2025, making it the leading application area. Its growth is being driven by rising incidences of chronic wounds, diabetic ulcers, surgical incisions, and trauma-related injuries, which require effective tissue regeneration solutions. Collagen skin matrices provide structural support, promote cell migration, and accelerate healing, making them critical in wound management.

Adoption is further supported by the proven clinical efficacy of collagen matrices in reducing infection risks and improving recovery outcomes. Hospitals and specialized care facilities are increasingly integrating these products into standard wound care protocols. Regulatory compliance and clinical validation have reinforced confidence in their use, enabling broader adoption.

The focus on patient-centered care, shorter hospitalization periods, and enhanced healing outcomes continues to drive demand As healthcare systems globally prioritize advanced wound management solutions, the wound care segment is expected to remain the primary growth driver, underpinned by innovation, clinical adoption, and increasing awareness among practitioners.
Insights into the Hospitals End-User Segment

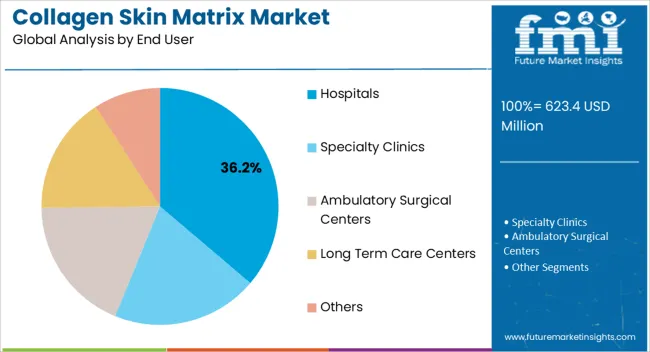
Collagen Skin Matrix Market Analysis By End User

The hospitals end-user segment is expected to hold 36.2% of the market revenue in 2025, establishing it as the leading end-user category. Growth in this segment is being driven by the high volume of patients requiring wound care, surgical interventions, and regenerative therapies, where collagen skin matrices play a critical role. Hospitals benefit from the scalability, ease of application, and consistent performance of these matrices, which support standardized treatment protocols and improve patient outcomes.

Integration with surgical procedures, wound management programs, and post-operative care workflows further reinforces adoption. Hospitals are increasingly leveraging collagen matrices to reduce healing time, lower complication rates, and enhance overall clinical efficiency.

Regulatory approvals, clinical validation, and robust supply chains ensure reliability and accessibility, encouraging adoption across diverse hospital settings As healthcare facilities continue to focus on advanced wound care and regenerative treatments, the hospitals segment is expected to maintain its leadership, supported by the growing prevalence of chronic wounds and increasing investments in hospital infrastructure.

Comparison of Historical vs Future Outlook for Collagen Skin Matrix Market (2020 to 2035)

From 2012 to 2025, the global collagen skin matrix market experienced a CAGR of 4.5%, reaching a market size of USD 623.4 million in 2025.

From 2012 to 2025, the global collagen skin matrix industry witnessed steady growth due to expanding consumer knowledge of collagen's benefits for skincare and the desire for anti-aging treatments, the collagen skin matrix market has seen significant expansion in recent years.

Collagen-based skincare products, such as creams, serums, masks, and supplements, have become increasingly popular.

Future Forecast for Collagen Skin Matrix Industry:

Looking ahead, the global collagen skin matrix industry is expected to rise at a CAGR of 5.9% from 2025 to 2035. During the forecast period, the market size is expected to reach USD 1075.6 million by 2035.

The collagen skin matrix industry is expected to continue its growth trajectory from 2025 to 2035, driven by continued research and development efforts are likely to result in the introduction of innovative collagen skin matrix products with enhanced properties, such as improved absorption, targeted formulations for specific skin concerns, and personalized solutions.

These advancements will attract consumers and drive market growth. The increasing preference for sustainable and natural skincare products extends to collagen skin matrices as well.

Analysis of Top Countries Adopting Collagen Skin Matrix

Collagen Skin Matrix Market to Surge in the United States Due to Growing Consumer Awareness

Country The United States
Market Size (USD million) by End of Forecast Period (2035) USD 1075.6.0 million
CAGR % 2025 to End of Forecast (2035) 5.4%

The collagen skin matrix industry in the United States is expected to reach a market size of USD 1075.6.0 million by 2035, expanding at a CAGR of 5.4%. Collagen's advantages for skin health have greatly raised public awareness in recent years. Consumers are actively looking for collagen-based solutions to support their skincare routines as they become more knowledgeable about the chemicals in skincare products. Consumer preferences for elements that are efficient and supported by research are what drive demand for collagen skin matrices.

Rising Demand for Collagen Skin Matrix Due to Wellness and Beauty Consciousness to Propel the United Kingdom Market Growth

Country The United Kingdom
Market Size (USD million) by End of Forecast Period (2035) USD 47.0 million
CAGR % 2025 to End of Forecast (2035) 4.7%

The collagen skin matrix industry in the United Kingdom is expected to reach a market value of USD 47.0 million, expanding at a CAGR of 4.7% during the forecast period. The UK has a strong emphasis on wellness and beauty consciousness, with consumers prioritizing self-care and investing in skincare routines. Collagen skin matrices, known for their skin-rejuvenating properties, are in high demand among consumers seeking effective and innovative beauty solutions.

Notable Growth Expected in China's Collagen Skin Matrix Market to Large Population and Growing Middle Class

Country China
Market Size (USD million) by End of Forecast Period (2035) USD 77.6 million
CAGR % 2025 to End of Forecast (2035) 7.5%

The collagen skin matrix industry in China is anticipated to reach a market size of USD 77.6 million, moving at a CAGR of 7.5% during the forecast period. China's large population, particularly its growing middle class, presents a substantial consumer base for skincare products. The increasing disposable incomes and changing beauty standards in China are driving the demand for collagen skin matrices among consumers seeking to improve their skincare routines and address skin concerns.
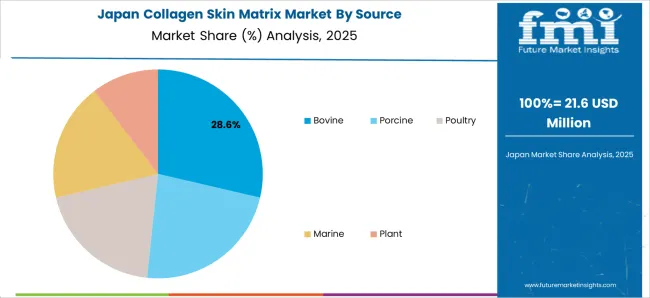
Technological Innovations to Drive Market Growth in Japan

Collagen Skin Matrix Market Japan Market Share Analysis By Source

Country Japan
Market Size (USD million) by End of Forecast Period (2035) USD 44.1 million
CAGR % 2025 to End of Forecast (2035) 6.1%

The collagen skin matrix industry in Japan is estimated to reach a market size of USD 44.1 million by 2035, thriving at a CAGR of 6.1%. Japan is known for its advancements in skincare technology and cosmetic formulations.

The Japanese market offers a wide range of collagen skin matrices that incorporate innovative delivery systems, bioactive ingredients, and scientific research. Technological innovations contribute to the growth of the market by providing highly effective and advanced collagen-based products.
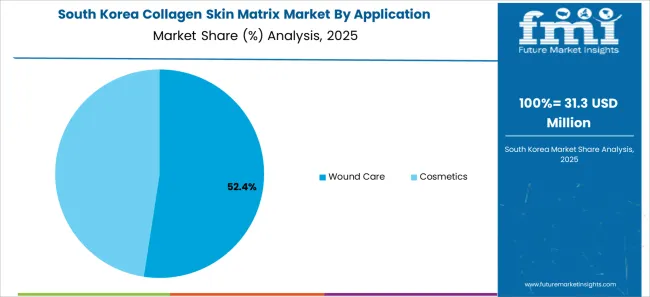
Demand for Collagen Skin Matrix is Rising Due to Popularity of Aesthetic Procedures to Fuel Market Growth in South Korea

Collagen Skin Matrix Market South Korea Market Share Analysis By Application

Country South Korea
Market Size (USD million) by End of Forecast Period (2035) USD 40.4 million
CAGR % 2025 to End of Forecast (2035) 7.3%

The collagen skin matrix industry in South Korea is expected to reach a market size of USD 40.4 million, expanding at a CAGR of 7.3% during the forecast period. South Korea is known for its booming aesthetic industry and high demand for cosmetic procedures.

Collagen skin matrices are often used in conjunction with aesthetic treatments to enhance skin rejuvenation, promote healing, and improve treatment outcomes. The popularity of aesthetic procedures contributes to the growth of the collagen skin matrix market.

Collagen Skin Matrix Industry Analysis by Category

Bovine to Dominate Collagen Skin Matrix Industry with 6.3% CAGR through 2035

The Bovine is expected to dominate the collagen skin matrix industry with a CAGR of 6.3% from 2025 to 2035. Bovine collagen is one of the most widely available sources of collagen for commercial use. Cattle farming is widespread in many countries, making bovine collagen easily accessible for extraction and production.

The abundance and availability of bovine collagen help meet the growing demand for collagen skin matrices in the market. Bovine collagen is rich in type I collagen, which is the most abundant collagen type in human skin. Type I collagen is known for its ability to enhance skin elasticity, firmness, and hydration. The high collagen content in bovine collagen makes it a valuable ingredient for collagen skin matrices.

How the Wound Care Applications are Driving the Collagen Skin Matrix Market?

The Wound Care application segments are expected to dominate the collagen skin matrix industry with a CAGR of 5.7% from 2025 to 2035. Collagen skin matrices have excellent wound healing properties. They provide a structural framework that supports cell migration, proliferation, and tissue regeneration.

The use of collagen matrices in wound care promotes faster and more efficient healing, making them a valuable component in advanced wound care products.

Which End User is Widely Adopted the Collagen Skin Matrix?

The hospital segment is expected to dominate the collagen skin matrix industry with a CAGR of 5.5% from 2025 to 2035. Hospitals serve as primary care settings for patients with various skin-related conditions, including wounds, burns, and surgical procedures.

Collagen skin matrices are commonly used in hospitals to facilitate wound healing and promote tissue regeneration. The demand for collagen skin matrices arises from the need for effective and efficient wound care solutions in hospital settings.
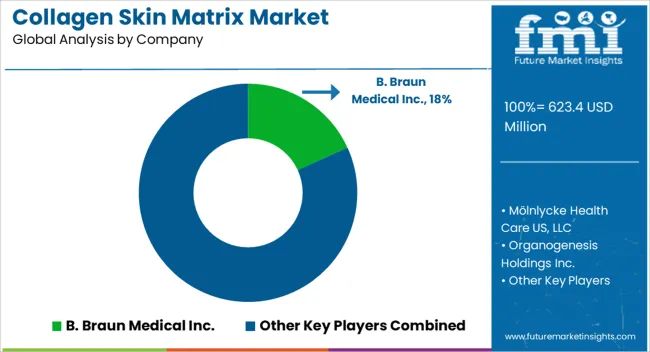
Competitive Landscape of the Collagen Skin Matrix Market

Collagen Skin Matrix Market Analysis By Company

The collagen skin matrix sector is fiercely competitive, with many companies fighting for market dominance. To stay ahead of the competition in such a circumstance, essential players must employ smart techniques.

Key Strategies Used by the Participants

  • Product Development

To produce innovative goods that increase efficacy, dependability, and cost-effectiveness, businesses make significant investments in research and development. Product innovation enables companies to stand out from the competition while also meeting the shifting needs of their customers.

  • Strategic Alliances & Collaborations

Strategic alliances and partnerships with other businesses are regularly formed by major players in an industry to take advantage of each other's advantages and expand their market reach. Through such arrangements, businesses may also obtain access to new technologies and markets.

  • Expansion into Emerging Markets

Emerging nations like China and India are experiencing fast growth in the collagen skin matrix industry. To boost their presence in these regions, major companies are expanding their distribution networks and building regional manufacturing sites.

  • Acquisitions and mergers

Key players in the collagen skin matrix industry routinely employ mergers and acquisitions to strengthen their market positions, broaden their product offerings, and enter new markets.

Key Collagen Skin Matrix Market Players and Concentration

  • B. Braun Medical Inc.
  • Mölnlycke Health Care US, LLC
  • Organogenesis Holdings Inc.
  • Johnson & Johnson LLC
  • Medline Industries, Inc.
  • 3M
  • Essity Health & Medical
  • Smith+Nephew, Inc.
  • Coloplast Group
  • Cardinal Health Inc.

Key Developments in the Collagen Skin Matrix Market:

  • In September 2024, Following the FDA 510(k) premarket notification process, skin science startup Omeza reported that the FDA has cleared Omeza® Collagen Matrix. Omeza® Collagen Matrix is Omeza's first Rx product and the first drug/device combined matrix of this type for the treatment of chronic wounds.
  • The most recent advanced wound therapy trials on its PuraPly AM, Affinity, Apligraf, NuShield, NovachorTM, and Organogenesis Physician Solutions product lines were presented at the Advance Wounds Care (SAWC) April Conference in April 2025. Organogenesis, a pioneer in regenerative medicine, is committed to creating, producing, and disseminating product solutions for the fields of advanced wound care, surgery, and sports medicine.

Top Segments Studied in the Collagen Skin Matrix Market Research Report

By Source:

  • Bovine
  • Porcine
  • Poultry
  • Marine
  • Plant

By Application:

  • Wound Care
    • Chronic Wounds
    • Burns
    • Post-surgical Wounds
    • Traumatic Wounds
  • Cosmetics

By End User:

  • Hospitals
  • Specialty Clinics
  • Ambulatory Surgical Centers
  • Long Term Care Centers
  • Others

By Region:

  • North America
  • Latin America
  • Europe
  • East Asia
  • South Asia
  • Oceania
  • The Middle East & Africa

Table of Content

  1. Executive Summary
    • Global Market Outlook
    • Demand-side Trends
    • Supply-side Trends
    • Technology Roadmap Analysis
    • Analysis and Recommendations
  2. Market Overview
    • Market Coverage / Taxonomy
    • Market Definition / Scope / Limitations
  3. Market Background
    • Market Dynamics
      • Drivers
      • Restraints
      • Opportunity
      • Trends
    • Scenario Forecast
      • Demand in Optimistic Scenario
      • Demand in Likely Scenario
      • Demand in Conservative Scenario
    • Opportunity Map Analysis
    • Product Life Cycle Analysis
    • Supply Chain Analysis
    • Investment Feasibility Matrix
    • Value Chain Analysis
    • PESTLE and Porter’s Analysis
    • Regulatory Landscape
    • Regional Parent Market Outlook
    • Production and Consumption Statistics
    • Import and Export Statistics
  4. Global Market Analysis 2020 to 2024 and Forecast, 2025 to 2035
    • Historical Market Size Value (USD Million) Analysis, 2020 to 2024
    • Current and Future Market Size Value (USD Million) Projections, 2025 to 2035
      • Y-o-Y Growth Trend Analysis
      • Absolute $ Opportunity Analysis
  5. Global Market Pricing Analysis 2020 to 2024 and Forecast 2025 to 2035
  6. Global Market Analysis 2020 to 2024 and Forecast 2025 to 2035, By Source
    • Introduction / Key Findings
    • Historical Market Size Value (USD Million) Analysis By Source , 2020 to 2024
    • Current and Future Market Size Value (USD Million) Analysis and Forecast By Source , 2025 to 2035
      • Bovine
      • Porcine
      • Poultry
      • Marine
      • Plant
    • Y-o-Y Growth Trend Analysis By Source , 2020 to 2024
    • Absolute $ Opportunity Analysis By Source , 2025 to 2035
  7. Global Market Analysis 2020 to 2024 and Forecast 2025 to 2035, By Application
    • Introduction / Key Findings
    • Historical Market Size Value (USD Million) Analysis By Application, 2020 to 2024
    • Current and Future Market Size Value (USD Million) Analysis and Forecast By Application, 2025 to 2035
      • Wound Care
        • Chronic Wounds
        • Burns
        • Post-Surgical Wounds
        • Traumatic Wounds
      • Cosmetics
    • Y-o-Y Growth Trend Analysis By Application, 2020 to 2024
    • Absolute $ Opportunity Analysis By Application, 2025 to 2035
  8. Global Market Analysis 2020 to 2024 and Forecast 2025 to 2035, By End User
    • Introduction / Key Findings
    • Historical Market Size Value (USD Million) Analysis By End User, 2020 to 2024
    • Current and Future Market Size Value (USD Million) Analysis and Forecast By End User, 2025 to 2035
      • Hospitals
      • Specialty Clinics
      • Ambulatory Surgical Centers
      • Long Term Care Centers
      • Others
    • Y-o-Y Growth Trend Analysis By End User, 2020 to 2024
    • Absolute $ Opportunity Analysis By End User, 2025 to 2035
  9. Global Market Analysis 2020 to 2024 and Forecast 2025 to 2035, By Region
    • Introduction
    • Historical Market Size Value (USD Million) Analysis By Region, 2020 to 2024
    • Current Market Size Value (USD Million) Analysis and Forecast By Region, 2025 to 2035
      • North America
      • Latin America
      • Western Europe
      • Eastern Europe
      • East Asia
      • South Asia and Pacific
      • Middle East & Africa
    • Market Attractiveness Analysis By Region
  10. North America Market Analysis 2020 to 2024 and Forecast 2025 to 2035, By Country
    • Historical Market Size Value (USD Million) Trend Analysis By Market Taxonomy, 2020 to 2024
    • Market Size Value (USD Million) Forecast By Market Taxonomy, 2025 to 2035
      • By Country
        • USA
        • Canada
        • Mexico
      • By Source
      • By Application
      • By End User
    • Market Attractiveness Analysis
      • By Country
      • By Source
      • By Application
      • By End User
    • Key Takeaways
  11. Latin America Market Analysis 2020 to 2024 and Forecast 2025 to 2035, By Country
    • Historical Market Size Value (USD Million) Trend Analysis By Market Taxonomy, 2020 to 2024
    • Market Size Value (USD Million) Forecast By Market Taxonomy, 2025 to 2035
      • By Country
        • Brazil
        • Chile
        • Rest of Latin America
      • By Source
      • By Application
      • By End User
    • Market Attractiveness Analysis
      • By Country
      • By Source
      • By Application
      • By End User
    • Key Takeaways
  12. Western Europe Market Analysis 2020 to 2024 and Forecast 2025 to 2035, By Country
    • Historical Market Size Value (USD Million) Trend Analysis By Market Taxonomy, 2020 to 2024
    • Market Size Value (USD Million) Forecast By Market Taxonomy, 2025 to 2035
      • By Country
        • Germany
        • UK
        • Italy
        • Spain
        • France
        • Nordic
        • BENELUX
        • Rest of Western Europe
      • By Source
      • By Application
      • By End User
    • Market Attractiveness Analysis
      • By Country
      • By Source
      • By Application
      • By End User
    • Key Takeaways
  13. Eastern Europe Market Analysis 2020 to 2024 and Forecast 2025 to 2035, By Country
    • Historical Market Size Value (USD Million) Trend Analysis By Market Taxonomy, 2020 to 2024
    • Market Size Value (USD Million) Forecast By Market Taxonomy, 2025 to 2035
      • By Country
        • Russia
        • Poland
        • Hungary
        • Balkan & Baltic
        • Rest of Eastern Europe
      • By Source
      • By Application
      • By End User
    • Market Attractiveness Analysis
      • By Country
      • By Source
      • By Application
      • By End User
    • Key Takeaways
  14. East Asia Market Analysis 2020 to 2024 and Forecast 2025 to 2035, By Country
    • Historical Market Size Value (USD Million) Trend Analysis By Market Taxonomy, 2020 to 2024
    • Market Size Value (USD Million) Forecast By Market Taxonomy, 2025 to 2035
      • By Country
        • China
        • Japan
        • South Korea
      • By Source
      • By Application
      • By End User
    • Market Attractiveness Analysis
      • By Country
      • By Source
      • By Application
      • By End User
    • Key Takeaways
  15. South Asia and Pacific Market Analysis 2020 to 2024 and Forecast 2025 to 2035, By Country
    • Historical Market Size Value (USD Million) Trend Analysis By Market Taxonomy, 2020 to 2024
    • Market Size Value (USD Million) Forecast By Market Taxonomy, 2025 to 2035
      • By Country
        • India
        • ASEAN
        • Australia & New Zealand
        • Rest of South Asia and Pacific
      • By Source
      • By Application
      • By End User
    • Market Attractiveness Analysis
      • By Country
      • By Source
      • By Application
      • By End User
    • Key Takeaways
  16. Middle East & Africa Market Analysis 2020 to 2024 and Forecast 2025 to 2035, By Country
    • Historical Market Size Value (USD Million) Trend Analysis By Market Taxonomy, 2020 to 2024
    • Market Size Value (USD Million) Forecast By Market Taxonomy, 2025 to 2035
      • By Country
        • Kingdom of Saudi Arabia
        • Other GCC Countries
        • Turkiye
        • South Africa
        • Other African Union
        • Rest of Middle East & Africa
      • By Source
      • By Application
      • By End User
    • Market Attractiveness Analysis
      • By Country
      • By Source
      • By Application
      • By End User
    • Key Takeaways
  17. Key Countries Market Analysis
    • USA
      • Pricing Analysis
      • Market Share Analysis, 2024
        • By Source
        • By Application
        • By End User
    • Canada
      • Pricing Analysis
      • Market Share Analysis, 2024
        • By Source
        • By Application
        • By End User
    • Mexico
      • Pricing Analysis
      • Market Share Analysis, 2024
        • By Source
        • By Application
        • By End User
    • Brazil
      • Pricing Analysis
      • Market Share Analysis, 2024
        • By Source
        • By Application
        • By End User
    • Chile
      • Pricing Analysis
      • Market Share Analysis, 2024
        • By Source
        • By Application
        • By End User
    • Germany
      • Pricing Analysis
      • Market Share Analysis, 2024
        • By Source
        • By Application
        • By End User
    • UK
      • Pricing Analysis
      • Market Share Analysis, 2024
        • By Source
        • By Application
        • By End User
    • Italy
      • Pricing Analysis
      • Market Share Analysis, 2024
        • By Source
        • By Application
        • By End User
    • Spain
      • Pricing Analysis
      • Market Share Analysis, 2024
        • By Source
        • By Application
        • By End User
    • France
      • Pricing Analysis
      • Market Share Analysis, 2024
        • By Source
        • By Application
        • By End User
    • India
      • Pricing Analysis
      • Market Share Analysis, 2024
        • By Source
        • By Application
        • By End User
    • ASEAN
      • Pricing Analysis
      • Market Share Analysis, 2024
        • By Source
        • By Application
        • By End User
    • Australia & New Zealand
      • Pricing Analysis
      • Market Share Analysis, 2024
        • By Source
        • By Application
        • By End User
    • China
      • Pricing Analysis
      • Market Share Analysis, 2024
        • By Source
        • By Application
        • By End User
    • Japan
      • Pricing Analysis
      • Market Share Analysis, 2024
        • By Source
        • By Application
        • By End User
    • South Korea
      • Pricing Analysis
      • Market Share Analysis, 2024
        • By Source
        • By Application
        • By End User
    • Russia
      • Pricing Analysis
      • Market Share Analysis, 2024
        • By Source
        • By Application
        • By End User
    • Poland
      • Pricing Analysis
      • Market Share Analysis, 2024
        • By Source
        • By Application
        • By End User
    • Hungary
      • Pricing Analysis
      • Market Share Analysis, 2024
        • By Source
        • By Application
        • By End User
    • Kingdom of Saudi Arabia
      • Pricing Analysis
      • Market Share Analysis, 2024
        • By Source
        • By Application
        • By End User
    • Turkiye
      • Pricing Analysis
      • Market Share Analysis, 2024
        • By Source
        • By Application
        • By End User
    • South Africa
      • Pricing Analysis
      • Market Share Analysis, 2024
        • By Source
        • By Application
        • By End User
  18. Market Structure Analysis
    • Competition Dashboard
    • Competition Benchmarking
    • Market Share Analysis of Top Players
      • By Regional
      • By Source
      • By Application
      • By End User
  19. Competition Analysis
    • Competition Deep Dive
      • B. Braun Medical Inc.
        • Overview
        • Product Portfolio
        • Profitability by Market Segments (Product/Age /Sales Channel/Region)
        • Sales Footprint
        • Strategy Overview
          • Marketing Strategy
          • Product Strategy
          • Channel Strategy
      • Mölnlycke Health Care US, LLC
      • Organogenesis Holdings Inc.
      • Johnson & Johnson LLC
      • Medline Industries, Inc.
      • 3M
      • Essity Health & Medical
      • Smith+Nephew, Inc.
      • Coloplast Group
      • Cardinal Health Inc.
  20. Assumptions & Acronyms Used
  21. Research Methodology

List of Tables

  • Table 1: Global Market Value (USD Million) Forecast by Region, 2020 to 2035
  • Table 2: Global Market Value (USD Million) Forecast by Source , 2020 to 2035
  • Table 3: Global Market Value (USD Million) Forecast by Application, 2020 to 2035
  • Table 4: Global Market Value (USD Million) Forecast by End User, 2020 to 2035
  • Table 5: North America Market Value (USD Million) Forecast by Country, 2020 to 2035
  • Table 6: North America Market Value (USD Million) Forecast by Source , 2020 to 2035
  • Table 7: North America Market Value (USD Million) Forecast by Application, 2020 to 2035
  • Table 8: North America Market Value (USD Million) Forecast by End User, 2020 to 2035
  • Table 9: Latin America Market Value (USD Million) Forecast by Country, 2020 to 2035
  • Table 10: Latin America Market Value (USD Million) Forecast by Source , 2020 to 2035
  • Table 11: Latin America Market Value (USD Million) Forecast by Application, 2020 to 2035
  • Table 12: Latin America Market Value (USD Million) Forecast by End User, 2020 to 2035
  • Table 13: Western Europe Market Value (USD Million) Forecast by Country, 2020 to 2035
  • Table 14: Western Europe Market Value (USD Million) Forecast by Source , 2020 to 2035
  • Table 15: Western Europe Market Value (USD Million) Forecast by Application, 2020 to 2035
  • Table 16: Western Europe Market Value (USD Million) Forecast by End User, 2020 to 2035
  • Table 17: Eastern Europe Market Value (USD Million) Forecast by Country, 2020 to 2035
  • Table 18: Eastern Europe Market Value (USD Million) Forecast by Source , 2020 to 2035
  • Table 19: Eastern Europe Market Value (USD Million) Forecast by Application, 2020 to 2035
  • Table 20: Eastern Europe Market Value (USD Million) Forecast by End User, 2020 to 2035
  • Table 21: East Asia Market Value (USD Million) Forecast by Country, 2020 to 2035
  • Table 22: East Asia Market Value (USD Million) Forecast by Source , 2020 to 2035
  • Table 23: East Asia Market Value (USD Million) Forecast by Application, 2020 to 2035
  • Table 24: East Asia Market Value (USD Million) Forecast by End User, 2020 to 2035
  • Table 25: South Asia and Pacific Market Value (USD Million) Forecast by Country, 2020 to 2035
  • Table 26: South Asia and Pacific Market Value (USD Million) Forecast by Source , 2020 to 2035
  • Table 27: South Asia and Pacific Market Value (USD Million) Forecast by Application, 2020 to 2035
  • Table 28: South Asia and Pacific Market Value (USD Million) Forecast by End User, 2020 to 2035
  • Table 29: Middle East & Africa Market Value (USD Million) Forecast by Country, 2020 to 2035
  • Table 30: Middle East & Africa Market Value (USD Million) Forecast by Source , 2020 to 2035
  • Table 31: Middle East & Africa Market Value (USD Million) Forecast by Application, 2020 to 2035
  • Table 32: Middle East & Africa Market Value (USD Million) Forecast by End User, 2020 to 2035

List of Figures

  • Figure 1: Global Market Pricing Analysis
  • Figure 2: Global Market Value (USD Million) Forecast 2020-2035
  • Figure 3: Global Market Value Share and BPS Analysis by Source , 2025 and 2035
  • Figure 4: Global Market Y-o-Y Growth Comparison by Source , 2025-2035
  • Figure 5: Global Market Attractiveness Analysis by Source
  • Figure 6: Global Market Value Share and BPS Analysis by Application, 2025 and 2035
  • Figure 7: Global Market Y-o-Y Growth Comparison by Application, 2025-2035
  • Figure 8: Global Market Attractiveness Analysis by Application
  • Figure 9: Global Market Value Share and BPS Analysis by End User, 2025 and 2035
  • Figure 10: Global Market Y-o-Y Growth Comparison by End User, 2025-2035
  • Figure 11: Global Market Attractiveness Analysis by End User
  • Figure 12: Global Market Value (USD Million) Share and BPS Analysis by Region, 2025 and 2035
  • Figure 13: Global Market Y-o-Y Growth Comparison by Region, 2025-2035
  • Figure 14: Global Market Attractiveness Analysis by Region
  • Figure 15: North America Market Incremental Dollar Opportunity, 2025-2035
  • Figure 16: Latin America Market Incremental Dollar Opportunity, 2025-2035
  • Figure 17: Western Europe Market Incremental Dollar Opportunity, 2025-2035
  • Figure 18: Eastern Europe Market Incremental Dollar Opportunity, 2025-2035
  • Figure 19: East Asia Market Incremental Dollar Opportunity, 2025-2035
  • Figure 20: South Asia and Pacific Market Incremental Dollar Opportunity, 2025-2035
  • Figure 21: Middle East & Africa Market Incremental Dollar Opportunity, 2025-2035
  • Figure 22: North America Market Value Share and BPS Analysis by Country, 2025 and 2035
  • Figure 23: North America Market Value Share and BPS Analysis by Source , 2025 and 2035
  • Figure 24: North America Market Y-o-Y Growth Comparison by Source , 2025-2035
  • Figure 25: North America Market Attractiveness Analysis by Source
  • Figure 26: North America Market Value Share and BPS Analysis by Application, 2025 and 2035
  • Figure 27: North America Market Y-o-Y Growth Comparison by Application, 2025-2035
  • Figure 28: North America Market Attractiveness Analysis by Application
  • Figure 29: North America Market Value Share and BPS Analysis by End User, 2025 and 2035
  • Figure 30: North America Market Y-o-Y Growth Comparison by End User, 2025-2035
  • Figure 31: North America Market Attractiveness Analysis by End User
  • Figure 32: Latin America Market Value Share and BPS Analysis by Country, 2025 and 2035
  • Figure 33: Latin America Market Value Share and BPS Analysis by Source , 2025 and 2035
  • Figure 34: Latin America Market Y-o-Y Growth Comparison by Source , 2025-2035
  • Figure 35: Latin America Market Attractiveness Analysis by Source
  • Figure 36: Latin America Market Value Share and BPS Analysis by Application, 2025 and 2035
  • Figure 37: Latin America Market Y-o-Y Growth Comparison by Application, 2025-2035
  • Figure 38: Latin America Market Attractiveness Analysis by Application
  • Figure 39: Latin America Market Value Share and BPS Analysis by End User, 2025 and 2035
  • Figure 40: Latin America Market Y-o-Y Growth Comparison by End User, 2025-2035
  • Figure 41: Latin America Market Attractiveness Analysis by End User
  • Figure 42: Western Europe Market Value Share and BPS Analysis by Country, 2025 and 2035
  • Figure 43: Western Europe Market Value Share and BPS Analysis by Source , 2025 and 2035
  • Figure 44: Western Europe Market Y-o-Y Growth Comparison by Source , 2025-2035
  • Figure 45: Western Europe Market Attractiveness Analysis by Source
  • Figure 46: Western Europe Market Value Share and BPS Analysis by Application, 2025 and 2035
  • Figure 47: Western Europe Market Y-o-Y Growth Comparison by Application, 2025-2035
  • Figure 48: Western Europe Market Attractiveness Analysis by Application
  • Figure 49: Western Europe Market Value Share and BPS Analysis by End User, 2025 and 2035
  • Figure 50: Western Europe Market Y-o-Y Growth Comparison by End User, 2025-2035
  • Figure 51: Western Europe Market Attractiveness Analysis by End User
  • Figure 52: Eastern Europe Market Value Share and BPS Analysis by Country, 2025 and 2035
  • Figure 53: Eastern Europe Market Value Share and BPS Analysis by Source , 2025 and 2035
  • Figure 54: Eastern Europe Market Y-o-Y Growth Comparison by Source , 2025-2035
  • Figure 55: Eastern Europe Market Attractiveness Analysis by Source
  • Figure 56: Eastern Europe Market Value Share and BPS Analysis by Application, 2025 and 2035
  • Figure 57: Eastern Europe Market Y-o-Y Growth Comparison by Application, 2025-2035
  • Figure 58: Eastern Europe Market Attractiveness Analysis by Application
  • Figure 59: Eastern Europe Market Value Share and BPS Analysis by End User, 2025 and 2035
  • Figure 60: Eastern Europe Market Y-o-Y Growth Comparison by End User, 2025-2035
  • Figure 61: Eastern Europe Market Attractiveness Analysis by End User
  • Figure 62: East Asia Market Value Share and BPS Analysis by Country, 2025 and 2035
  • Figure 63: East Asia Market Value Share and BPS Analysis by Source , 2025 and 2035
  • Figure 64: East Asia Market Y-o-Y Growth Comparison by Source , 2025-2035
  • Figure 65: East Asia Market Attractiveness Analysis by Source
  • Figure 66: East Asia Market Value Share and BPS Analysis by Application, 2025 and 2035
  • Figure 67: East Asia Market Y-o-Y Growth Comparison by Application, 2025-2035
  • Figure 68: East Asia Market Attractiveness Analysis by Application
  • Figure 69: East Asia Market Value Share and BPS Analysis by End User, 2025 and 2035
  • Figure 70: East Asia Market Y-o-Y Growth Comparison by End User, 2025-2035
  • Figure 71: East Asia Market Attractiveness Analysis by End User
  • Figure 72: South Asia and Pacific Market Value Share and BPS Analysis by Country, 2025 and 2035
  • Figure 73: South Asia and Pacific Market Value Share and BPS Analysis by Source , 2025 and 2035
  • Figure 74: South Asia and Pacific Market Y-o-Y Growth Comparison by Source , 2025-2035
  • Figure 75: South Asia and Pacific Market Attractiveness Analysis by Source
  • Figure 76: South Asia and Pacific Market Value Share and BPS Analysis by Application, 2025 and 2035
  • Figure 77: South Asia and Pacific Market Y-o-Y Growth Comparison by Application, 2025-2035
  • Figure 78: South Asia and Pacific Market Attractiveness Analysis by Application
  • Figure 79: South Asia and Pacific Market Value Share and BPS Analysis by End User, 2025 and 2035
  • Figure 80: South Asia and Pacific Market Y-o-Y Growth Comparison by End User, 2025-2035
  • Figure 81: South Asia and Pacific Market Attractiveness Analysis by End User
  • Figure 82: Middle East & Africa Market Value Share and BPS Analysis by Country, 2025 and 2035
  • Figure 83: Middle East & Africa Market Value Share and BPS Analysis by Source , 2025 and 2035
  • Figure 84: Middle East & Africa Market Y-o-Y Growth Comparison by Source , 2025-2035
  • Figure 85: Middle East & Africa Market Attractiveness Analysis by Source
  • Figure 86: Middle East & Africa Market Value Share and BPS Analysis by Application, 2025 and 2035
  • Figure 87: Middle East & Africa Market Y-o-Y Growth Comparison by Application, 2025-2035
  • Figure 88: Middle East & Africa Market Attractiveness Analysis by Application
  • Figure 89: Middle East & Africa Market Value Share and BPS Analysis by End User, 2025 and 2035
  • Figure 90: Middle East & Africa Market Y-o-Y Growth Comparison by End User, 2025-2035
  • Figure 91: Middle East & Africa Market Attractiveness Analysis by End User
  • Figure 92: Global Market - Tier Structure Analysis
  • Figure 93: Global Market - Company Share Analysis

Frequently Asked Questions

How big is the collagen skin matrix market in 2025?

The global collagen skin matrix market is estimated to be valued at USD 623.4 million in 2025.

What will be the size of collagen skin matrix market in 2035?

The market size for the collagen skin matrix market is projected to reach USD 1,075.6 million by 2035.

How much will be the collagen skin matrix market growth between 2025 and 2035?

The collagen skin matrix market is expected to grow at a 5.6% CAGR between 2025 and 2035.

What are the key product types in the collagen skin matrix market?

The key product types in collagen skin matrix market are bovine, porcine, poultry, marine and plant.

Which application segment to contribute significant share in the collagen skin matrix market in 2025?

In terms of application, wound care segment to command 52.9% share in the collagen skin matrix market in 2025.

Explore Similar Insights

Future Market Insights

Collagen Skin Matrix Market

Chat With MaRIA

Chat With

MaRIA

Hi There, I am MaRIA, Your Market Research Intelligence Assistant. How may I help you?