Skin Sensors Market Analysis and Forecast for 2025 to 2035

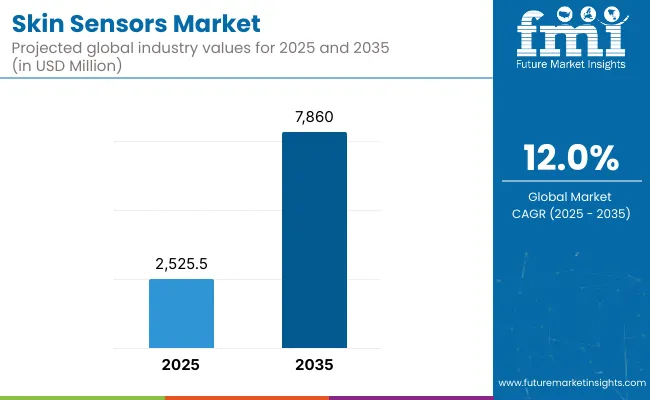
The Skin Sensors Market is expected to record a valuation of USD 2,525.5 million in 2025 and reach USD 7,860 million by 2035, marking an absolute increase of USD 5,334.5 million, which reflects a growth of 211.2% over the decade. This expansion equates to a CAGR of 12.0% and a 3.1X increase in overall market size from 2025 to 2035.
Quick Stats for Skin Sensors Market

  • Skin Sensors Market Value (2025): USD 2,525.5 million
  • Skin Sensors Market Forecast Value (2035): USD 7,860 million
  • Skin Sensors Market Forecast CAGR: 12.0%
  • Leading Segment in Skin Sensors Market in 2025: Hydration Sensors (32.5%)
  • Key Growth Regions in the Skin Sensors Market: North America, Asia-Pacific, Europe
  • Top Key Players in Skin Sensors Market: E-Skin Displays Inc., Xsensio,EpicoreBiosystems,VivaLNK,MC10, Grapheal,iRhythm Technologies, Inc.,GE Healthcare,Biolinq Inc., HydroSKIN Technologies

Skin Sensors Market

Skin Sensors Market Key Takeaways

Metric Value
Market Estimated Value in (2025E) USD 2,525.5 million
Market Forecast Value in (2035F) USD 7,860 million
Forecast CAGR (2025 to 2035) 12.0%

During the first half of the forecast period (2025-2030), the market is projected to grow from USD 2,525.5 million to USD 4,699.1 million, contributing USD 2,173.6 million, or 40.7% of the decade's total growth. This growth phase is defined by early adoption of hydration sensors, sweat analytics patches, and stretchable biosensors within athletic monitoring, skincare diagnostics, and chronic health tracking. Hydration sensors dominate in 2025 with a 32.5% market share, owing to their high utility in real-time skin moisture tracking for both wellness and medical applications.

Between 2030 and 2035, the market expands further from USD 4,699.1 million to USD 7,860 million, adding USD 3,160.9 million, which accounts for 59.3% of the total decade growth. This stronger back-half surge is driven by rapid integration of multi-analyte sensing platforms, flexible microfluidic skin patches, and AI-enabled diagnostics.

A shift toward cloud-connected skin monitoring ecosystems becomes more prominent, as remote patient monitoring and personalized skincare programs gain user confidence. Advanced sweat composition analyzers and electrolyte-balancing sensors collectively gain over 40% share by 2035, supported by digital platforms offering diagnostics-as-a-service and health optimization

The global skin sensors market is projected to expand significantly, growing from USD 2,525.5 million in 2025 to USD 7,860 million by 2035. This increase, translating to a CAGR of 12.0%, reflects rising integration of smart diagnostics in wearables, patches, and e-skin devices for healthcare, wellness, and industrial use cases.

Key application areas such as chronic disease monitoring, remote patient tracking, and stress detection are fueling demand. North America remains a hub for sensor innovation and clinical trials, while Asia-Pacific benefits from an expanding base of digital health adopters and manufacturing capabilities.

The competitive landscape is becoming increasingly dynamic with both start-ups and established players investing in R&D for stretchable, biocompatible, and multifunctional sensor technologies. Companies are prioritizing skin-conformal platforms that can monitor parameters like temperature, sweat metabolites, and electrical signals without causing discomfort.

Europe is progressing steadily, aided by favorable medical device regulations and adoption of wearable tech in eldercare. Software-driven capabilities such as real-time data analytics and cloud connectivity are enhancing product value, while partnerships with healthcare systems and tech integrators are shaping go-to-market strategies across regions.

Why the Skin Sensors Market is growing?

The Skin Sensors Market is witnessing strong growth due to the rising demand for non-invasive health monitoring technologies. Consumers and healthcare professionals alike are increasingly seeking solutions that allow continuous tracking of biomarkers such as hydration, glucose, cortisol, and electrolyte levels without the need for invasive procedures.

Skin sensors, being lightweight, comfortable, and skin-adherent, offer a compelling platform for real-time physiological data collection, especially in daily health tracking and chronic disease management.

A key growth factor lies in the personalization trend sweeping across the skincare and wellness industry. There is increasing consumer interest in customized skincare routines and diagnostic insights tailored to individual skin conditions.

Skin sensors that monitor hydration, pH, and oil levels are being adopted to inform personalized regimens, particularly in beauty-conscious markets like Asia-Pacific and North America. These developments are creating new consumer-facing use cases beyond medical applications.

The integration of skin sensors with wearables and Internet of Things (IoT) ecosystems is expanding the appeal of these devices. Skin-interfaced sensors that sync with mobile apps, smartwatches, and cloud platforms provide users and clinicians with real-time updates, trend tracking, and health alerts. This seamless data connectivity has enabled the development of subscription-based wellness platforms, digital diagnostics, and telehealth services that rely on skin sensor inputs.

Segmental Analysis

The skin sensors market is segmented by product type, sensor type, application, technology, and region. Product types include wearable skin sensors, electronic skin patches, and flexible/bendable sensors, reflecting diverse formats for medical, wellness, and performance-related uses. Sensor type classification encompasses hydration sensors, strain & motion sensors, temperature sensors, electrochemical sensors, and others, offering specialized functionalities for physiological monitoring and real-time diagnostics.

Applications span health monitoring, sports & fitness monitoring, cosmetic & skin wellness, and wound healing monitoring, aligning with the expanding range of healthcare, personal care, and athletic performance needs. In terms of technology, segmentation includes stretchable electronics, MEMS/NEMS-based sensors, and wireless-enabled sensors, demonstrating integration of advanced materials and connectivity for skin-conformal monitoring.

Regionally, the scope spans North America, Latin America, Europe, East Asia, South Asia & Pacific, and the Middle East & Africa, capturing both established healthcare and diagnostics markets as well as emerging wellness-focused economies with rising adoption of skin-based biosensing technologies.
Insights into the Component Segment with Skin Sensors Leading in Market Share

Skin Sensors Market By Product

By Product Type Value Share % 2025
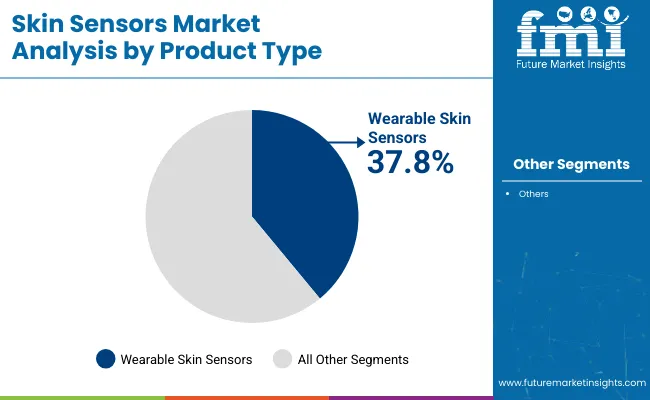
Wearable Skin Sensors 37.8%
Others 62.2%

As of 2025, wearable skin sensors dominate the product type segmentation within the global skin sensors market, accounting for 37.8% of value share. This segment’s prominence has been attributed to the rapid uptake of smart wearable technologies in clinical diagnostics, continuous health monitoring, and sports performance tracking.

The increasing miniaturization of biosensors and improvements in stretchable, biocompatible materials have supported higher integration into wearable formats, making them more user-friendly and multifunctional. Their appeal has grown further in fitness-conscious populations and among patients requiring non-invasive health tracking solutions.

The remaining 62.2% share, attributed to ‘Others’, includes subtypes such as electronic skin patches and flexible/bendable sensors, which, while growing steadily, have yet to match the mass-scale adoption of wearables. These alternatives often serve more niche or clinical applications, such as drug delivery, wound care, or skin hydration diagnostics.
Insights into the Sensor Type segment Dominating the Demand

Skin Sensors Market By Sensor

By Sensor Type Value Share % 2025
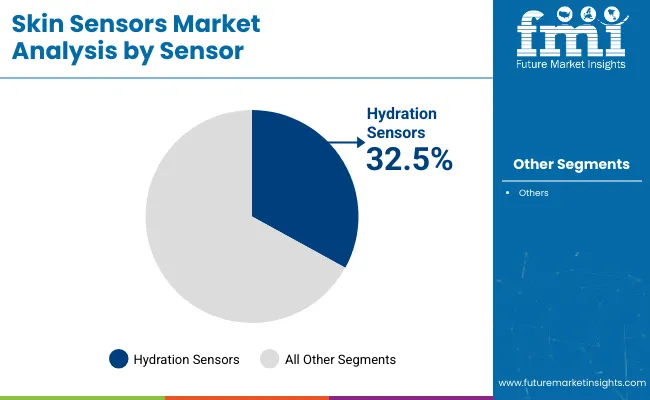
Hydration Sensors 32.5%
Others 67.5%

In 2025, hydration sensors are projected to command a 32.5% share of the global skin sensors market by sensor type, marking them as the leading subcategory. Their dominance reflects growing demand for precise, real-time monitoring of skin moisture levels in both healthcare and cosmetic applications.

These sensors have been increasingly integrated into skincare diagnostics, fitness monitoring, and even clinical tools for tracking dehydration in vulnerable populations, including the elderly and athletes. Their non-invasive design and compatibility with wearable formats have further propelled adoption.

The remaining 67.5% encompasses strain and motion sensors, temperature sensors, and electrochemical sensors, each contributing to specialized use cases. Although collectively larger in value share, these sensors are more fragmented in deployment across therapeutic, wellness, and performance domains. Innovations in electrochemical and temperature sensors, particularly for chronic disease management and smart patches, are gradually reshaping market dynamics.
Insights into the Application Segment with Focus on Health monitoring

Skin Sensors Market By Application

By Application Value Share % 2025
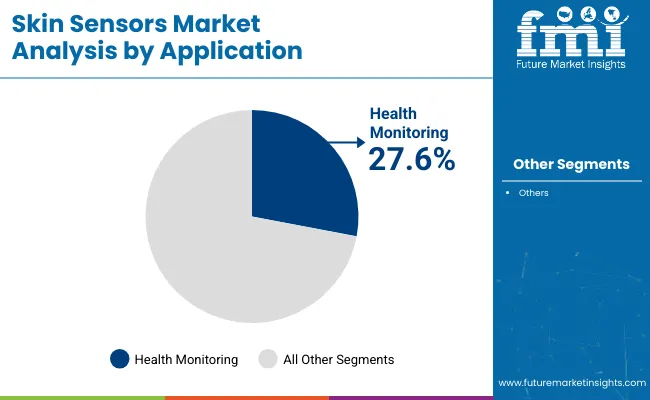
Health Monitoring 27.6%
Others 72.4%

In 2025, health monitoring is estimated to account for 27.6% of the global skin sensors market by application, establishing it as the largest individual segment within a highly diversified landscape. This substantial share reflects the growing prioritization of non-invasive, real-time physiological data in clinical and consumer settings.

Skin sensors are increasingly being adopted to track vital parameters such as hydration levels, temperature fluctuations, stress indicators, and skin impedanceall of which offer early detection of health anomalies. Their seamless integration into wearable formats enhances patient comfort, enabling continuous remote monitoring and reducing hospital visits.

What are the Drivers, Restraints, and Key Trends of the Skin Sensors Market?

Rising Demand for Continuous and Non-Invasive Health Monitoring

The growing prevalence of chronic health conditions and the need for continuous physiological monitoring have significantly accelerated the adoption of skin sensors. These sensors offer real-time, non-invasive tracking of parameters such as hydration, glucose levels, skin temperature, and stress biomarkers.

Traditional health monitoring techniques often require bulky equipment or invasive procedures, creating discomfort and limiting patient compliance. In contrast, skin sensors embedded in wearable patches or flexible materials provide continuous data without disrupting daily life. This demand is further amplified by the aging population and the rise in at-home healthcare solutions.

The integration of skin sensors with smartphones and cloud-based analytics is enhancing their role in early diagnosis, personalized medicine, and preventive care strategies. Healthcare providers and insurers are also showing increased interest, as these devices can potentially reduce hospital admissions and treatment costs through early intervention and patient-centric disease management.

Advancements in Flexible Electronics and Sensor MiniaturizationRapid innovations in nanomaterials, microelectronics, and flexible substrates have revolutionized the design and functionality of skin sensors. The miniaturization of sensor components has allowed manufacturers to develop ultra-thin, stretchable, and breathable devices that seamlessly conform to the skin’s surface.

These developments have enhanced sensor accuracy, comfort, and durability, expanding their usability across both clinical and consumer applications. The emergence of hybrid materials such as graphene-based composites and bio-compatible polymers has further improved sensor sensitivity and longevity. Additionally, the integration of wireless communication technologiessuch as Bluetooth and NFCenables remote data transmission to digital health platforms, enhancing the utility of these sensors in telemedicine and connected health ecosystems.

This technological evolution has not only reduced development costs but also opened new market opportunities in fitness, dermatology, neonatal care, and occupational safety, where real-time biometric feedback is increasingly valued for both diagnostics and performance optimization.

Data Privacy and Regulatory Compliance ChallengesOne of the primary restraints hindering the widespread deployment of skin sensors lies in navigating stringent data privacy regulations and complex medical device approval pathways. As skin sensors capture sensitive biometric data, their compliance with privacy frameworks such as GDPR (Europe) and HIPAA (United States) becomes critical.

Any perceived compromise in user privacy or device security could deter adoption, especially in healthcare settings. Additionally, regulatory clearance from agencies like the FDA or EMA often requires rigorous clinical validation, particularly for sensors classified as medical-grade. This regulatory burden can lengthen time-to-market and increase development costs.

Small and mid-sized startups frequently face resource constraints in aligning their product pipelines with dynamic regional regulations, delaying commercial launch. Furthermore, interoperability issues with electronic health records (EHRs) and a lack of standardized communication protocols often restrict seamless data integration, limiting the clinical utility of these devices in formal healthcare workflows.

Convergence of Skin Sensors with AI-Driven Wellness PlatformsA notable trend reshaping the skin sensors market is the integration of sensor-generated data with artificial intelligence (AI) and machine learning platforms for predictive health insights. The fusion of real-time biometric monitoring with cloud-based analytics allows for dynamic interpretation of patterns in hydration, stress, sleep quality, and metabolic health.

This convergence is especially visible in consumer wellness ecosystems, where brands are leveraging skin sensors not just for raw data collection, but for delivering personalized feedback through mobile apps and dashboards. AI algorithms trained on aggregated user data are being used to offer customized skincare routines, hydration alerts, and activity recommendations.

In clinical settings, predictive algorithms are beginning to assist in early diagnosis of conditions like diabetic ulcers or dehydration-induced complications. The growing focus on preventative healthcare and biofeedback is driving this trend, as consumers seek data-informed decisions for everyday well-being without clinical intervention.
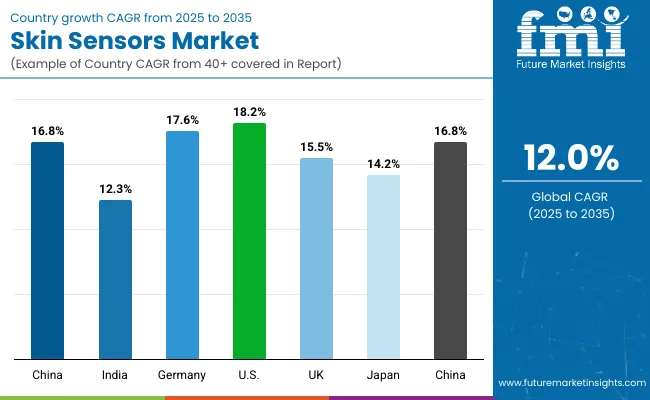
Analysis of Skin Sensors Market By Key Countries

Skin Sensors Market By Country

Countries CAGR
China 16.8%
India 12.3%
Germany 17.6%
USA 18.2%
UK 15.5%
Japan 14.2%

Asia-Pacific emerges as a high-growth zone in the skin sensors market, anchored by China at 16.8% CAGR and India at 12.3%. Growth in China is powered by a digitally connected consumer base, expanding medical device infrastructure, and AI-led investments in wearable health technologies.

Government focus on personalized healthcare and remote diagnostics has catalyzed adoption in both urban wellness platforms and rural health outreach programs. India’s growth is shaped by rising health awareness, proliferation of telehealth, and cost-accessible sensor integration in dermatology and fitness wearables.

Europe maintains momentum, led by Germany at 17.6% and the UK at 15.5%. The region benefits from strong clinical trials activity, regulatory emphasis on early diagnosis, and integration of skin sensors in aesthetic, geriatric, and chronic condition management. Germany’s edge lies in clinical-grade hydration and pH monitoring solutions, while the UK sees traction in wellness-focused consumer wearables.

North America remains the largest but more saturated market, with the USA at 18.2% CAGR. Growth is shaped by personalized medicine platforms, chronic disease monitoring, and insurance-backed digital therapeutics. Japan’s steady 14.2% reflects demand in eldercare robotics and minimally invasive diagnostics.

Sales Outlook for Skin Sensors in the United States

Year USA Skin Sensors Market
2025 621.27
2026 700.37
2027 789.53
2028 890.05
2029 1003.37
2030 1131.11
2031 1275.11
2032 1437.45
2033 1620.45
2034 1826.75
2035 2059.32

The USA skin sensors market is poised for consistent double-digit growth, expanding from USD 621.3 million in 2025 to USD 2,059.3 million by 2035. This nearly 3.3x increase reflects a robust CAGR driven by growing adoption of personalized health monitoring, integration of skin sensors in smart wearables, and widespread application in chronic disease management and wellness tracking.

The acceleration from 2029 onward signals heightened convergence of skin sensor technology with AI, telemedicine platforms, and insurance-backed digital health ecosystems, reinforcing the USA as a global innovation hub in non-invasive diagnostics.

Growth and Expansion Outlook for Skin Sensors Market in the United Kingdom

The Skin Sensors Market in the United Kingdom is projected to grow at a CAGR of 15.5% from 2025 to 2035, driven by increasing integration of wearable sensors in health monitoring, fitness, and personalized wellness solutions. The country’s strong digital healthcare infrastructure and its focus on proactive patient engagement have accelerated the adoption of skin-interfaced biosensors.

Regulatory encouragement for remote health diagnostics and continuous physiological tracking has enabled companies to roll out skin sensor-integrated platforms across hospitals, clinics, and consumer wellness segments. The aging population, coupled with rising consumer interest in biofeedback and wellness data, is further contributing to market momentum. Collaborations between medtech companies, universities, and public health bodies are ensuring rapid prototyping, trials, and commercial scaling of next-generation wearable biosensors.

  • Healthcare providers are integrating skin sensors into chronic disease management platforms for continuous at-home patient monitoring.
  • Research institutions are collaborating with private firms to develop skin-interfaced sensors for early detection of hydration loss and thermal stress.
  • Fitness and wellness brands are embedding skin sensors into wearables for real-time biofeedback on stress, sweat, and metabolic activity.

Growth and Expansion Outlook for Skin Sensors Market in Germany

The Skin Sensors Market in Germany is anticipated to register a CAGR of 17.6% from 2025 to 2035, underpinned by the country’s strategic focus on digital healthcare, preventive medicine, and wearable biosensor innovation. Skin-interfaced diagnostic tools are being widely adopted in outpatient monitoring, geriatric care, and sports science applications.

Germany’s engineering-driven R&D ecosystem, coupled with high healthcare spending, is fostering extensive collaborations between medtech firms, academic hospitals, and federal health agencies. Industrial firms are also exploring skin sensors for occupational health tracking and workforce safety. Government investments in telehealth infrastructure and personalized diagnostics are ensuring smoother clinical validation and integration of emerging sensor technologies.

  • Hospitals and elderly care facilities are deploying skin sensors to track dehydration, wound healing, and skin temperature changes.
  • University spin-offs and biomedical labs are innovating sensor patches for continuous glucose monitoring and electrolyte balance.
  • Industrial companies are trialing wearable sensors for real-time health tracking in manufacturing and construction workers.

Sales Outlook for Skin Sensors in China

The Skin Sensors Market in China is expected to grow at a CAGR of 16.8%, ranking among the fastest-expanding markets globally. This momentum is being sustained by increasing integration of sensor technologies across beauty-tech, wellness, and remote healthcare ecosystems. The uptake of skin hydration, pH, and sweat monitoring sensors has gained strong traction in urban health centers, cosmetic clinics, and personal wellness routines.

Competitive innovation by local electronics and medtech firms is fostering mass production of flexible, cost-efficient sensor patches and wearables. These developments are being supported by China’s healthcare digitization strategies, which emphasize remote diagnostics and aging population care. Personalized skincare solutions, smartphone-synced sensor devices, and community-level diagnostics are contributing to long-term growth.

  • Health-tech digitization programs are enabling widespread adoption of skin sensors in hospitals and elderly care.
  • Beauty-tech and wellness applications are fueling demand for hydration, pH, and microfluidicsensors.
  • Cost-effective manufacturing by domestic players is expanding accessibility across urban and mid-tier markets.

In-depth Analysis of Skin Sensors in Japan

Countries 2025
China 16.6%
India 7.5%
Germany 17.2%
USA 24.6%
UK 12.3%
Japan 10.5%
Countries 2035
China 17.5%
India 5.5%
Germany 17.8%
USA 26.2%
UK 11.4%
Japan 9.6%

The Skin Sensors Market in Japan is projected to grow at a CAGR of 9.6%, reflecting the slowest pace among major economies. Despite its advanced healthcare infrastructure, market momentum is being constrained by demographic saturation, conservative consumer adoption, and limited startup-scale innovation.

While applications in anti-aging skincare and dermatological diagnostics exist, they remain confined to niche, high-income consumer segments. Enterprise deployment of skin sensors for workplace wellness and stress monitoring has seen modest uptake, mostly in urban corporate hubs.

The broader aging population is not fully integrating sensor-based skincare into routine care, limiting volume expansion. Domestic electronics players are gradually entering the space with wellness wearables, yet cost sensitivity and rigid consumer preferences continue to restrict market breadth.

  • Anti-aging and dermatology applications remain limited to high-income niche markets.
  • Enterprise health programs use skin sensors for stress monitoring and hydration tracking.
  • Sluggish mass-market adoption is being influenced by aging demographics and pricing inertia.

Growth Outlook for Skin Sensors Market in China

China By Application Value Share % 2025
Skincare Monitoring 40.1%
Others 59.9%

The Skin Sensors Market in China is projected to witness sustained momentum through 2035, underpinned by a strong ecosystem of health-tech innovation, growing skincare awareness, and digital wellness adoption. In 2025, Skincare Monitoring accounts for a 40.1% share of the market, marking a robust foothold in consumer-facing applications.

As skin health becomes increasingly intertwined with lifestyle optimization, skin hydration sensors, UV sensors, and real-time biomarker detection are being adopted in premium skincare routines. Market in Japan holds share of 16.6% in 2025 in the global market.

Opportunity Analysis of USA Skin Sensors Market

USA By Product Type Value Share % 2025
Wearable Skin Sensors 33.2%
Others 66.8%

The Skin Sensors Market in the USA is undergoing rapid technological transformation, with Wearable Skin Sensors capturing a significant 33.2% share in 2025. This momentum stems from a convergence of digital health monitoring, telemedicine integration, and personalized wellness trends. Wearables embedded with skin hydration, temperature, and UV sensors are being adopted in preventive health management, athletic performance tracking, and remote patient monitoring.

The growing incidence of lifestyle disorders and the surge in virtual care models are fueling demand for non-invasive, continuous skin-based diagnostics. Hospitals, insurers, and digital therapeutics platforms are exploring reimbursement models for wearable patches, encouraging commercialization.

Innovation in flexible electronics and sensor-skin interface materials is lowering cost barriers, while FDA regulatory support is boosting clinical-grade product approvals. Additionally, the USA remains a hub for biotech and AI startups developing machine learning models to interpret sensor data in real time.
  • Wearable skin sensors account for 33.2% of the USA market in 2025, anchored in consumer and clinical adoption.
  • Clinical-grade patches and biosensor films dominate the 'Others' segment with 66.8% share.
  • Rising virtual healthcare and chronic condition monitoring are expected to widen opportunity scope

Competitive Landscape of Skin Sensors Market

Skin Sensors Market Analysis By Company

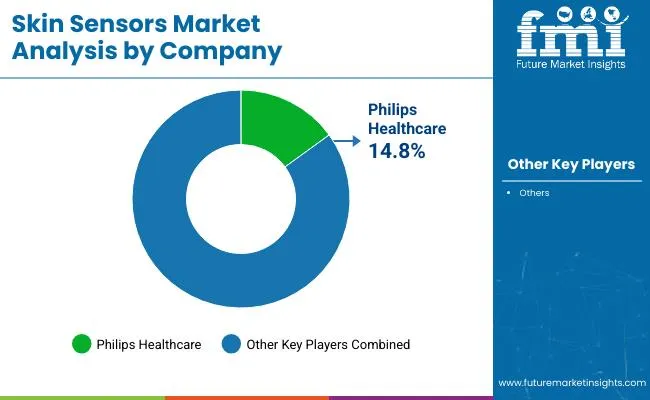
The competitive landscape of the global skin sensors market in 2025 is notably fragmented, with Philips Healthcare holding a 14.8% global value share. Philips' dominant share is attributed to its integration of skin sensors within broader health monitoring systems, enabling real-time diagnostics and connected care across clinical and at-home settings. Its leadership in chronic disease management, particularly cardiovascular and dermatological monitoring, has been fortified by regulatory-backed products and widespread hospital adoption.

In contrast, the fragmented majority reflects the diversity of use cases and the emergence of specialized players focused on hydration tracking, UV detection, sweat analysis, and personalized skincare. Many of these firms are leveraging advances in microfluidics, flexible substrates, and AI-based signal interpretation to differentiate offerings. Consumer technology companies are also entering the segment via wearables and smartwatches with embedded skin diagnostics.

Strategic partnerships with research institutions, dermatology clinics, and digital health platforms are being actively pursued to accelerate market penetration. While Philips maintains a broad clinical footprint, the growth trajectory of smaller firms suggests increasing competition over the next decade, particularly in wellness-driven and non-clinical sensor applications.

Key Developments in Skin Sensors Market

  • In 2025, Philips enhanced its remote patient monitoring (RPM) suite by incorporating advanced hydration and sweat-sensing capabilities into its connected care devices. These sensors enable real-time skin health tracking, especially for post-surgical and geriatric patients. This expansion aligns with the increasing global push for decentralized care and telehealth-based diagnostics.
  • In 2024, MC10 extended its collaboration with the USA Department of Defense to trial skin sensor patches for tracking soldier stress, hydration, and UV exposure in combat zones. The technology is built on stretchable electronics and reflects rising interest in skin-integrated sensors for extreme environments.

Scope of the Report

Item Value
Quantitative Units USD 2,525.5 Million
Product Type Wearable Skin Sensors, Electronic Skin Patches, Flexible/Bendable Sensors
Sensor Type Hydration Sensors, Strain & Motion Sensors, Temperature Sensors, Electrochemical Sensors
Application Health Monitoring, Sports & Fitness Monitoring, Cosmetic & Skin Wellness, Wound Healing Monitoring
Technology Stretchable Electronics, MEMS/NEMS-Based Sensors, Wireless-Enabled Sensors
Regions Covered North America, Europe, Asia-Pacific, Latin America, Middle East & Africa
Country Covered United States, Canada, Germany, France, Unite d Kingdom, China, Japan, India, South Africa
Key Companies Profiled MC10 Inc. (Dassault Systèmes), Epicore Biosystems, Xsensio SA, iRhythm Technologies Inc., BioIntelliSense, GraphWear Technologies Inc., Gentag Inc., Philips Healthcare, Wearifi Inc., VivaLNK Inc.
Additional Attributes Global dollar sales by product type and sensor type, penetration of skin-interfacing biosensors in medical and wellness applications, innovation trends in flexible and stretchable electronics, integration with wearable and wireless platforms, rising adoption in continuous health and hydration monitoring, demand surge across cosmetic and dermatological applications, country-wise regulatory evolution for wearable medical devices, R&D investment in biocompatible and reusable sensor materials, expansion of skin sensor usage in remote patient monitoring and digital health, and emergence of AI-enabled skin analytics and smart patches.

Key Segments

By Product Type:

  • Wearable
  • Electronic Skin Patches
  • Flexible/Bendable Sensors

By Sensor Type:

  • Hydration Sensors
  • Strain & Motion Sensors
  • Temperature Sensors
  • Electrochemical Sensors

By Application:

  • Health Monitoring
  • Sports & Fitness Monitoring
  • Cosmetic & Skin Wellness
  • Wound Healing Monitoring

By Technology:

  • Stretchable Electronics
  • MEMS/NEMS-Based Sensors
  • Wireless-Enabled Sensors

By Region:

  • North America
  • Latin America
  • Europe
  • East Asia
  • South Asia & Pacific
  • Middle East and Africa

Table of Content

  1. Executive Summary
    • Global Market Outlook
    • Demand-side Trends
    • Supply-side Trends
    • Technology Roadmap Analysis
    • Analysis and Recommendations
  2. Market Overview
    • Market Coverage / Taxonomy
    • Market Definition / Scope / Limitations
  3. Market Background
    • Market Dynamics
      • Drivers
      • Restraints
      • Opportunity
      • Trends
    • Scenario Forecast
      • Demand in Optimistic Scenario
      • Demand in Likely Scenario
      • Demand in Conservative Scenario
    • Opportunity Map Analysis
    • Product Life Cycle Analysis
    • Supply Chain Analysis
      • Supply Side Participants and their Roles
        • Producers
        • Mid-Level Participants (Traders/ Agents/ Brokers)
        • Wholesalers and Distributors
      • Value Added and Value Created at Node in the Supply Chain
      • List of Raw Material Suppliers
      • List of Existing and Potential Buyer’s
    • Investment Feasibility Matrix
    • Value Chain Analysis
      • Profit Margin Analysis
      • Wholesalers and Distributors
      • Retailers
    • PESTLE and Porter’s Analysis
    • Regulatory Landscape
      • By Key Regions
      • By Key Countries
    • Regional Parent Market Outlook
    • Production and Consumption Statistics
    • Import and Export Statistics
  4. Global Market Analysis 2020 to 2024 and Forecast, 2025 to 2035
    • Historical Market Size Value (USD Million) & Volume (Units) Analysis, 2020 to 2024
    • Current and Future Market Size Value (USD Million) & Volume (Units) Projections, 2025 to 2035
      • Y-o-Y Growth Trend Analysis
      • Absolute $ Opportunity Analysis
  5. Global Market Analysis 2020 to 2024 and Forecast 2025 to 2035, By Product Type
    • Introduction / Key Findings
    • Historical Market Size Value (USD Million) & Volume (Units) Analysis By Product Type, 2020 to 2024
    • Current and Future Market Size Value (USD Million) & Volume (Units) Analysis and Forecast By Product Type, 2025 to 2035
      • Wearable
      • Electronic Skin Patches
      • Flexible/Bendable Sensors
    • Y-o-Y Growth Trend Analysis By Product Type, 2020 to 2024
    • Absolute $ Opportunity Analysis By Product Type, 2025 to 2035
  6. Global Market Analysis 2020 to 2024 and Forecast 2025 to 2035, By Sensor Type
    • Introduction / Key Findings
    • Historical Market Size Value (USD Million) & Volume (Units) Analysis By Sensor Type, 2020 to 2024
    • Current and Future Market Size Value (USD Million) & Volume (Units) Analysis and Forecast By Sensor Type, 2025 to 2035
      • Hydration Sensors
      • Strain & Motion Sensors
      • Temperature Sensors
      • Electrochemical Sensors
    • Y-o-Y Growth Trend Analysis By Sensor Type, 2020 to 2024
    • Absolute $ Opportunity Analysis By Sensor Type, 2025 to 2035
  7. Global Market Analysis 2020 to 2024 and Forecast 2025 to 2035, By Application
    • Introduction / Key Findings
    • Historical Market Size Value (USD Million) & Volume (Units) Analysis By Application, 2020 to 2024
    • Current and Future Market Size Value (USD Million) & Volume (Units) Analysis and Forecast By Application, 2025 to 2035
      • Health Monitoring
      • Sports & Fitness Monitoring
      • Cosmetic & Skin Wellness
      • Wound Healing Monitoring
    • Y-o-Y Growth Trend Analysis By Application, 2020 to 2024
    • Absolute $ Opportunity Analysis By Application, 2025 to 2035
  8. Global Market Analysis 2020 to 2024 and Forecast 2025 to 2035, By Technology
    • Introduction / Key Findings
    • Historical Market Size Value (USD Million) & Volume (Units) Analysis By Technology, 2020 to 2024
    • Current and Future Market Size Value (USD Million) & Volume (Units) Analysis and Forecast By Technology, 2025 to 2035
      • Stretchable Electronics
      • MEMS/NEMS-Based Sensors
      • Wireless-Enabled Sensors
    • Y-o-Y Growth Trend Analysis By Technology, 2020 to 2024
    • Absolute $ Opportunity Analysis By Technology, 2025 to 2035
  9. Global Market Analysis 2020 to 2024 and Forecast 2025 to 2035, By Region
    • Introduction
    • Historical Market Size Value (USD Million) & Volume (Units) Analysis By Region, 2020 to 2024
    • Current Market Size Value (USD Million) & Volume (Units) Analysis and Forecast By Region, 2025 to 2035
      • North America
      • Latin America
      • Europe
      • East Asia
      • South Asia & Pacific
      • Middle East and Africa
    • Market Attractiveness Analysis By Region
  10. North America Market Analysis 2020 to 2024 and Forecast 2025 to 2035, By Country
    • Historical Market Size Value (USD Million) & Volume (Units) Trend Analysis By Market Taxonomy, 2020 to 2024
    • Market Size Value (USD Million) & Volume (Units) Forecast By Market Taxonomy, 2025 to 2035
      • By Country
        • USA
        • Canada
      • By Product Type
      • By Sensor Type
      • By Application
      • By Technology
    • Market Attractiveness Analysis
      • By Country
      • By Product Type
      • By Sensor Type
      • By Application
      • By Technology
    • Key Takeaways
  11. Latin America Market Analysis 2020 to 2024 and Forecast 2025 to 2035, By Country
    • Historical Market Size Value (USD Million) & Volume (Units) Trend Analysis By Market Taxonomy, 2020 to 2024
    • Market Size Value (USD Million) & Volume (Units) Forecast By Market Taxonomy, 2025 to 2035
      • By Country
        • Brazil
        • Mexico
        • Colombia
        • Rest of Latin America
      • By Product Type
      • By Sensor Type
      • By Application
      • By Technology
    • Market Attractiveness Analysis
      • By Country
      • By Product Type
      • By Sensor Type
      • By Application
      • By Technology
    • Key Takeaways
  12. Europe Market Analysis 2020 to 2024 and Forecast 2025 to 2035, By Country
    • Historical Market Size Value (USD Million) & Volume (Units) Trend Analysis By Market Taxonomy, 2020 to 2024
    • Market Size Value (USD Million) & Volume (Units) Forecast By Market Taxonomy, 2025 to 2035
      • By Country
        • Germany
        • UK
        • France
        • Italy
        • Spain
        • Belgium
        • Netherlands
        • Nordic
        • Switzerland
        • Russia
        • Poland
        • Rest of Europe
      • By Product Type
      • By Sensor Type
      • By Application
      • By Technology
    • Market Attractiveness Analysis
      • By Country
      • By Product Type
      • By Sensor Type
      • By Application
      • By Technology
    • Key Takeaways
  13. East Asia Market Analysis 2020 to 2024 and Forecast 2025 to 2035, By Country
    • Historical Market Size Value (USD Million) & Volume (Units) Trend Analysis By Market Taxonomy, 2020 to 2024
    • Market Size Value (USD Million) & Volume (Units) Forecast By Market Taxonomy, 2025 to 2035
      • By Country
        • China
        • Japan
        • South Korea
      • By Product Type
      • By Sensor Type
      • By Application
      • By Technology
    • Market Attractiveness Analysis
      • By Country
      • By Product Type
      • By Sensor Type
      • By Application
      • By Technology
    • Key Takeaways
  14. South Asia & Pacific Market Analysis 2020 to 2024 and Forecast 2025 to 2035, By Country
    • Historical Market Size Value (USD Million) & Volume (Units) Trend Analysis By Market Taxonomy, 2020 to 2024
    • Market Size Value (USD Million) & Volume (Units) Forecast By Market Taxonomy, 2025 to 2035
      • By Country
        • India
        • Thailand
        • Malaysia
        • Indonesia
        • Singapore
        • Vietnam
        • Australia
        • New Zealand
        • Rest of South Asia
      • By Product Type
      • By Sensor Type
      • By Application
      • By Technology
    • Market Attractiveness Analysis
      • By Country
      • By Product Type
      • By Sensor Type
      • By Application
      • By Technology
    • Key Takeaways
  15. Middle East and Africa Market Analysis 2020 to 2024 and Forecast 2025 to 2035, By Country
    • Historical Market Size Value (USD Million) & Volume (Units) Trend Analysis By Market Taxonomy, 2020 to 2024
    • Market Size Value (USD Million) & Volume (Units) Forecast By Market Taxonomy, 2025 to 2035
      • By Country
        • Turkey
        • UAE
        • Saudi Arabia
        • Israel
        • Other GCC Countries
        • North Africa
        • South Africa
      • By Product Type
      • By Sensor Type
      • By Application
      • By Technology
    • Market Attractiveness Analysis
      • By Country
      • By Product Type
      • By Sensor Type
      • By Application
      • By Technology
    • Key Takeaways
  16. Key Countries Market Analysis
    • USA
      • Pricing Analysis
      • Market Share Analysis, 2024
        • By Product Type
        • By Sensor Type
        • By Application
        • By Technology
    • Canada
      • Pricing Analysis
      • Market Share Analysis, 2024
        • By Product Type
        • By Sensor Type
        • By Application
        • By Technology
    • Brazil
      • Pricing Analysis
      • Market Share Analysis, 2024
        • By Product Type
        • By Sensor Type
        • By Application
        • By Technology
    • Mexico
      • Pricing Analysis
      • Market Share Analysis, 2024
        • By Product Type
        • By Sensor Type
        • By Application
        • By Technology
    • Colombia
      • Pricing Analysis
      • Market Share Analysis, 2024
        • By Product Type
        • By Sensor Type
        • By Application
        • By Technology
    • Germany
      • Pricing Analysis
      • Market Share Analysis, 2024
        • By Product Type
        • By Sensor Type
        • By Application
        • By Technology
    • UK
      • Pricing Analysis
      • Market Share Analysis, 2024
        • By Product Type
        • By Sensor Type
        • By Application
        • By Technology
    • France
      • Pricing Analysis
      • Market Share Analysis, 2024
        • By Product Type
        • By Sensor Type
        • By Application
        • By Technology
    • Italy
      • Pricing Analysis
      • Market Share Analysis, 2024
        • By Product Type
        • By Sensor Type
        • By Application
        • By Technology
    • Spain
      • Pricing Analysis
      • Market Share Analysis, 2024
        • By Product Type
        • By Sensor Type
        • By Application
        • By Technology
    • Belgium
      • Pricing Analysis
      • Market Share Analysis, 2024
        • By Product Type
        • By Sensor Type
        • By Application
        • By Technology
    • Netherlands
      • Pricing Analysis
      • Market Share Analysis, 2024
        • By Product Type
        • By Sensor Type
        • By Application
        • By Technology
    • Nordic
      • Pricing Analysis
      • Market Share Analysis, 2024
        • By Product Type
        • By Sensor Type
        • By Application
        • By Technology
    • Switzerland
      • Pricing Analysis
      • Market Share Analysis, 2024
        • By Product Type
        • By Sensor Type
        • By Application
        • By Technology
    • Russia
      • Pricing Analysis
      • Market Share Analysis, 2024
        • By Product Type
        • By Sensor Type
        • By Application
        • By Technology
    • Poland
      • Pricing Analysis
      • Market Share Analysis, 2024
        • By Product Type
        • By Sensor Type
        • By Application
        • By Technology
    • China
      • Pricing Analysis
      • Market Share Analysis, 2024
        • By Product Type
        • By Sensor Type
        • By Application
        • By Technology
    • Japan
      • Pricing Analysis
      • Market Share Analysis, 2024
        • By Product Type
        • By Sensor Type
        • By Application
        • By Technology
    • South Korea
      • Pricing Analysis
      • Market Share Analysis, 2024
        • By Product Type
        • By Sensor Type
        • By Application
        • By Technology
    • India
      • Pricing Analysis
      • Market Share Analysis, 2024
        • By Product Type
        • By Sensor Type
        • By Application
        • By Technology
    • Thailand
      • Pricing Analysis
      • Market Share Analysis, 2024
        • By Product Type
        • By Sensor Type
        • By Application
        • By Technology
    • Indonesia
      • Pricing Analysis
      • Market Share Analysis, 2024
        • By Product Type
        • By Sensor Type
        • By Application
        • By Technology
    • Australia
      • Pricing Analysis
      • Market Share Analysis, 2024
        • By Product Type
        • By Sensor Type
        • By Application
        • By Technology
    • New Zealand
      • Pricing Analysis
      • Market Share Analysis, 2024
        • By Product Type
        • By Sensor Type
        • By Application
        • By Technology
    • Turkey
      • Pricing Analysis
      • Market Share Analysis, 2024
        • By Product Type
        • By Sensor Type
        • By Application
        • By Technology
    • UAE
      • Pricing Analysis
      • Market Share Analysis, 2024
        • By Product Type
        • By Sensor Type
        • By Application
        • By Technology
    • Saudi Arabia
      • Pricing Analysis
      • Market Share Analysis, 2024
        • By Product Type
        • By Sensor Type
        • By Application
        • By Technology
    • Israel
      • Pricing Analysis
      • Market Share Analysis, 2024
        • By Product Type
        • By Sensor Type
        • By Application
        • By Technology
    • North Africa
      • Pricing Analysis
      • Market Share Analysis, 2024
        • By Product Type
        • By Sensor Type
        • By Application
        • By Technology
    • South Africa
      • Pricing Analysis
      • Market Share Analysis, 2024
        • By Product Type
        • By Sensor Type
        • By Application
        • By Technology
  17. Market Structure Analysis
    • Competition Dashboard
    • Competition Benchmarking
    • Market Share Analysis of Top Players
      • By Regional
      • By Product Type
      • By Sensor Type
      • By Application
      • By Technology
  18. Competition Analysis
    • Competition Deep Dive
      • MC10 Inc. (Dassault Systèmes)
        • Overview
        • Product Portfolio
        • Profitability by Market Segments (Product/Age /Sales Channel/Region)
        • Sales Footprint
        • Strategy Overview
          • Marketing Strategy
          • Product Strategy
          • Channel Strategy
      • Epicore Biosystems
        • Overview
        • Product Portfolio
        • Profitability by Market Segments (Product/Age /Sales Channel/Region)
        • Sales Footprint
        • Strategy Overview
          • Marketing Strategy
          • Product Strategy
          • Channel Strategy
      • Xsensio SA
        • Overview
        • Product Portfolio
        • Profitability by Market Segments (Product/Age /Sales Channel/Region)
        • Sales Footprint
        • Strategy Overview
          • Marketing Strategy
          • Product Strategy
          • Channel Strategy
      • iRhythm Technologies Inc.
        • Overview
        • Product Portfolio
        • Profitability by Market Segments (Product/Age /Sales Channel/Region)
        • Sales Footprint
        • Strategy Overview
          • Marketing Strategy
          • Product Strategy
          • Channel Strategy
      • BioIntelliSense
        • Overview
        • Product Portfolio
        • Profitability by Market Segments (Product/Age /Sales Channel/Region)
        • Sales Footprint
        • Strategy Overview
          • Marketing Strategy
          • Product Strategy
          • Channel Strategy
      • GraphWear Technologies Inc.
        • Overview
        • Product Portfolio
        • Profitability by Market Segments (Product/Age /Sales Channel/Region)
        • Sales Footprint
        • Strategy Overview
          • Marketing Strategy
          • Product Strategy
          • Channel Strategy
      • Gentag Inc.
        • Overview
        • Product Portfolio
        • Profitability by Market Segments (Product/Age /Sales Channel/Region)
        • Sales Footprint
        • Strategy Overview
          • Marketing Strategy
          • Product Strategy
          • Channel Strategy
      • Philips Healthcare
        • Overview
        • Product Portfolio
        • Profitability by Market Segments (Product/Age /Sales Channel/Region)
        • Sales Footprint
        • Strategy Overview
          • Marketing Strategy
          • Product Strategy
          • Channel Strategy
      • Wearifi Inc.
        • Overview
        • Product Portfolio
        • Profitability by Market Segments (Product/Age /Sales Channel/Region)
        • Sales Footprint
        • Strategy Overview
          • Marketing Strategy
          • Product Strategy
          • Channel Strategy
      • VivaLNK Inc.
        • Overview
        • Product Portfolio
        • Profitability by Market Segments (Product/Age /Sales Channel/Region)
        • Sales Footprint
        • Strategy Overview
          • Marketing Strategy
          • Product Strategy
          • Channel Strategy
      • Others
        • Overview
        • Product Portfolio
        • Profitability by Market Segments (Product/Age /Sales Channel/Region)
        • Sales Footprint
        • Strategy Overview
          • Marketing Strategy
          • Product Strategy
          • Channel Strategy
  19. Assumptions & Acronyms Used
  20. Research Methodology

List of Tables

  • Table 1: Global Market Value (USD Million) Forecast by Region, 2020-2035
  • Table 2: Global Market Volume (Units) Forecast by Region, 2020-2035
  • Table 3: Global Market Value (USD Million) Forecast by Product Type, 2020-2035
  • Table 4: Global Market Volume (Units) Forecast by Product Type, 2020-2035
  • Table 5: Global Market Value (USD Million) Forecast by Sensor Type, 2020-2035
  • Table 6: Global Market Volume (Units) Forecast by Sensor Type, 2020-2035
  • Table 7: Global Market Value (USD Million) Forecast by Application, 2020-2035
  • Table 8: Global Market Volume (Units) Forecast by Application, 2020-2035
  • Table 9: Global Market Value (USD Million) Forecast by Technology, 2020-2035
  • Table 10: Global Market Volume (Units) Forecast by Technology, 2020-2035
  • Table 11: North America Market Value (USD Million) Forecast by Country, 2020-2035
  • Table 12: North America Market Volume (Units) Forecast by Country, 2020-2035
  • Table 13: North America Market Value (USD Million) Forecast by Product Type, 2020-2035
  • Table 14: North America Market Volume (Units) Forecast by Product Type, 2020-2035
  • Table 15: North America Market Value (USD Million) Forecast by Sensor Type, 2020-2035
  • Table 16: North America Market Volume (Units) Forecast by Sensor Type, 2020-2035
  • Table 17: North America Market Value (USD Million) Forecast by Application, 2020-2035
  • Table 18: North America Market Volume (Units) Forecast by Application, 2020-2035
  • Table 19: North America Market Value (USD Million) Forecast by Technology, 2020-2035
  • Table 20: North America Market Volume (Units) Forecast by Technology, 2020-2035
  • Table 21: Latin America Market Value (USD Million) Forecast by Country, 2020-2035
  • Table 22: Latin America Market Volume (Units) Forecast by Country, 2020-2035
  • Table 23: Latin America Market Value (USD Million) Forecast by Product Type, 2020-2035
  • Table 24: Latin America Market Volume (Units) Forecast by Product Type, 2020-2035
  • Table 25: Latin America Market Value (USD Million) Forecast by Sensor Type, 2020-2035
  • Table 26: Latin America Market Volume (Units) Forecast by Sensor Type, 2020-2035
  • Table 27: Latin America Market Value (USD Million) Forecast by Application, 2020-2035
  • Table 28: Latin America Market Volume (Units) Forecast by Application, 2020-2035
  • Table 29: Latin America Market Value (USD Million) Forecast by Technology, 2020-2035
  • Table 30: Latin America Market Volume (Units) Forecast by Technology, 2020-2035
  • Table 31: Europe Market Value (USD Million) Forecast by Country, 2020-2035
  • Table 32: Europe Market Volume (Units) Forecast by Country, 2020-2035
  • Table 33: Europe Market Value (USD Million) Forecast by Product Type, 2020-2035
  • Table 34: Europe Market Volume (Units) Forecast by Product Type, 2020-2035
  • Table 35: Europe Market Value (USD Million) Forecast by Sensor Type, 2020-2035
  • Table 36: Europe Market Volume (Units) Forecast by Sensor Type, 2020-2035
  • Table 37: Europe Market Value (USD Million) Forecast by Application, 2020-2035
  • Table 38: Europe Market Volume (Units) Forecast by Application, 2020-2035
  • Table 39: Europe Market Value (USD Million) Forecast by Technology, 2020-2035
  • Table 40: Europe Market Volume (Units) Forecast by Technology, 2020-2035
  • Table 41: East Asia Market Value (USD Million) Forecast by Country, 2020-2035
  • Table 42: East Asia Market Volume (Units) Forecast by Country, 2020-2035
  • Table 43: East Asia Market Value (USD Million) Forecast by Product Type, 2020-2035
  • Table 44: East Asia Market Volume (Units) Forecast by Product Type, 2020-2035
  • Table 45: East Asia Market Value (USD Million) Forecast by Sensor Type, 2020-2035
  • Table 46: East Asia Market Volume (Units) Forecast by Sensor Type, 2020-2035
  • Table 47: East Asia Market Value (USD Million) Forecast by Application, 2020-2035
  • Table 48: East Asia Market Volume (Units) Forecast by Application, 2020-2035
  • Table 49: East Asia Market Value (USD Million) Forecast by Technology, 2020-2035
  • Table 50: East Asia Market Volume (Units) Forecast by Technology, 2020-2035
  • Table 51: South Asia & Pacific Market Value (USD Million) Forecast by Country, 2020-2035
  • Table 52: South Asia & Pacific Market Volume (Units) Forecast by Country, 2020-2035
  • Table 53: South Asia & Pacific Market Value (USD Million) Forecast by Product Type, 2020-2035
  • Table 54: South Asia & Pacific Market Volume (Units) Forecast by Product Type, 2020-2035
  • Table 55: South Asia & Pacific Market Value (USD Million) Forecast by Sensor Type, 2020-2035
  • Table 56: South Asia & Pacific Market Volume (Units) Forecast by Sensor Type, 2020-2035
  • Table 57: South Asia & Pacific Market Value (USD Million) Forecast by Application, 2020-2035
  • Table 58: South Asia & Pacific Market Volume (Units) Forecast by Application, 2020-2035
  • Table 59: South Asia & Pacific Market Value (USD Million) Forecast by Technology, 2020-2035
  • Table 60: South Asia & Pacific Market Volume (Units) Forecast by Technology, 2020-2035
  • Table 61: Middle East and Africa Market Value (USD Million) Forecast by Country, 2020-2035
  • Table 62: Middle East and Africa Market Volume (Units) Forecast by Country, 2020-2035
  • Table 63: Middle East and Africa Market Value (USD Million) Forecast by Product Type, 2020-2035
  • Table 64: Middle East and Africa Market Volume (Units) Forecast by Product Type, 2020-2035
  • Table 65: Middle East and Africa Market Value (USD Million) Forecast by Sensor Type, 2020-2035
  • Table 66: Middle East and Africa Market Volume (Units) Forecast by Sensor Type, 2020-2035
  • Table 67: Middle East and Africa Market Value (USD Million) Forecast by Application, 2020-2035
  • Table 68: Middle East and Africa Market Volume (Units) Forecast by Application, 2020-2035
  • Table 69: Middle East and Africa Market Value (USD Million) Forecast by Technology, 2020-2035
  • Table 70: Middle East and Africa Market Volume (Units) Forecast by Technology, 2020-2035

List of Figures

  • Figure 1: Global Market Value (USD Million) by Product Type, 2025-2035
  • Figure 2: Global Market Value (USD Million) by Sensor Type, 2025-2035
  • Figure 3: Global Market Value (USD Million) by Application, 2025-2035
  • Figure 4: Global Market Value (USD Million) by Technology, 2025-2035
  • Figure 5: Global Market Value (USD Million) by Region, 2025-2035
  • Figure 6: Global Market Value (USD Million) Analysis by Region, 2020-2035
  • Figure 7: Global Market Volume (Units) Analysis by Region, 2020-2035
  • Figure 8: Global Market Value Share (%) and BPS Analysis by Region, 2025-2035
  • Figure 9: Global Market Y-o-Y Growth (%) Projections by Region, 2025-2035
  • Figure 10: Global Market Value (USD Million) Analysis by Product Type, 2020-2035
  • Figure 11: Global Market Volume (Units) Analysis by Product Type, 2020-2035
  • Figure 12: Global Market Value Share (%) and BPS Analysis by Product Type, 2025-2035
  • Figure 13: Global Market Y-o-Y Growth (%) Projections by Product Type, 2025-2035
  • Figure 14: Global Market Value (USD Million) Analysis by Sensor Type, 2020-2035
  • Figure 15: Global Market Volume (Units) Analysis by Sensor Type, 2020-2035
  • Figure 16: Global Market Value Share (%) and BPS Analysis by Sensor Type, 2025-2035
  • Figure 17: Global Market Y-o-Y Growth (%) Projections by Sensor Type, 2025-2035
  • Figure 18: Global Market Value (USD Million) Analysis by Application, 2020-2035
  • Figure 19: Global Market Volume (Units) Analysis by Application, 2020-2035
  • Figure 20: Global Market Value Share (%) and BPS Analysis by Application, 2025-2035
  • Figure 21: Global Market Y-o-Y Growth (%) Projections by Application, 2025-2035
  • Figure 22: Global Market Value (USD Million) Analysis by Technology, 2020-2035
  • Figure 23: Global Market Volume (Units) Analysis by Technology, 2020-2035
  • Figure 24: Global Market Value Share (%) and BPS Analysis by Technology, 2025-2035
  • Figure 25: Global Market Y-o-Y Growth (%) Projections by Technology, 2025-2035
  • Figure 26: Global Market Attractiveness by Product Type, 2025-2035
  • Figure 27: Global Market Attractiveness by Sensor Type, 2025-2035
  • Figure 28: Global Market Attractiveness by Application, 2025-2035
  • Figure 29: Global Market Attractiveness by Technology, 2025-2035
  • Figure 30: Global Market Attractiveness by Region, 2025-2035
  • Figure 31: North America Market Value (USD Million) by Product Type, 2025-2035
  • Figure 32: North America Market Value (USD Million) by Sensor Type, 2025-2035
  • Figure 33: North America Market Value (USD Million) by Application, 2025-2035
  • Figure 34: North America Market Value (USD Million) by Technology, 2025-2035
  • Figure 35: North America Market Value (USD Million) by Country, 2025-2035
  • Figure 36: North America Market Value (USD Million) Analysis by Country, 2020-2035
  • Figure 37: North America Market Volume (Units) Analysis by Country, 2020-2035
  • Figure 38: North America Market Value Share (%) and BPS Analysis by Country, 2025-2035
  • Figure 39: North America Market Y-o-Y Growth (%) Projections by Country, 2025-2035
  • Figure 40: North America Market Value (USD Million) Analysis by Product Type, 2020-2035
  • Figure 41: North America Market Volume (Units) Analysis by Product Type, 2020-2035
  • Figure 42: North America Market Value Share (%) and BPS Analysis by Product Type, 2025-2035
  • Figure 43: North America Market Y-o-Y Growth (%) Projections by Product Type, 2025-2035
  • Figure 44: North America Market Value (USD Million) Analysis by Sensor Type, 2020-2035
  • Figure 45: North America Market Volume (Units) Analysis by Sensor Type, 2020-2035
  • Figure 46: North America Market Value Share (%) and BPS Analysis by Sensor Type, 2025-2035
  • Figure 47: North America Market Y-o-Y Growth (%) Projections by Sensor Type, 2025-2035
  • Figure 48: North America Market Value (USD Million) Analysis by Application, 2020-2035
  • Figure 49: North America Market Volume (Units) Analysis by Application, 2020-2035
  • Figure 50: North America Market Value Share (%) and BPS Analysis by Application, 2025-2035
  • Figure 51: North America Market Y-o-Y Growth (%) Projections by Application, 2025-2035
  • Figure 52: North America Market Value (USD Million) Analysis by Technology, 2020-2035
  • Figure 53: North America Market Volume (Units) Analysis by Technology, 2020-2035
  • Figure 54: North America Market Value Share (%) and BPS Analysis by Technology, 2025-2035
  • Figure 55: North America Market Y-o-Y Growth (%) Projections by Technology, 2025-2035
  • Figure 56: North America Market Attractiveness by Product Type, 2025-2035
  • Figure 57: North America Market Attractiveness by Sensor Type, 2025-2035
  • Figure 58: North America Market Attractiveness by Application, 2025-2035
  • Figure 59: North America Market Attractiveness by Technology, 2025-2035
  • Figure 60: North America Market Attractiveness by Country, 2025-2035
  • Figure 61: Latin America Market Value (USD Million) by Product Type, 2025-2035
  • Figure 62: Latin America Market Value (USD Million) by Sensor Type, 2025-2035
  • Figure 63: Latin America Market Value (USD Million) by Application, 2025-2035
  • Figure 64: Latin America Market Value (USD Million) by Technology, 2025-2035
  • Figure 65: Latin America Market Value (USD Million) by Country, 2025-2035
  • Figure 66: Latin America Market Value (USD Million) Analysis by Country, 2020-2035
  • Figure 67: Latin America Market Volume (Units) Analysis by Country, 2020-2035
  • Figure 68: Latin America Market Value Share (%) and BPS Analysis by Country, 2025-2035
  • Figure 69: Latin America Market Y-o-Y Growth (%) Projections by Country, 2025-2035
  • Figure 70: Latin America Market Value (USD Million) Analysis by Product Type, 2020-2035
  • Figure 71: Latin America Market Volume (Units) Analysis by Product Type, 2020-2035
  • Figure 72: Latin America Market Value Share (%) and BPS Analysis by Product Type, 2025-2035
  • Figure 73: Latin America Market Y-o-Y Growth (%) Projections by Product Type, 2025-2035
  • Figure 74: Latin America Market Value (USD Million) Analysis by Sensor Type, 2020-2035
  • Figure 75: Latin America Market Volume (Units) Analysis by Sensor Type, 2020-2035
  • Figure 76: Latin America Market Value Share (%) and BPS Analysis by Sensor Type, 2025-2035
  • Figure 77: Latin America Market Y-o-Y Growth (%) Projections by Sensor Type, 2025-2035
  • Figure 78: Latin America Market Value (USD Million) Analysis by Application, 2020-2035
  • Figure 79: Latin America Market Volume (Units) Analysis by Application, 2020-2035
  • Figure 80: Latin America Market Value Share (%) and BPS Analysis by Application, 2025-2035
  • Figure 81: Latin America Market Y-o-Y Growth (%) Projections by Application, 2025-2035
  • Figure 82: Latin America Market Value (USD Million) Analysis by Technology, 2020-2035
  • Figure 83: Latin America Market Volume (Units) Analysis by Technology, 2020-2035
  • Figure 84: Latin America Market Value Share (%) and BPS Analysis by Technology, 2025-2035
  • Figure 85: Latin America Market Y-o-Y Growth (%) Projections by Technology, 2025-2035
  • Figure 86: Latin America Market Attractiveness by Product Type, 2025-2035
  • Figure 87: Latin America Market Attractiveness by Sensor Type, 2025-2035
  • Figure 88: Latin America Market Attractiveness by Application, 2025-2035
  • Figure 89: Latin America Market Attractiveness by Technology, 2025-2035
  • Figure 90: Latin America Market Attractiveness by Country, 2025-2035
  • Figure 91: Europe Market Value (USD Million) by Product Type, 2025-2035
  • Figure 92: Europe Market Value (USD Million) by Sensor Type, 2025-2035
  • Figure 93: Europe Market Value (USD Million) by Application, 2025-2035
  • Figure 94: Europe Market Value (USD Million) by Technology, 2025-2035
  • Figure 95: Europe Market Value (USD Million) by Country, 2025-2035
  • Figure 96: Europe Market Value (USD Million) Analysis by Country, 2020-2035
  • Figure 97: Europe Market Volume (Units) Analysis by Country, 2020-2035
  • Figure 98: Europe Market Value Share (%) and BPS Analysis by Country, 2025-2035
  • Figure 99: Europe Market Y-o-Y Growth (%) Projections by Country, 2025-2035
  • Figure 100: Europe Market Value (USD Million) Analysis by Product Type, 2020-2035
  • Figure 101: Europe Market Volume (Units) Analysis by Product Type, 2020-2035
  • Figure 102: Europe Market Value Share (%) and BPS Analysis by Product Type, 2025-2035
  • Figure 103: Europe Market Y-o-Y Growth (%) Projections by Product Type, 2025-2035
  • Figure 104: Europe Market Value (USD Million) Analysis by Sensor Type, 2020-2035
  • Figure 105: Europe Market Volume (Units) Analysis by Sensor Type, 2020-2035
  • Figure 106: Europe Market Value Share (%) and BPS Analysis by Sensor Type, 2025-2035
  • Figure 107: Europe Market Y-o-Y Growth (%) Projections by Sensor Type, 2025-2035
  • Figure 108: Europe Market Value (USD Million) Analysis by Application, 2020-2035
  • Figure 109: Europe Market Volume (Units) Analysis by Application, 2020-2035
  • Figure 110: Europe Market Value Share (%) and BPS Analysis by Application, 2025-2035
  • Figure 111: Europe Market Y-o-Y Growth (%) Projections by Application, 2025-2035
  • Figure 112: Europe Market Value (USD Million) Analysis by Technology, 2020-2035
  • Figure 113: Europe Market Volume (Units) Analysis by Technology, 2020-2035
  • Figure 114: Europe Market Value Share (%) and BPS Analysis by Technology, 2025-2035
  • Figure 115: Europe Market Y-o-Y Growth (%) Projections by Technology, 2025-2035
  • Figure 116: Europe Market Attractiveness by Product Type, 2025-2035
  • Figure 117: Europe Market Attractiveness by Sensor Type, 2025-2035
  • Figure 118: Europe Market Attractiveness by Application, 2025-2035
  • Figure 119: Europe Market Attractiveness by Technology, 2025-2035
  • Figure 120: Europe Market Attractiveness by Country, 2025-2035
  • Figure 121: East Asia Market Value (USD Million) by Product Type, 2025-2035
  • Figure 122: East Asia Market Value (USD Million) by Sensor Type, 2025-2035
  • Figure 123: East Asia Market Value (USD Million) by Application, 2025-2035
  • Figure 124: East Asia Market Value (USD Million) by Technology, 2025-2035
  • Figure 125: East Asia Market Value (USD Million) by Country, 2025-2035
  • Figure 126: East Asia Market Value (USD Million) Analysis by Country, 2020-2035
  • Figure 127: East Asia Market Volume (Units) Analysis by Country, 2020-2035
  • Figure 128: East Asia Market Value Share (%) and BPS Analysis by Country, 2025-2035
  • Figure 129: East Asia Market Y-o-Y Growth (%) Projections by Country, 2025-2035
  • Figure 130: East Asia Market Value (USD Million) Analysis by Product Type, 2020-2035
  • Figure 131: East Asia Market Volume (Units) Analysis by Product Type, 2020-2035
  • Figure 132: East Asia Market Value Share (%) and BPS Analysis by Product Type, 2025-2035
  • Figure 133: East Asia Market Y-o-Y Growth (%) Projections by Product Type, 2025-2035
  • Figure 134: East Asia Market Value (USD Million) Analysis by Sensor Type, 2020-2035
  • Figure 135: East Asia Market Volume (Units) Analysis by Sensor Type, 2020-2035
  • Figure 136: East Asia Market Value Share (%) and BPS Analysis by Sensor Type, 2025-2035
  • Figure 137: East Asia Market Y-o-Y Growth (%) Projections by Sensor Type, 2025-2035
  • Figure 138: East Asia Market Value (USD Million) Analysis by Application, 2020-2035
  • Figure 139: East Asia Market Volume (Units) Analysis by Application, 2020-2035
  • Figure 140: East Asia Market Value Share (%) and BPS Analysis by Application, 2025-2035
  • Figure 141: East Asia Market Y-o-Y Growth (%) Projections by Application, 2025-2035
  • Figure 142: East Asia Market Value (USD Million) Analysis by Technology, 2020-2035
  • Figure 143: East Asia Market Volume (Units) Analysis by Technology, 2020-2035
  • Figure 144: East Asia Market Value Share (%) and BPS Analysis by Technology, 2025-2035
  • Figure 145: East Asia Market Y-o-Y Growth (%) Projections by Technology, 2025-2035
  • Figure 146: East Asia Market Attractiveness by Product Type, 2025-2035
  • Figure 147: East Asia Market Attractiveness by Sensor Type, 2025-2035
  • Figure 148: East Asia Market Attractiveness by Application, 2025-2035
  • Figure 149: East Asia Market Attractiveness by Technology, 2025-2035
  • Figure 150: East Asia Market Attractiveness by Country, 2025-2035
  • Figure 151: South Asia & Pacific Market Value (USD Million) by Product Type, 2025-2035
  • Figure 152: South Asia & Pacific Market Value (USD Million) by Sensor Type, 2025-2035
  • Figure 153: South Asia & Pacific Market Value (USD Million) by Application, 2025-2035
  • Figure 154: South Asia & Pacific Market Value (USD Million) by Technology, 2025-2035
  • Figure 155: South Asia & Pacific Market Value (USD Million) by Country, 2025-2035
  • Figure 156: South Asia & Pacific Market Value (USD Million) Analysis by Country, 2020-2035
  • Figure 157: South Asia & Pacific Market Volume (Units) Analysis by Country, 2020-2035
  • Figure 158: South Asia & Pacific Market Value Share (%) and BPS Analysis by Country, 2025-2035
  • Figure 159: South Asia & Pacific Market Y-o-Y Growth (%) Projections by Country, 2025-2035
  • Figure 160: South Asia & Pacific Market Value (USD Million) Analysis by Product Type, 2020-2035
  • Figure 161: South Asia & Pacific Market Volume (Units) Analysis by Product Type, 2020-2035
  • Figure 162: South Asia & Pacific Market Value Share (%) and BPS Analysis by Product Type, 2025-2035
  • Figure 163: South Asia & Pacific Market Y-o-Y Growth (%) Projections by Product Type, 2025-2035
  • Figure 164: South Asia & Pacific Market Value (USD Million) Analysis by Sensor Type, 2020-2035
  • Figure 165: South Asia & Pacific Market Volume (Units) Analysis by Sensor Type, 2020-2035
  • Figure 166: South Asia & Pacific Market Value Share (%) and BPS Analysis by Sensor Type, 2025-2035
  • Figure 167: South Asia & Pacific Market Y-o-Y Growth (%) Projections by Sensor Type, 2025-2035
  • Figure 168: South Asia & Pacific Market Value (USD Million) Analysis by Application, 2020-2035
  • Figure 169: South Asia & Pacific Market Volume (Units) Analysis by Application, 2020-2035
  • Figure 170: South Asia & Pacific Market Value Share (%) and BPS Analysis by Application, 2025-2035
  • Figure 171: South Asia & Pacific Market Y-o-Y Growth (%) Projections by Application, 2025-2035
  • Figure 172: South Asia & Pacific Market Value (USD Million) Analysis by Technology, 2020-2035
  • Figure 173: South Asia & Pacific Market Volume (Units) Analysis by Technology, 2020-2035
  • Figure 174: South Asia & Pacific Market Value Share (%) and BPS Analysis by Technology, 2025-2035
  • Figure 175: South Asia & Pacific Market Y-o-Y Growth (%) Projections by Technology, 2025-2035
  • Figure 176: South Asia & Pacific Market Attractiveness by Product Type, 2025-2035
  • Figure 177: South Asia & Pacific Market Attractiveness by Sensor Type, 2025-2035
  • Figure 178: South Asia & Pacific Market Attractiveness by Application, 2025-2035
  • Figure 179: South Asia & Pacific Market Attractiveness by Technology, 2025-2035
  • Figure 180: South Asia & Pacific Market Attractiveness by Country, 2025-2035
  • Figure 181: Middle East and Africa Market Value (USD Million) by Product Type, 2025-2035
  • Figure 182: Middle East and Africa Market Value (USD Million) by Sensor Type, 2025-2035
  • Figure 183: Middle East and Africa Market Value (USD Million) by Application, 2025-2035
  • Figure 184: Middle East and Africa Market Value (USD Million) by Technology, 2025-2035
  • Figure 185: Middle East and Africa Market Value (USD Million) by Country, 2025-2035
  • Figure 186: Middle East and Africa Market Value (USD Million) Analysis by Country, 2020-2035
  • Figure 187: Middle East and Africa Market Volume (Units) Analysis by Country, 2020-2035
  • Figure 188: Middle East and Africa Market Value Share (%) and BPS Analysis by Country, 2025-2035
  • Figure 189: Middle East and Africa Market Y-o-Y Growth (%) Projections by Country, 2025-2035
  • Figure 190: Middle East and Africa Market Value (USD Million) Analysis by Product Type, 2020-2035
  • Figure 191: Middle East and Africa Market Volume (Units) Analysis by Product Type, 2020-2035
  • Figure 192: Middle East and Africa Market Value Share (%) and BPS Analysis by Product Type, 2025-2035
  • Figure 193: Middle East and Africa Market Y-o-Y Growth (%) Projections by Product Type, 2025-2035
  • Figure 194: Middle East and Africa Market Value (USD Million) Analysis by Sensor Type, 2020-2035
  • Figure 195: Middle East and Africa Market Volume (Units) Analysis by Sensor Type, 2020-2035
  • Figure 196: Middle East and Africa Market Value Share (%) and BPS Analysis by Sensor Type, 2025-2035
  • Figure 197: Middle East and Africa Market Y-o-Y Growth (%) Projections by Sensor Type, 2025-2035
  • Figure 198: Middle East and Africa Market Value (USD Million) Analysis by Application, 2020-2035
  • Figure 199: Middle East and Africa Market Volume (Units) Analysis by Application, 2020-2035
  • Figure 200: Middle East and Africa Market Value Share (%) and BPS Analysis by Application, 2025-2035
  • Figure 201: Middle East and Africa Market Y-o-Y Growth (%) Projections by Application, 2025-2035
  • Figure 202: Middle East and Africa Market Value (USD Million) Analysis by Technology, 2020-2035
  • Figure 203: Middle East and Africa Market Volume (Units) Analysis by Technology, 2020-2035
  • Figure 204: Middle East and Africa Market Value Share (%) and BPS Analysis by Technology, 2025-2035
  • Figure 205: Middle East and Africa Market Y-o-Y Growth (%) Projections by Technology, 2025-2035
  • Figure 206: Middle East and Africa Market Attractiveness by Product Type, 2025-2035
  • Figure 207: Middle East and Africa Market Attractiveness by Sensor Type, 2025-2035
  • Figure 208: Middle East and Africa Market Attractiveness by Application, 2025-2035
  • Figure 209: Middle East and Africa Market Attractiveness by Technology, 2025-2035
  • Figure 210: Middle East and Africa Market Attractiveness by Country, 2025-2035

Frequently Asked Questions

How big is the Skin Sensors Market in 2025?

The global Skin Sensors Market is estimated to be valued at USD 2,525.5 million in 2025.

What will be the size of Skin Sensors Market in 2035?

The market size for the Skin Sensors Market is projected to reach USD 7,860 million by 2035.

How much will be the Skin Sensors Market growth between 2025 and 2035?

The Skin Sensors Market is expected to grow at a CAGR of 16.4% between 2025 and 2035.

What are the key product types in the Skin Sensors Market?

The key product types in the Skin Sensors Market include hydration sensors, temperature sensors, pH sensors, pressure sensors, and multifunctional sensors.

Which product segment is expected to contribute significant share in the Skin Sensors Market in 2025?

In 2025, hydration sensors are anticipated to dominate the product segment with a 32.5% market share, owing to increasing usage in health monitoring and cosmetic applications.

Explore Similar Insights

Future Market Insights

Skin Sensors Market