Skin-Barrier Strengthening Phospholipids Market Size and Share Forecast Outlook 2025 to 2035

The Skin-Barrier Strengthening Phospholipids Market is projected to grow from USD 1,400.1 million in 2025 to USD 4,800.3 million by 2035, reflecting a strong CAGR of 13.1% over the forecast period. This growth trajectory underscores the rising consumer preference for bio-based, dermatologist-tested formulations that enhance skin resilience and repair damaged barriers.
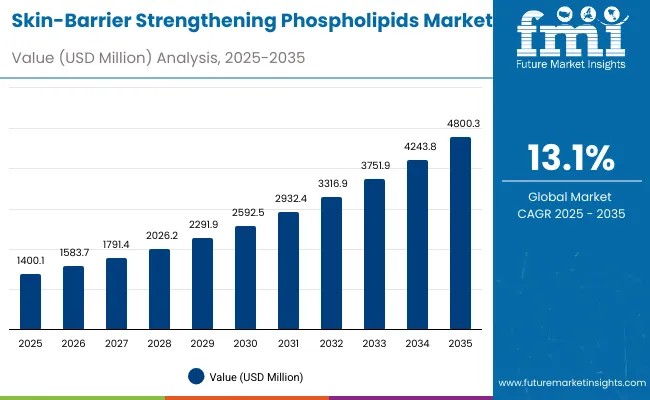
Quick Stats for Skin-Barrier Strengthening Phospholipids Market

  • Skin-Barrier Strengthening Phospholipids Market Value (2025): USD 1,400.1 million
  • Skin-Barrier Strengthening Phospholipids Market Forecast Value (2035): USD 4,800.3 million
  • Skin-Barrier Strengthening Phospholipids Market Forecast CAGR: 13.1%
  • Leading Segment in 2025: Barrier Repair (55.6%)
  • Key Growth Regions: Asia-Pacific, North America, Europe
  • Top Key Players: Lipoid, Evonik, Croda, BASF, Kewpie, Seppic, Clariant, DSM-Firmenich, Ashland, Givaudan

Skin Barrier Strengthening Phospholipids Market

Skin-Barrier Strengthening Phospholipids Market Key Takeaways

Metric Value
Skin-Barrier Strengthening Phospholipids Market Estimated Value in (2025E) USD 1,400.1 million
Skin-Barrier Strengthening Phospholipids Market Forecast Value in (2035F) USD 4,800.3 million
Forecast CAGR (2025 to 2035) 13.1%

During the first five years (2025 to 2030), the market expands from USD 1,400.1 million to USD 2,592.5 million, driven by rapid adoption of natural/organic phospholipid formulations across skincare categories. Key drivers include the rising incidence of sensitive skin conditions and growing demand for multifunctional ingredients in creams, lotions, and serums.

From 2030 to 2035, the market accelerates further, adding over USD 2,207.8 million, fueled by advancements in engineered phospholipids, new encapsulation technologies, and increased penetration into pharmaceutical skincare solutions. By 2035, natural/organic claims dominate alongside barrier repair as the leading functional attribute, with adoption extending across e-commerce, pharmacies, and dermatology clinics globally.

From 2020 to 2024, the market expanded steadily on the back of growing demand for barrier repair formulations, particularly natural and organic variants, which held 51.7% share in 2025. The competitive landscape was dominated by established phospholipid specialists such as Lipoid, which held 8% global value share in 2025, alongside diversified chemical leaders offering phospholipid-based actives for skincare. Differentiation focused on purity, biocompatibility, and sustainability credentials.

By 2025, the market reached USD 1,400.1 million, with further acceleration expected as clinical-grade and dermatologist-tested claims gain prominence. Players are pivoting toward clean-label, plant-derived, and engineered phospholipid solutions, enabling cross-segment adoption in premium cosmetics and dermatology clinics. Growth momentum is shifting from traditional hardware-like raw ingredient supply to ecosystem-driven innovation, including biotech-enhanced phospholipids, partnerships with dermatology labs, and tailored solutions for sensitive-skin applications.

Why the Skin-Barrier Strengthening Phospholipids Market is growing?

A key growth driver is the surge in consumer demand for dermatology-focused solutions targeting sensitive skin. Skin-barrier phospholipids are increasingly used as functional ingredients in formulations for conditions like eczema, rosacea, and irritation-prone skin.

Unlike generic emollients, these phospholipids mimic natural cell structures, improving tolerability and reducing adverse reactions. This science-backed positioning has made them a preferred choice among dermatologists and cosmeceutical brands, fueling steady adoption in clinical-grade skincare portfolios.

Another distinct reason lies in the convergence of nutrition, wellness, and topical skincare. Phospholipids derived from soy, sunflower, and marine sources are being incorporated into both oral supplements and topical products, creating dual-action regimens.

This integration reflects consumer preference for inside-out beauty routines, where barrier health is reinforced holistically. Such cross-category innovationbridging nutraceuticals and dermo-cosmeticsexpands application avenues and drives strong uptake across premium product lines, differentiating phospholipid-based solutions from conventional moisturizers.

Segmental Analysis

The market is segmented by source, function, product type, channel, claim, and region, reflecting its diverse applications across skincare and wellness. Sources include soy-derived, sunflower-derived, synthetic/engineered, and marine-derived phospholipids, which highlight both natural and engineered ingredient pathways. Functional segmentation spans barrier repair, hydration, anti-aging, and sensitive skin relief, catering to different dermatological needs.

By product type, the market includes creams/lotions, serums, masks, and oils, serving both mainstream and niche segments. Key distribution channels are e-commerce, pharmacies, mass retail, and dermatology clinics, underscoring the blend of digital and offline sales.

Claims are differentiated into natural/organic, vegan, clean-label, and clinical-grade, driving premium positioning. Regionally, the scope extends across North America, Latin America, Europe, East Asia, South Asia, and the Middle East & Africa, with notable growth hubs in China, India, Japan, Germany, the UK, and the USA
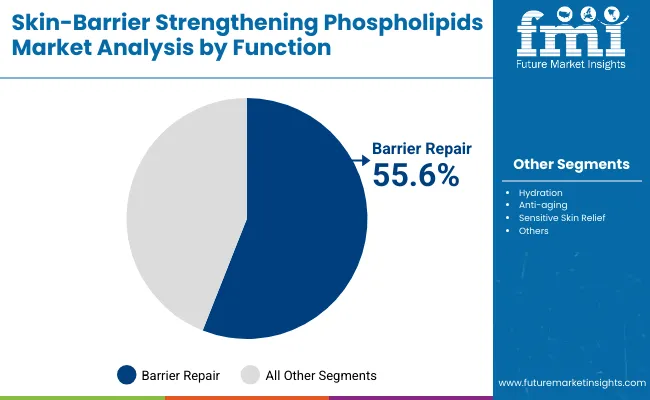
Insights into the Function Segment with Barrier Repair Leading in Market Share

Skin Barrier Strengthening Phospholipids Market By Function

Function Value Share % 2025
Barrier repair 55.6%
Others 44.4%

The barrier repair function is projected to contribute 55.6% of the Skin-Barrier Strengthening Phospholipids Market revenue in 2025, positioning it as the leading segment. This dominance is attributed to the rising demand for phospholipid-based formulations that restore compromised skin barriers caused by pollution, aging, and overuse of cosmetics. Consumers increasingly prefer products enriched with barrier-repairing phospholipids to address conditions like dryness, sensitivity, and irritation.

Formulators are innovating creams, serums, and oils with optimized lipid bilayer technology to mimic natural skin processes, further strengthening this segment. As awareness of barrier health grows in both dermatology and consumer skincare, the barrier repair category is expected to remain central to market expansion.
Insights into the Range Segment with Short-range Scanners Dominating the Demand

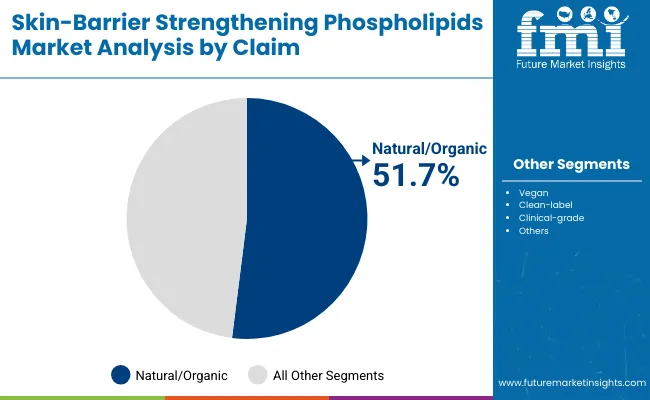
Skin Barrier Strengthening Phospholipids Market By Claim

Claim Value Share % 2025
Natural/organic 51.7%
Others 48.3%

The natural/organic claim segment is expected to hold 51.7% of the Skin-Barrier Strengthening Phospholipids Market share in 2025, making it the leading positioning category. This growth is driven by rising consumer preference for clean-label, plant-based ingredients as awareness of skin sensitivity and ingredient safety intensifies.

Brands leveraging soy- and sunflower-derived phospholipids are highlighting their organic sourcing to appeal to health-conscious buyers seeking transparency and sustainability. With regulations and certifications increasingly shaping consumer trust, natural/organic claims are anticipated to remain the most powerful driver of product differentiation and brand loyalty across global skincare portfolios.
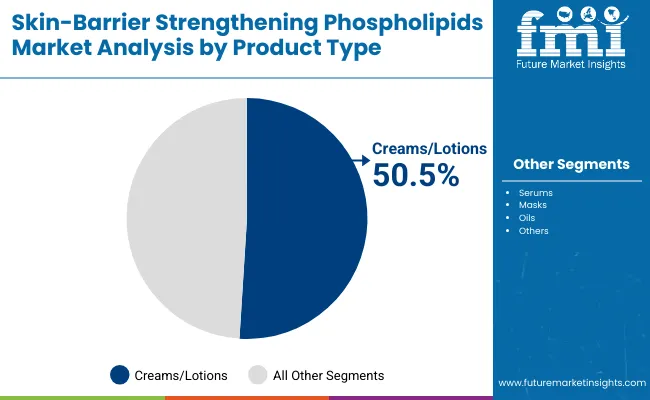
Insights into the Product Type Segment with Creams/Lotions Leading in Market Share

Skin Barrier Strengthening Phospholipids Market By Product Type

Product Type Value Share % 2025
Creams/lotions 50.5%
Others 49.5%

The creams/lotions segment is projected to account for 50.5% of the Skin-Barrier Strengthening Phospholipids Market revenue in 2025, making it the leading product type. This dominance stems from their versatility as daily-use skincare essentials, favored for barrier repair and hydration.

Their ability to deliver phospholipids evenly across the skin surface makes them more effective for long-term barrier strengthening compared to other forms. Growing popularity of multifunctional creams that combine hydration, anti-aging, and sensitive skin relief further supports this leadership. As consumer demand for convenient, multi-benefit products rises, creams/lotions are set to remain the preferred delivery format.

What are the Drivers, Restraints, and Key Trends of the Skin-Barrier Strengthening Phospholipids Market?

Rising Demand for Sensitive Skin Solutions

The market is expanding as consumers increasingly prioritize products tailored for sensitive skin. Phospholipids mimic the skin’s natural lipid structure, making them highly effective in soothing irritation and reducing inflammation without harsh additives.

Brands are leveraging this biomimetic property to position phospholipid-based products as safer alternatives to synthetic emollients. Growing cases of atopic dermatitis and eczema are accelerating consumer interest. This alignment with clinical dermatology and consumer skincare trends reinforces phospholipids as a preferred ingredient in formulations.

Integration into Premium and Natural Formulations

Consumer preferences for natural, clean-label products are boosting demand for phospholipids derived from soy and sunflower. These ingredients not only deliver hydration but also fit into the “green beauty” narrative.

Premium skincare brands are actively reformulating creams and serums with phospholipids to meet sustainability and efficacy benchmarks. Their multifunctional benefitshydration, barrier repair, and anti-agingallow brands to reduce formulation complexity while marketing science-backed natural solutions. This convergence of clean beauty with proven performance is a significant growth catalyst.

High Production and Extraction Costs

Despite their advantages, the production of phospholipidsespecially high-purity grades suitable for dermatologyremains cost-intensive. The extraction and refinement processes from soy, sunflower, or marine sources require specialized technology and strict quality control.

Synthetic or engineered phospholipids, though offering scalability, often face regulatory scrutiny and higher R&D investment. These costs limit affordability in mass-market segments, confining adoption mainly to premium or clinical-grade products. Without cost-competitive scaling, broader market penetration remains restricted compared to synthetic moisturizers and emollients.

Shift Toward Multifunctional Barrier-Repair Products

A strong trend in the market is the move toward multifunctional skincare solutions where phospholipids are central. Modern consumers are seeking fewer products that address multiple concerns such as hydration, anti-aging, and sensitivity simultaneously. Phospholipids provide formulators with flexibility to design all-in-one creams and serums, enhancing appeal among time-conscious buyers.

Companies are also integrating phospholipids into hybrid categories like “skin-health supplements meets topical care,” linking beauty and wellness. This multifunctional positioning is expected to drive cross-category innovation and sustained demand.
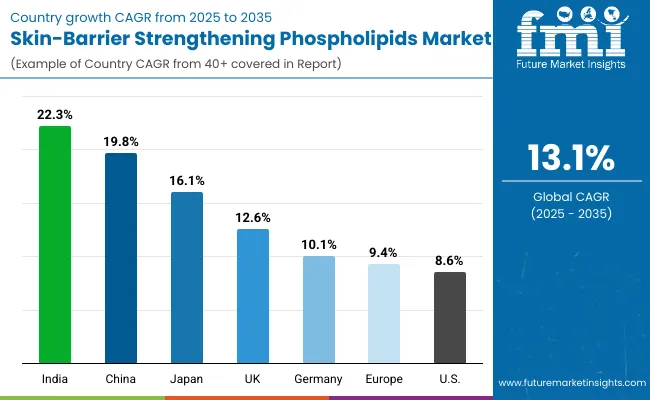
Analysis of Skin-Barrier Strengthening Phospholipids Market By Key Countries

Skin Barrier Strengthening Phospholipids Market By Country

Country Estimated CAGR (2025 to 2035)
China 19.8%
USA 8.3%
India 22.3%
UK 12.6%
Germany 10.1%
Japan 16.1%

The global Skin-Barrier Strengthening Phospholipids Market demonstrates clear regional variations in growth momentum, shaped by differences in consumer skincare preferences, raw material availability, and regulatory standards. Asia-Pacific leads the market expansion, with India (22.3% CAGR) and China (19.8% CAGR) emerging as high-growth hubs.

India’s rise is fueled by demand in tier-2 and tier-3 cities, where affordable formulations and localized production are driving wider accessibility. China’s growth reflects its scale in cosmetics manufacturing, alongside strong consumer adoption of natural and functional skincare solutions. Both markets are benefiting from government support for biotechnology and nutraceutical-grade phospholipids.

Europe remains a strong contributor, led by Germany (10.1% CAGR) and the UK (12.6% CAGR). These countries prioritize clinical-grade and natural/organic skincare, with brands reformulating around phospholipids to meet EU clean-label and sustainability mandates. The region also benefits from advanced R&D in biomimetic formulations and robust dermatology-focused distribution channels. Japan (16.1% CAGR) shows strong traction, aligning phospholipid innovation with its premium skincare and cosmeceutical markets. Growing emphasis on anti-aging and sensitive skin solutions reinforces phospholipids as high-value ingredients.

North America, with the USA at 8.3% CAGR, shows steady but comparatively moderate expansion. Growth here is driven by clean-label demand and dermatologist-backed product launches, though higher reliance on synthetic alternatives and cost concerns limit broader uptake.
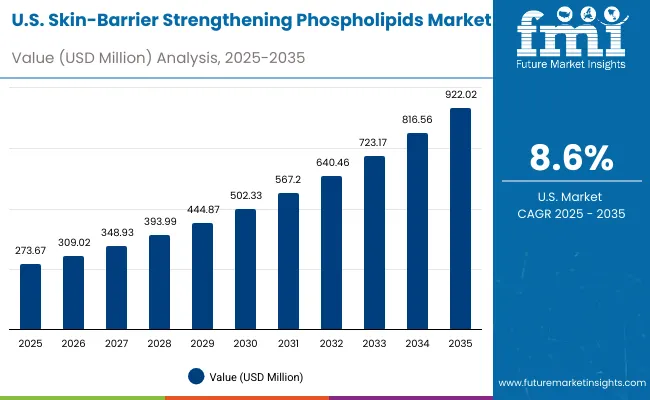
Sales Outlook for Skin-Barrier Strengthening Phospholipids in the United States

United States Skin Barrier Strengthening Phospholipids Market

Year USA Skin-Barrier Strengthening Phospholipids Market (USD Million)
2025 273.67
2026 309.02
2027 348.93
2028 393.99
2029 444.87
2030 502.33
2031 567.20
2032 640.46
2033 723.17
2034 816.56
2035 922.02

The Skin-Barrier Strengthening Phospholipids Market in the United States is forecasted to expand from USD 273.67 million in 2025 to USD 922.02 million by 2035, reflecting robust and steady growth driven by rising demand for dermatology-backed formulations and the increasing prevalence of sensitive skin conditions. The market’s strength lies in consumer inclination toward barrier-repair and hydration-focused solutions, with dermatologist-tested and clinical-grade claims adding credibility and boosting adoption across premium skincare categories.

Growth is further supported by strong penetration in e-commerce and pharmacies, where consumer awareness of ingredient-based products is accelerating. The USA market also benefits from a mature regulatory framework and high consumer purchasing power, fueling premiumization trends and the demand for natural/organic phospholipid-based skincare products. With leading players integrating advanced formulation science, vegan claims, and clean-label certifications, the country continues to position itself as a key hub for innovation in phospholipid-based skincare.

  • Barrier repair dominates, accounting for 56.4% share in 2025, valued at USD 154.2 million.
  • Growing preference for natural/organic phospholipids aligns with the USA clean beauty movement.
  • Expanding distribution through e-commerce and dermatology clinics strengthens accessibility.

Growth and Expansion Outlook for Skin-Barrier Strengthening Phospholipids Market in the United Kingdom

The Skin-Barrier Strengthening Phospholipids Market in the United Kingdom is projected to grow at a CAGR of 12.6% from 2025 to 2035, supported by rising consumer preference for clinically validated skincare and premium wellness products. The market expansion is fueled by growing adoption of barrier-repair and hydration-centric formulations, catering to the country’s increasing population with sensitive skin conditions.

The UK’s strong cosmeceutical innovation ecosystem, combining dermatology research centers, biotechnology firms, and established skincare manufacturers, is fostering new product launches featuring phospholipid-based formulations. The surge in demand for natural/organic and vegan-certified solutions aligns with the UK’s clean beauty movement, further strengthening uptake. Retail dynamics are shifting toward specialty beauty stores and online pharmacies, where ingredient-conscious consumers actively seek science-backed products.

Government-backed research collaborations and sustainability-focused regulations are also influencing formulation practices, encouraging the use of renewable and traceable sources such as soy and sunflower-derived phospholipids. These factors are consolidating the UK’s role as a leading European hub for innovative phospholipid-based skincare solutions.

  • Growth anchored by rising demand for barrier repair and hydration functions.
  • Natural/organic phospholipids aligning with UK’s clean-label and vegan beauty trends.
  • Expansion of specialty retail and e-commerce as key consumer access channels.

Growth and Expansion Outlook for Skin-Barrier Strengthening Phospholipids Market in India

India is witnessing strong expansion in the Skin-Barrier Strengthening Phospholipids Market, projected to grow at a CAGR of 22.3% between 2025 and 2035, the fastest among key regions. Rising urban consumer demand for barrier-repair and hydration solutions is driving growth, supported by high prevalence of sensitive skin conditions in urban populations exposed to pollution and lifestyle stressors.

The acceleration in tier-2 and tier-3 cities is particularly notable, where affordability, localized product innovation, and wider e-commerce penetration are enabling access to phospholipid-based skincare. Domestic manufacturers are partnering with global ingredient suppliers to introduce natural/organic soy- and sunflower-derived formulations that appeal to India’s growing clean-label and vegan beauty segment.

In parallel, the rise of dermatology clinics and wellness centers across the country has expanded distribution beyond mass retail, strengthening the channel mix. Moreover, government-backed initiatives in healthcare and biotech innovation are fueling R&D for advanced phospholipid applications, bridging traditional ayurvedic formulations with modern cosmeceutical science. This positions India as a central growth hub in the Asia-Pacific market.

  • Tier-2 and tier-3 city adoption driven by affordability and e-commerce accessibility.
  • Strong demand for natural/organic phospholipid-based formulations in the clean-label beauty space.
  • Expanding role of dermatology clinics and wellness centers in product distribution.

Sales Outlook for Skin-Barrier Strengthening Phospholipids in China

The Skin-Barrier Strengthening Phospholipids Market in China is projected to expand at a CAGR of 19.8% from 2025 to 2035, one of the fastest among global peers. Growth is being driven by strong domestic demand for natural and functional skincare formulations, where soy- and sunflower-derived phospholipids are gaining traction due to their clean-label positioning and proven efficacy in barrier repair and hydration. Rising consumer awareness of sensitive skin conditions linked to pollution exposure has further amplified demand for phospholipid-based solutions in urban centers.

Chinese cosmetic brands, supported by competitive local ingredient suppliers, are rapidly innovating in clinical-grade and vegan-certified formulations. At the same time, affordability of domestic offerings is enabling mass-market penetration through both e-commerce platforms and mass retail.

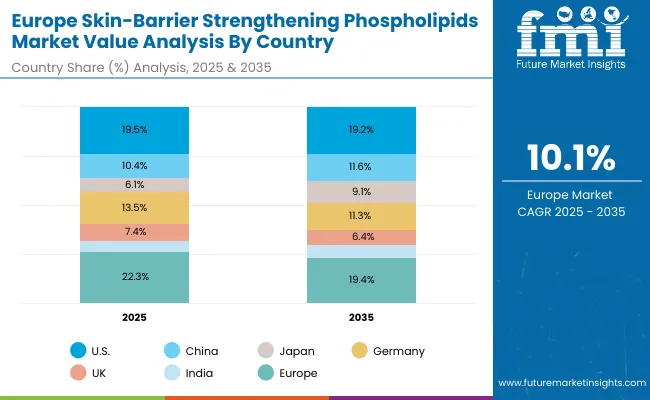
The public sector is also playing a role, with national initiatives promoting innovation in cosmeceuticals and biotech integration, positioning phospholipid-based skincare as part of broader health and wellness trends. By 2035, China’s share in the global market is forecast to rise from 10.4% in 2025 to 11.6%, reflecting its strategic role as both a production hub and consumption powerhouse.
  • Clean-label soy- and sunflower-derived formulations are gaining mass adoption.
  • Urban pollution-linked skin sensitivity driving higher demand for barrier-repair solutions.
  • Local brands innovating in clinical-grade and vegan-certified phospholipids.
  • China’s global market share expected to climb to 11.6% by 2035.

In-depth Analysis of Skin-Barrier Strengthening Phospholipids in Germany

Germany Skin Barrier Strengthening Phospholipids Market

Country 2025 Share (%)
USA 19.5%
China 10.4%
Japan 6.1%
Germany 13.5%
UK 7.4%
India 4.7%
Country 2035 Share (%)
USA 19.2%
China 11.6%
Japan 9.1%
Germany 11.3%
UK 6.4%
India 5.2%

The Skin-Barrier Strengthening Phospholipids Market in Germany is expected to grow at a CAGR of 10.1% between 2025 and 2035, supported by its strong presence in premium skincare, dermocosmetics, and biotech-driven ingredient innovation.

While Germany held a 13.5% share of the global market in 2025, this is projected to slightly decline to 11.3% by 2035, reflecting intensifying competition from Asia-Pacific producers and cost-driven markets. Nonetheless, Germany remains a hub for high-quality, regulatory-compliant formulations, particularly in clean-label and dermatologist-tested phospholipids.

Growth is being driven by R&D-led companies investing in phospholipid applications for barrier repair, hydration, and sensitive skin relief, aligning with EU guidelines on sustainability and consumer safety. German dermatology clinics and pharmaceutical-linked brands are integrating soy- and sunflower-derived phospholipids into both OTC and prescription skincare, reinforcing the medical positioning of these ingredients. Rising consumer preference for natural and organic claims complements the market, while synthetic and engineered phospholipids are gaining traction for enhanced stability in functional formulations.

Key challenges include higher production costs compared to Asian suppliers, which may limit scale in mass-market categories. However, Germany’s competitive advantage lies in its stringent regulatory alignment, technological innovation, and export-driven strategies, ensuring its continued relevance in premium and medical-grade product segments.
  • CAGR of 10.1% (2025 to 2035) with share moving from 13.5% to 11.3%.
  • Strong base in dermocosmetics and pharma-linked skincare applications.
  • Soy- and sunflower-derived phospholipids dominate, with growth in synthetic/engineered formulations.
  • Advantage in clean-label, dermatologist-tested, and sustainable positioning, despite higher production costs.

Growth Outlook for Skin-Barrier Strengthening Phospholipids Market in USA

Usa Skin Barrier Strengthening Phospholipids Market

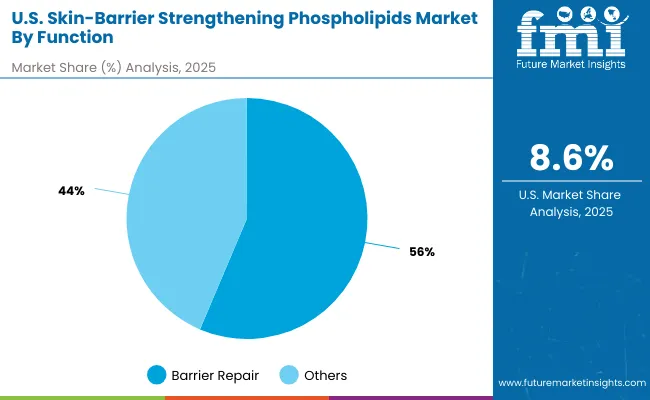
USA by Function Value Share % 2025
Barrier repair 56.4%
Others 43.6%

The Skin-Barrier Strengthening Phospholipids Market in the USA is projected to expand steadily through 2035, driven by the rising focus on barrier repair and hydration functions, which already account for 56.4% of value share in 2025.

Consumers in the USA are showing heightened awareness of skin health, particularly in connection to eczema, psoriasis, and atopic dermatitis, which is fueling demand for dermatologist-tested and clinical-grade phospholipid formulations. This aligns with the broader dermocosmetic movement, where medical science and cosmetic applications converge.

Adoption is further supported by the integration of phospholipids into OTC skincare, prescription products, and premium cosmetics, creating a hybrid consumer base across healthcare and personal care. The USA market also benefits from pharma-linked innovation pipelines, where companies are exploring synthetic and engineered phospholipids for enhanced stability, longer shelf life, and compatibility with advanced formulations such as encapsulation systems and nanocarriers. With growing interest in clean-label and natural/organic claims, the USA segment is positioned as a balanced mix of science-led and sustainability-driven growth.
  • Barrier repair leads USA market functions at 56.4% share (2025).
  • Strong traction in dermocosmetics and prescription-linked formulations.
  • Innovation in synthetic/engineered phospholipids supporting stability and advanced delivery.
  • Growth backed by consumer demand for clinical-grade, clean-label, and natural products.

Opportunity Analysis of China Skin-Barrier Strengthening Phospholipids Market

China Skin Barrier Strengthening Phospholipids Market

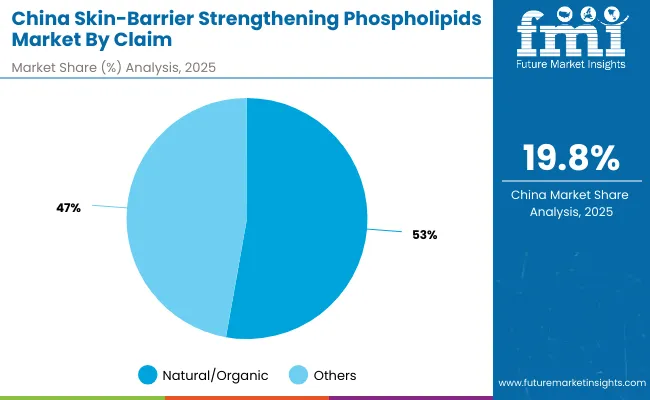
China by Claim Value Share % 2025
Natural/organic 52.8%
Others 47.2%

The China Skin-Barrier Strengthening Phospholipids Market presents strong growth opportunities, with natural/organic claims leading at 52.8% share in 2025. This dominance stems from rising consumer preference for clean-label, eco-conscious, and plant-derived skincare formulations. China’s regulatory emphasis on safer cosmetic ingredients has further strengthened demand for natural phospholipids sourced from soy and sunflower.

Adoption is also being fueled by the integration of phospholipid-based formulations in TCM-inspired (Traditional Chinese Medicine) beauty products, where natural actives are combined with modern delivery systems for barrier repair and hydration.

E-commerce platforms amplify visibility, with domestic brands leveraging affordability to penetrate mass segments. Premium brands, meanwhile, are expanding clinical-grade natural lines to target urban middle-class consumers. With this dual momentum, natural/organic phospholipids are positioned as the cornerstone of China’s barrier-strengthening skincare innovation.
  • Market size for China in 2025 is USD 145.99 million.
  • Global share (2025): 10.4% → 11.6% (2035).
  • Natural/organic claims dominate at 52.8% share, reflecting clean-label and plant-derived demand.

Competitive Landscape of Skin-Barrier Strengthening Phospholipids Market

Skin Barrier Strengthening Phospholipids Market By Company

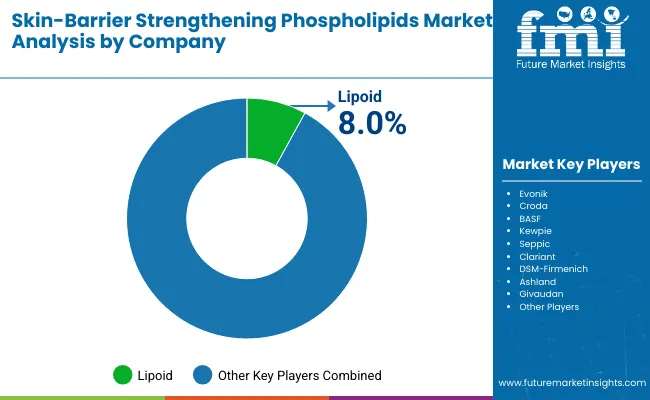
Company Global Value Share 2025
Lipoid 8.0%
Others 92.0%

The Skin-Barrier Strengthening Phospholipids Market is moderately fragmented, featuring global ingredient suppliers, specialty biotech innovators, and niche formulators serving targeted skincare applications. Global leaders such as Lipoid, Evonik, Croda, and BASF command significant market share through extensive R&D pipelines and strategic collaborations with major personal care brands. Their competitive strength lies in supply-chain reliability, large-scale phospholipid production, and advancements in plant- and marine-derived ingredients with high purity and stability.

Mid-sized players like Seppic, Kewpie, and DSM-Firmenich are innovating through clinical-grade and bioengineered phospholipids tailored for sensitive skin, hydration, and anti-aging formulations. These firms differentiate by leveraging biotech platforms, dermatology-tested claims, and hybrid delivery systems that enhance skin penetration.

Niche providers such as Ashland, Clariant, and Givaudan Active Beauty are focusing on premium positioning, offering phospholipids integrated into multifunctional complexes for natural/organic, vegan, and clean-label skincare categories.

Their strength lies in customization, sustainability-driven sourcing, and regional adaptability across Europe and Asia-Pacific. Competitive differentiation in this market is shifting from raw material supply to value-added innovation, including encapsulation technologies, clinical validation, and multifunctional claims.

With rising consumer demand for science-backed, barrier-strengthening solutions, companies that integrate biocompatibility, sustainability, and advanced delivery mechanisms are poised to strengthen their competitive advantage.

Key Developments in Skin-Barrier Strengthening Phospholipids Market

  • April 2024: BASF announced the launch of a new biotech-engineered phospholipid complex designed specifically for sensitive skin formulations. The innovation enhances barrier repair while reducing irritation potential, aligning with clean-label and vegan claims increasingly demanded in dermatology-backed skincare products.
  • September 2025: Evonik partnered with DSM-Firmenich to develop clinical-grade phospholipids integrated into advanced delivery systems. This collaboration focuses on boosting hydration retention and anti-aging performance, with a strong emphasis on sustainability through sunflower- and marine-derived sources.

Scope of the Report

Item Value
Quantitative Units USD 1,400.1 Million
Source Soy-derived phospholipids, Sunflower-derived, Synthetic/engineered, Marine-derived
Function Barrier repair, Hydration, Anti-aging, Sensitive skin relief
Product Type Creams/lotions, Serums, Masks, Oils
Channel E-commerce, Pharmacies, Mass retail, Dermatology clinics
Claim Natural/organic, Vegan, Clean-label, Clinical-grade
Regions Covered North America, Europe, Asia-Pacific, Latin America, Middle East & Africa
Country Covered United States, Canada, Germany, France, United Kingdom, China, Japan, India, Brazil, South Africa
Key Companies Profiled Lipoid, Evonik , Croda , BASF, Kewpie, Seppic , Clariant , DSM- Firmenich , Ashland, Givaudan
Additional Attributes Dollar sales by source type and product category, adoption trends in dermatology and clinical-grade skincare, rising demand for multifunctional creams and serums, sector-specific growth in pharmaceutical, cosmetics, and nutraceutical applications, revenue segmentation across natural/organic versus synthetic formulations, integration with clean-label and vegan-certified claims, regional trends influenced by regulatory shifts and consumer wellness movements, and innovations in encapsulation, lipid-layer structuring, and marine-derived phospholipid extraction technologies.

Key Segments

By Source:

  • Soy-derived phospholipids
  • Sunflower-derived
  • Synthetic/engineered
  • Marine-derived

By Function:

  • Barrier repair
  • Hydration
  • Anti-aging
  • Sensitive skin relief

By Product Type:

  • Creams/lotions
  • Serums
  • Masks
  • Oils

By Channel:

  • E-commerce
  • Pharmacies
  • Mass retail
  • Dermatology clinics

By Claim:

  • Natural/organic
  • Vegan
  • Clean-label
  • Clinical-grade

By Region:

  • North America
  • Latin America
  • Europe
  • East Asia
  • South Asia & Pacific
  • Middle East and Africa

Table of Content

  1. Executive Summary
    • Global Market Outlook
    • Demand-side Trends
    • Supply-side Trends
    • Technology Roadmap Analysis
    • Analysis and Recommendations
  2. Market Overview
    • Market Coverage / Taxonomy
    • Market Definition / Scope / Limitations
  3. Market Background
    • Market Dynamics
      • Drivers
      • Restraints
      • Opportunity
      • Trends
    • Scenario Forecast
      • Demand in Optimistic Scenario
      • Demand in Likely Scenario
      • Demand in Conservative Scenario
    • Opportunity Map Analysis
    • Product Life Cycle Analysis
    • Supply Chain Analysis
    • Investment Feasibility Matrix
    • Value Chain Analysis
    • PESTLE and Porter’s Analysis
    • Regulatory Landscape
    • Regional Parent Market Outlook
    • Production and Consumption Statistics
    • Import and Export Statistics
  4. Global Analysis 2020 to 2024 and Forecast, 2025 to 2035
    • Historical Market Size Value (USD Million) Analysis, 2020 to 2024
    • Current and Future Market Size Value (USD Million) Projections, 2025 to 2035
      • Y-o-Y Growth Trend Analysis
      • Absolute $ Opportunity Analysis
  5. Global Pricing Analysis 2020 to 2024 and Forecast 2025 to 2035
  6. Global Analysis 2020 to 2024 and Forecast 2025 to 2035, By Source
    • Introduction / Key Findings
    • Historical Market Size Value (USD Million) Analysis By Source, 2020 to 2024
    • Current and Future Market Size Value (USD Million) Analysis and Forecast By Source, 2025 to 2035
      • Soy-derived phospholipids
      • Sunflower-derived
      • Synthetic/engineered
      • Marine-derived
    • Y-o-Y Growth Trend Analysis By Source, 2020 to 2024
    • Absolute $ Opportunity Analysis By Source, 2025 to 2035
  7. Global Analysis 2020 to 2024 and Forecast 2025 to 2035, By Function
    • Introduction / Key Findings
    • Historical Market Size Value (USD Million) Analysis By Function, 2020 to 2024
    • Current and Future Market Size Value (USD Million) Analysis and Forecast By Function, 2025 to 2035
      • Barrier repair
      • Hydration
      • Anti-aging
      • Sensitive skin relief
    • Y-o-Y Growth Trend Analysis By Function, 2020 to 2024
    • Absolute $ Opportunity Analysis By Function, 2025 to 2035
  8. Global Analysis 2020 to 2024 and Forecast 2025 to 2035, By Product Type
    • Introduction / Key Findings
    • Historical Market Size Value (USD Million) Analysis By Product Type, 2020 to 2024
    • Current and Future Market Size Value (USD Million) Analysis and Forecast By Product Type, 2025 to 2035
      • Creams/lotions
      • Serums
      • Masks
      • Oils
    • Y-o-Y Growth Trend Analysis By Product Type, 2020 to 2024
    • Absolute $ Opportunity Analysis By Product Type, 2025 to 2035
  9. Global Analysis 2020 to 2024 and Forecast 2025 to 2035, By Channel
    • Introduction / Key Findings
    • Historical Market Size Value (USD Million) Analysis By Channel, 2020 to 2024
    • Current and Future Market Size Value (USD Million) Analysis and Forecast By Channel, 2025 to 2035
      • E-commerce
      • Pharmacies
      • Mass retail
      • Dermatology clinics
    • Y-o-Y Growth Trend Analysis By Channel, 2020 to 2024
    • Absolute $ Opportunity Analysis By Channel, 2025 to 2035
  10. Global Analysis 2020 to 2024 and Forecast 2025 to 2035, By Claim
    • Introduction / Key Findings
    • Historical Market Size Value (USD Million) Analysis By Claim, 2020 to 2024
    • Current and Future Market Size Value (USD Million) Analysis and Forecast By Claim, 2025 to 2035
      • Natural/organic
      • Vegan
      • Clean-label
      • Clinical-grade
    • Y-o-Y Growth Trend Analysis By Claim, 2020 to 2024
    • Absolute $ Opportunity Analysis By Claim, 2025 to 2035
  11. Global Analysis 2020 to 2024 and Forecast 2025 to 2035, By Region
    • Introduction
    • Historical Market Size Value (USD Million) Analysis By Region, 2020 to 2024
    • Current Market Size Value (USD Million) Analysis and Forecast By Region, 2025 to 2035
      • North America
      • Latin America
      • Europe
      • East Asia
      • South Asia & Pacific
      • Middle East and Africa
    • Market Attractiveness Analysis By Region
  12. North America Analysis 2020 to 2024 and Forecast 2025 to 2035, By Country
    • Historical Market Size Value (USD Million) Trend Analysis By Market Taxonomy, 2020 to 2024
    • Market Size Value (USD Million) Forecast By Market Taxonomy, 2025 to 2035
      • By Country
        • USA
        • Canada
      • By Source
      • By Function
      • By Product Type
      • By Channel
      • By Claim
    • Market Attractiveness Analysis
      • By Country
      • By Source
      • By Function
      • By Product Type
      • By Channel
      • By Claim
    • Key Takeaways
  13. Latin America Analysis 2020 to 2024 and Forecast 2025 to 2035, By Country
    • Historical Market Size Value (USD Million) Trend Analysis By Market Taxonomy, 2020 to 2024
    • Market Size Value (USD Million) Forecast By Market Taxonomy, 2025 to 2035
      • By Country
        • Brazil
        • Mexico
        • Colombia
        • Rest of Latin America
      • By Source
      • By Function
      • By Product Type
      • By Channel
      • By Claim
    • Market Attractiveness Analysis
      • By Country
      • By Source
      • By Function
      • By Product Type
      • By Channel
      • By Claim
    • Key Takeaways
  14. Europe Analysis 2020 to 2024 and Forecast 2025 to 2035, By Country
    • Historical Market Size Value (USD Million) Trend Analysis By Market Taxonomy, 2020 to 2024
    • Market Size Value (USD Million) Forecast By Market Taxonomy, 2025 to 2035
      • By Country
        • Germany
        • UK
        • France
        • Italy
        • Spain
        • Belgium
        • Netherlands
        • Nordic
        • Switzerland
        • Russia
        • Poland
        • Rest of Europe
      • By Source
      • By Function
      • By Product Type
      • By Channel
      • By Claim
    • Market Attractiveness Analysis
      • By Country
      • By Source
      • By Function
      • By Product Type
      • By Channel
      • By Claim
    • Key Takeaways
  15. East Asia Analysis 2020 to 2024 and Forecast 2025 to 2035, By Country
    • Historical Market Size Value (USD Million) Trend Analysis By Market Taxonomy, 2020 to 2024
    • Market Size Value (USD Million) Forecast By Market Taxonomy, 2025 to 2035
      • By Country
        • China
        • Japan
        • South Korea
      • By Source
      • By Function
      • By Product Type
      • By Channel
      • By Claim
    • Market Attractiveness Analysis
      • By Country
      • By Source
      • By Function
      • By Product Type
      • By Channel
      • By Claim
    • Key Takeaways
  16. South Asia & Pacific Analysis 2020 to 2024 and Forecast 2025 to 2035, By Country
    • Historical Market Size Value (USD Million) Trend Analysis By Market Taxonomy, 2020 to 2024
    • Market Size Value (USD Million) Forecast By Market Taxonomy, 2025 to 2035
      • By Country
        • India
        • Thailand
        • Malaysia
        • Indonesia
        • Singapore
        • Vietnam
        • Australia
        • New Zealand
        • Rest of South Asia
      • By Source
      • By Function
      • By Product Type
      • By Channel
      • By Claim
    • Market Attractiveness Analysis
      • By Country
      • By Source
      • By Function
      • By Product Type
      • By Channel
      • By Claim
    • Key Takeaways
  17. Middle East and Africa Analysis 2020 to 2024 and Forecast 2025 to 2035, By Country
    • Historical Market Size Value (USD Million) Trend Analysis By Market Taxonomy, 2020 to 2024
    • Market Size Value (USD Million) Forecast By Market Taxonomy, 2025 to 2035
      • By Country
        • Turkey
        • UAE
        • Saudi Arabia
        • Israel
        • Other GCC Countries
        • North Africa
        • South Africa
      • By Source
      • By Function
      • By Product Type
      • By Channel
      • By Claim
    • Market Attractiveness Analysis
      • By Country
      • By Source
      • By Function
      • By Product Type
      • By Channel
      • By Claim
    • Key Takeaways
  18. Key Countries Analysis
    • USA
      • Pricing Analysis
      • Market Share Analysis, 2024
        • By Source
        • By Function
        • By Product Type
        • By Channel
        • By Claim
    • Canada
      • Pricing Analysis
      • Market Share Analysis, 2024
        • By Source
        • By Function
        • By Product Type
        • By Channel
        • By Claim
    • Mexico
      • Pricing Analysis
      • Market Share Analysis, 2024
        • By Source
        • By Function
        • By Product Type
        • By Channel
        • By Claim
    • Brazil
      • Pricing Analysis
      • Market Share Analysis, 2024
        • By Source
        • By Function
        • By Product Type
        • By Channel
        • By Claim
    • Germany
      • Pricing Analysis
      • Market Share Analysis, 2024
        • By Source
        • By Function
        • By Product Type
        • By Channel
        • By Claim
    • UK
      • Pricing Analysis
      • Market Share Analysis, 2024
        • By Source
        • By Function
        • By Product Type
        • By Channel
        • By Claim
    • Italy
      • Pricing Analysis
      • Market Share Analysis, 2024
        • By Source
        • By Function
        • By Product Type
        • By Channel
        • By Claim
    • Spain
      • Pricing Analysis
      • Market Share Analysis, 2024
        • By Source
        • By Function
        • By Product Type
        • By Channel
        • By Claim
    • France
      • Pricing Analysis
      • Market Share Analysis, 2024
        • By Source
        • By Function
        • By Product Type
        • By Channel
        • By Claim
    • India
      • Pricing Analysis
      • Market Share Analysis, 2024
        • By Source
        • By Function
        • By Product Type
        • By Channel
        • By Claim
    • Australia & New Zealand
      • Pricing Analysis
      • Market Share Analysis, 2024
        • By Source
        • By Function
        • By Product Type
        • By Channel
        • By Claim
    • China
      • Pricing Analysis
      • Market Share Analysis, 2024
        • By Source
        • By Function
        • By Product Type
        • By Channel
        • By Claim
    • Japan
      • Pricing Analysis
      • Market Share Analysis, 2024
        • By Source
        • By Function
        • By Product Type
        • By Channel
        • By Claim
    • South Korea
      • Pricing Analysis
      • Market Share Analysis, 2024
        • By Source
        • By Function
        • By Product Type
        • By Channel
        • By Claim
    • Russia
      • Pricing Analysis
      • Market Share Analysis, 2024
        • By Source
        • By Function
        • By Product Type
        • By Channel
        • By Claim
    • Poland
      • Pricing Analysis
      • Market Share Analysis, 2024
        • By Source
        • By Function
        • By Product Type
        • By Channel
        • By Claim
    • Hungary
      • Pricing Analysis
      • Market Share Analysis, 2024
        • By Source
        • By Function
        • By Product Type
        • By Channel
        • By Claim
    • Kingdom of Saudi Arabia
      • Pricing Analysis
      • Market Share Analysis, 2024
        • By Source
        • By Function
        • By Product Type
        • By Channel
        • By Claim
    • South Africa
      • Pricing Analysis
      • Market Share Analysis, 2024
        • By Source
        • By Function
        • By Product Type
        • By Channel
        • By Claim
  19. Market Structure Analysis
    • Competition Dashboard
    • Competition Benchmarking
    • Market Share Analysis of Top Players
      • By Regional
      • By Source
      • By Function
      • By Product Type
      • By Channel
      • By Claim
  20. Competition Analysis
    • Competition Deep Dive
      • Lipoid
        • Overview
        • Product Portfolio
        • Profitability by Market Segments (Product/Age /Sales Channel/Region)
        • Sales Footprint
        • Strategy Overview
        • Evonik
        • Croda
        • BASF
        • Kewpie
        • Seppic
        • Clariant
        • DSM-Firmenich
        • Ashland
        • Givaudan
  21. Assumptions & Acronyms Used
  22. Research Methodology

List of Tables

  • Table 1: Global Value (USD Million) Forecast by Region, 2020-2035
  • Table 2: Global Value (USD Million) Forecast by Source, 2020-2035
  • Table 3: Global Value (USD Million) Forecast by Function, 2020-2035
  • Table 4: Global Value (USD Million) Forecast by Product Type, 2020-2035
  • Table 5: Global Value (USD Million) Forecast by Channel, 2020-2035
  • Table 6: Global Value (USD Million) Forecast by Claim, 2020-2035
  • Table 7: North America Value (USD Million) Forecast by Country, 2020-2035
  • Table 8: North America Value (USD Million) Forecast by Source, 2020-2035
  • Table 9: North America Value (USD Million) Forecast by Function, 2020-2035
  • Table 10: North America Value (USD Million) Forecast by Product Type, 2020-2035
  • Table 11: North America Value (USD Million) Forecast by Channel, 2020-2035
  • Table 12: North America Value (USD Million) Forecast by Claim, 2020-2035
  • Table 13: Latin America Value (USD Million) Forecast by Country, 2020-2035
  • Table 14: Latin America Value (USD Million) Forecast by Source, 2020-2035
  • Table 15: Latin America Value (USD Million) Forecast by Function, 2020-2035
  • Table 16: Latin America Value (USD Million) Forecast by Product Type, 2020-2035
  • Table 17: Latin America Value (USD Million) Forecast by Channel, 2020-2035
  • Table 18: Latin America Value (USD Million) Forecast by Claim, 2020-2035
  • Table 19: Europe Value (USD Million) Forecast by Country, 2020-2035
  • Table 20: Europe Value (USD Million) Forecast by Source, 2020-2035
  • Table 21: Europe Value (USD Million) Forecast by Function, 2020-2035
  • Table 22: Europe Value (USD Million) Forecast by Product Type, 2020-2035
  • Table 23: Europe Value (USD Million) Forecast by Channel, 2020-2035
  • Table 24: Europe Value (USD Million) Forecast by Claim, 2020-2035
  • Table 25: East Asia Value (USD Million) Forecast by Country, 2020-2035
  • Table 26: East Asia Value (USD Million) Forecast by Source, 2020-2035
  • Table 27: East Asia Value (USD Million) Forecast by Function, 2020-2035
  • Table 28: East Asia Value (USD Million) Forecast by Product Type, 2020-2035
  • Table 29: East Asia Value (USD Million) Forecast by Channel, 2020-2035
  • Table 30: East Asia Value (USD Million) Forecast by Claim, 2020-2035
  • Table 31: South Asia & Pacific Value (USD Million) Forecast by Country, 2020-2035
  • Table 32: South Asia & Pacific Value (USD Million) Forecast by Source, 2020-2035
  • Table 33: South Asia & Pacific Value (USD Million) Forecast by Function, 2020-2035
  • Table 34: South Asia & Pacific Value (USD Million) Forecast by Product Type, 2020-2035
  • Table 35: South Asia & Pacific Value (USD Million) Forecast by Channel, 2020-2035
  • Table 36: South Asia & Pacific Value (USD Million) Forecast by Claim, 2020-2035
  • Table 37: Middle East and Africa Value (USD Million) Forecast by Country, 2020-2035
  • Table 38: Middle East and Africa Value (USD Million) Forecast by Source, 2020-2035
  • Table 39: Middle East and Africa Value (USD Million) Forecast by Function, 2020-2035
  • Table 40: Middle East and Africa Value (USD Million) Forecast by Product Type, 2020-2035
  • Table 41: Middle East and Africa Value (USD Million) Forecast by Channel, 2020-2035
  • Table 42: Middle East and Africa Value (USD Million) Forecast by Claim, 2020-2035

List of Figures

  • Figure 1: Global Pricing Analysis
  • Figure 2: Global Value (USD Million) Forecast 2020-2035
  • Figure 3: Global Value Share and BPS Analysis by Source, 2025 and 2035
  • Figure 4: Global Y-o-Y Growth Comparison by Source, 2025-2035
  • Figure 5: Global Attractiveness Analysis by Source
  • Figure 6: Global Value Share and BPS Analysis by Function, 2025 and 2035
  • Figure 7: Global Y-o-Y Growth Comparison by Function, 2025-2035
  • Figure 8: Global Attractiveness Analysis by Function
  • Figure 9: Global Value Share and BPS Analysis by Product Type, 2025 and 2035
  • Figure 10: Global Y-o-Y Growth Comparison by Product Type, 2025-2035
  • Figure 11: Global Attractiveness Analysis by Product Type
  • Figure 12: Global Value Share and BPS Analysis by Channel, 2025 and 2035
  • Figure 13: Global Y-o-Y Growth Comparison by Channel, 2025-2035
  • Figure 14: Global Attractiveness Analysis by Channel
  • Figure 15: Global Value Share and BPS Analysis by Claim, 2025 and 2035
  • Figure 16: Global Y-o-Y Growth Comparison by Claim, 2025-2035
  • Figure 17: Global Attractiveness Analysis by Claim
  • Figure 18: Global Value (USD Million) Share and BPS Analysis by Region, 2025 and 2035
  • Figure 19: Global Y-o-Y Growth Comparison by Region, 2025-2035
  • Figure 20: Global Attractiveness Analysis by Region
  • Figure 21: North America Incremental $ Opportunity, 2025-2035
  • Figure 22: Latin America Incremental $ Opportunity, 2025-2035
  • Figure 23: Europe Incremental $ Opportunity, 2025-2035
  • Figure 24: East Asia Incremental $ Opportunity, 2025-2035
  • Figure 25: South Asia & Pacific Incremental $ Opportunity, 2025-2035
  • Figure 26: Middle East and Africa Incremental $ Opportunity, 2025-2035
  • Figure 27: North America Value Share and BPS Analysis by Country, 2025 and 2035
  • Figure 28: North America Value Share and BPS Analysis by Source, 2025 and 2035
  • Figure 29: North America Y-o-Y Growth Comparison by Source, 2025-2035
  • Figure 30: North America Attractiveness Analysis by Source
  • Figure 31: North America Value Share and BPS Analysis by Function, 2025 and 2035
  • Figure 32: North America Y-o-Y Growth Comparison by Function, 2025-2035
  • Figure 33: North America Attractiveness Analysis by Function
  • Figure 34: North America Value Share and BPS Analysis by Product Type, 2025 and 2035
  • Figure 35: North America Y-o-Y Growth Comparison by Product Type, 2025-2035
  • Figure 36: North America Attractiveness Analysis by Product Type
  • Figure 37: North America Value Share and BPS Analysis by Channel, 2025 and 2035
  • Figure 38: North America Y-o-Y Growth Comparison by Channel, 2025-2035
  • Figure 39: North America Attractiveness Analysis by Channel
  • Figure 40: North America Value Share and BPS Analysis by Claim, 2025 and 2035
  • Figure 41: North America Y-o-Y Growth Comparison by Claim, 2025-2035
  • Figure 42: North America Attractiveness Analysis by Claim
  • Figure 43: Latin America Value Share and BPS Analysis by Country, 2025 and 2035
  • Figure 44: Latin America Value Share and BPS Analysis by Source, 2025 and 2035
  • Figure 45: Latin America Y-o-Y Growth Comparison by Source, 2025-2035
  • Figure 46: Latin America Attractiveness Analysis by Source
  • Figure 47: Latin America Value Share and BPS Analysis by Function, 2025 and 2035
  • Figure 48: Latin America Y-o-Y Growth Comparison by Function, 2025-2035
  • Figure 49: Latin America Attractiveness Analysis by Function
  • Figure 50: Latin America Value Share and BPS Analysis by Product Type, 2025 and 2035
  • Figure 51: Latin America Y-o-Y Growth Comparison by Product Type, 2025-2035
  • Figure 52: Latin America Attractiveness Analysis by Product Type
  • Figure 53: Latin America Value Share and BPS Analysis by Channel, 2025 and 2035
  • Figure 54: Latin America Y-o-Y Growth Comparison by Channel, 2025-2035
  • Figure 55: Latin America Attractiveness Analysis by Channel
  • Figure 56: Latin America Value Share and BPS Analysis by Claim, 2025 and 2035
  • Figure 57: Latin America Y-o-Y Growth Comparison by Claim, 2025-2035
  • Figure 58: Latin America Attractiveness Analysis by Claim
  • Figure 59: Europe Value Share and BPS Analysis by Country, 2025 and 2035
  • Figure 60: Europe Value Share and BPS Analysis by Source, 2025 and 2035
  • Figure 61: Europe Y-o-Y Growth Comparison by Source, 2025-2035
  • Figure 62: Europe Attractiveness Analysis by Source
  • Figure 63: Europe Value Share and BPS Analysis by Function, 2025 and 2035
  • Figure 64: Europe Y-o-Y Growth Comparison by Function, 2025-2035
  • Figure 65: Europe Attractiveness Analysis by Function
  • Figure 66: Europe Value Share and BPS Analysis by Product Type, 2025 and 2035
  • Figure 67: Europe Y-o-Y Growth Comparison by Product Type, 2025-2035
  • Figure 68: Europe Attractiveness Analysis by Product Type
  • Figure 69: Europe Value Share and BPS Analysis by Channel, 2025 and 2035
  • Figure 70: Europe Y-o-Y Growth Comparison by Channel, 2025-2035
  • Figure 71: Europe Attractiveness Analysis by Channel
  • Figure 72: Europe Value Share and BPS Analysis by Claim, 2025 and 2035
  • Figure 73: Europe Y-o-Y Growth Comparison by Claim, 2025-2035
  • Figure 74: Europe Attractiveness Analysis by Claim
  • Figure 75: East Asia Value Share and BPS Analysis by Country, 2025 and 2035
  • Figure 76: East Asia Value Share and BPS Analysis by Source, 2025 and 2035
  • Figure 77: East Asia Y-o-Y Growth Comparison by Source, 2025-2035
  • Figure 78: East Asia Attractiveness Analysis by Source
  • Figure 79: East Asia Value Share and BPS Analysis by Function, 2025 and 2035
  • Figure 80: East Asia Y-o-Y Growth Comparison by Function, 2025-2035
  • Figure 81: East Asia Attractiveness Analysis by Function
  • Figure 82: East Asia Value Share and BPS Analysis by Product Type, 2025 and 2035
  • Figure 83: East Asia Y-o-Y Growth Comparison by Product Type, 2025-2035
  • Figure 84: East Asia Attractiveness Analysis by Product Type
  • Figure 85: East Asia Value Share and BPS Analysis by Channel, 2025 and 2035
  • Figure 86: East Asia Y-o-Y Growth Comparison by Channel, 2025-2035
  • Figure 87: East Asia Attractiveness Analysis by Channel
  • Figure 88: East Asia Value Share and BPS Analysis by Claim, 2025 and 2035
  • Figure 89: East Asia Y-o-Y Growth Comparison by Claim, 2025-2035
  • Figure 90: East Asia Attractiveness Analysis by Claim
  • Figure 91: South Asia & Pacific Value Share and BPS Analysis by Country, 2025 and 2035
  • Figure 92: South Asia & Pacific Value Share and BPS Analysis by Source, 2025 and 2035
  • Figure 93: South Asia & Pacific Y-o-Y Growth Comparison by Source, 2025-2035
  • Figure 94: South Asia & Pacific Attractiveness Analysis by Source
  • Figure 95: South Asia & Pacific Value Share and BPS Analysis by Function, 2025 and 2035
  • Figure 96: South Asia & Pacific Y-o-Y Growth Comparison by Function, 2025-2035
  • Figure 97: South Asia & Pacific Attractiveness Analysis by Function
  • Figure 98: South Asia & Pacific Value Share and BPS Analysis by Product Type, 2025 and 2035
  • Figure 99: South Asia & Pacific Y-o-Y Growth Comparison by Product Type, 2025-2035
  • Figure 100: South Asia & Pacific Attractiveness Analysis by Product Type
  • Figure 101: South Asia & Pacific Value Share and BPS Analysis by Channel, 2025 and 2035
  • Figure 102: South Asia & Pacific Y-o-Y Growth Comparison by Channel, 2025-2035
  • Figure 103: South Asia & Pacific Attractiveness Analysis by Channel
  • Figure 104: South Asia & Pacific Value Share and BPS Analysis by Claim, 2025 and 2035
  • Figure 105: South Asia & Pacific Y-o-Y Growth Comparison by Claim, 2025-2035
  • Figure 106: South Asia & Pacific Attractiveness Analysis by Claim
  • Figure 107: Middle East and Africa Value Share and BPS Analysis by Country, 2025 and 2035
  • Figure 108: Middle East and Africa Value Share and BPS Analysis by Source, 2025 and 2035
  • Figure 109: Middle East and Africa Y-o-Y Growth Comparison by Source, 2025-2035
  • Figure 110: Middle East and Africa Attractiveness Analysis by Source
  • Figure 111: Middle East and Africa Value Share and BPS Analysis by Function, 2025 and 2035
  • Figure 112: Middle East and Africa Y-o-Y Growth Comparison by Function, 2025-2035
  • Figure 113: Middle East and Africa Attractiveness Analysis by Function
  • Figure 114: Middle East and Africa Value Share and BPS Analysis by Product Type, 2025 and 2035
  • Figure 115: Middle East and Africa Y-o-Y Growth Comparison by Product Type, 2025-2035
  • Figure 116: Middle East and Africa Attractiveness Analysis by Product Type
  • Figure 117: Middle East and Africa Value Share and BPS Analysis by Channel, 2025 and 2035
  • Figure 118: Middle East and Africa Y-o-Y Growth Comparison by Channel, 2025-2035
  • Figure 119: Middle East and Africa Attractiveness Analysis by Channel
  • Figure 120: Middle East and Africa Value Share and BPS Analysis by Claim, 2025 and 2035
  • Figure 121: Middle East and Africa Y-o-Y Growth Comparison by Claim, 2025-2035
  • Figure 122: Middle East and Africa Attractiveness Analysis by Claim
  • Figure 123: Global - Tier Structure Analysis
  • Figure 124: Global - Company Share Analysis

Frequently Asked Questions

How big is the Skin-Barrier Strengthening Phospholipids Market in 2025?

The global Skin-Barrier Strengthening Phospholipids Market is estimated to be valued at USD 1,400.1 million in 2025.

What will be the size of Skin-Barrier Strengthening Phospholipids Market in 2035?

The market size for the Skin-Barrier Strengthening Phospholipids Market is projected to reach USD 4,800.3 million by 2035.

How much will be the Skin-Barrier Strengthening Phospholipids Market growth between 2025 and 2035?

The Skin-Barrier Strengthening Phospholipids Market is expected to grow at a 13.1% CAGR between 2025 and 2035.

What are the key product types in the Skin-Barrier Strengthening Phospholipids Market?

The key product types in the Skin-Barrier Strengthening Phospholipids Market are creams/lotions, serums, masks, and oils.

Which range segment to contribute significant share in the Skin-Barrier Strengthening Phospholipids Market in 2025?

In terms of claims rather than scanner ranges, the natural/organic segment commands a 51.7% share in 2025.

Explore Similar Insights

Future Market Insights

Skin-Barrier Strengthening Phospholipids Market

Chat With

MaRIA

Hi There, I am MaRIA, Your Market Research Intelligence Assistant. How may I help you?