Methodology

Skin Health Supplement Market Forecast and Outlook 2025 to 2035

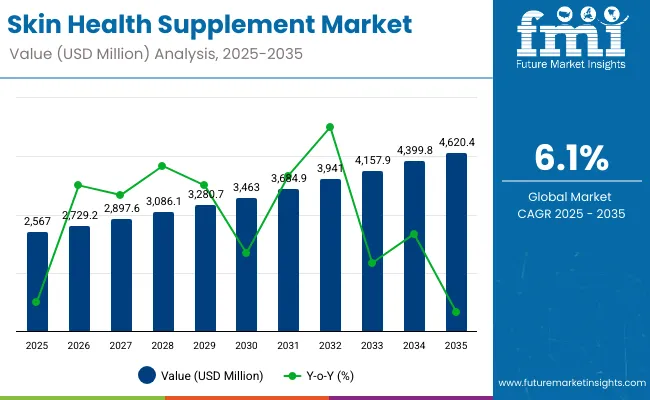
The skin health supplement market enters a decade of measured expansion that will transform wellness and beauty applications across nutraceutical, cosmeceutical, and functional food sectors. The market's progression from USD 2,567 million in 2025 to USD 4,620.4 million by 2035 represents controlled growth, reflecting the accelerated adoption of beauty-from-within concepts and dermatological wellness technology across consumer health systems, personal care applications, and therapeutic wellness operations worldwide.

The first half of the decade (2025-2030) will witness the market climbing from USD 2,567 million to approximately USD 3,463.0 million, adding USD 896.0 million in value, which constitutes 44% of the total forecast growth period. This phase will be characterized by the continued adoption of collagen-based formulations and antioxidant systems, driven by increasing consumer health awareness and the growing need for comprehensive skin wellness solutions in beauty and health applications globally. Enhanced bioavailability technology and targeted delivery systems will become standard expectations rather than premium options.
Quick Stats for Skin Health Supplement Market

  • Skin Health Supplement Market Value (2025): USD 2,567 million
  • Skin Health Supplement Market Forecast Value (2035): USD 4,620.4 million
  • Skin Health Supplement Market Forecast CAGR: 6.1%
  • Leading Product Type in Skin Health Supplement Market: Collagen-Based Segment
  • Key Growth Regions in Skin Health Supplement Market: Europe, South Asia Pacific, and East Asia
  • Top Players in Skin Health Supplement Market: Amway, Shiseido, Blackmores, Herbalife Nutrition

Skin Health Supplement Market

The latter half (2030-2035) will witness continued growth from USD 3,463 million to USD 4,620.4 million, representing an addition of USD 1,157.4 million or 56% of the decade's expansion. This period will be defined by mass market penetration of specialized skin wellness applications, integration with comprehensive health monitoring platforms, and seamless compatibility with existing beauty and wellness infrastructure. The market trajectory signals fundamental shifts in how consumers approach skin health management and wellness operations, with participants positioned to benefit from growing demand across multiple application segments and distribution channels.

Skin health supplement formulations encompass sophisticated bioactive delivery systems coordinating collagen synthesis, antioxidant protection, and nutrient absorption across diverse wellness and beauty applications. Collagen-based products demonstrate superior bioavailability through hydrolyzed peptide structures providing molecular weights between 2,000-5,000 daltons for optimal absorption characteristics. Manufacturing processes utilize advanced extraction and purification techniques maintaining bioactive compound integrity while ensuring product stability and efficacy throughout shelf life requirements.

Nutraceutical applications drive primary market demand through requirements for anti-aging benefits, hydration enhancement, and skin barrier optimization requiring consistent bioavailability and reliable therapeutic outcomes. Marine collagen formulations provide Type I collagen concentrations supporting dermal structure while maintaining compatibility with various delivery formats. Antioxidant complexes incorporate vitamin C, vitamin E, and polyphenol compounds providing cellular protection against oxidative stress and environmental damage.

Cosmeceutical applications leverage targeted ingredient combinations delivering visible skin improvements through oral supplementation systems. Premium positioning strategies emphasize clinical validation, dermatologist recommendations, and specialized health benefits justifying higher pricing compared to conventional beauty products. Processing innovations include microencapsulation technology, sustained-release formulations, and synergistic ingredient combinations ensuring optimal bioactive delivery and consumer satisfaction.

Skin Health Supplement Market Key Takeaways

At-a-Glance Metrics

Metric Value
Market Value (2025) USD 2,567.0 million
Market Forecast (2035) USD 4,620.4 million
Growth Rate 6.1% CAGR
Leading Product Type Collagen-Based Segment
Primary Application Nutraceuticals Channel

The market demonstrates strong fundamentals with collagen-based formulations capturing a dominant share through reliable bioactive capabilities and wellness optimization. Nutraceutical applications drive primary demand, supported by increasing beauty awareness requirements and operational health development. Geographic expansion remains concentrated in developed markets with established wellness infrastructure, while emerging economies show accelerating adoption rates driven by beauty modernization initiatives and rising health accessibility standards.

Imperatives for Stakeholders in Skin Health Supplement Market

Design for wellness versatility, not just ingredient content

  • Offer complete beauty packages: supplement supply + wellness systems + monitoring solutions + nutritional guidance + health support.
  • Preconfigured workflows: wellness schedules, supplement regimens, health protocols, and digital monitoring on beauty operations.

Technology readiness for Beauty 4.0

  • Real-time wellness monitoring analytics, predictive health capabilities, and smart beauty integration (IoT connectivity, health tracking systems).

Wellness-by-design approach

  • Automated health monitoring systems, real-time wellness tracking, certified beauty solutions, and paperless health documentation.

Value-based wellness models

  • Clear base supplement price + transparent health tiers (wellness support, ingredient availability, health guarantees); subscriptions for digital services and analytics.

Segmental Analysis

Primary Classification: The market segments by product type into collagen-based antioxidants vitamins & minerals, herbal/botanical extracts, fatty acids, carotenoids and probiotic-based representing the evolution from basic wellness methods to specialized supplement applications for comprehensive skin health and beauty optimization.

Secondary Classification: Ingredient segmentation divides the market into collagen, vitamin C/E/biotin/zinc/selenium, omega-3/omega-6, carotenoids, hyaluronic acid polyphenols, and probiotics, reflecting distinct requirements for bioactivity efficiency, health reliability, and wellness processing infrastructure standards.

Tertiary Classification: Format segmentation covers capsules, tablets, gummies, powders, liquids/shots, and softgels, demonstrating varied delivery requirements and consumer preference standards.

The segmentation structure reveals technology progression from standard wellness methods toward specialized supplement applications with enhanced bioactivity consistency and health capabilities, while application diversity spans from beauty enhancement to therapeutic wellness requiring precise ingredient solutions.
By Product Type, the Collagen-Based Segment Accounts for Dominant Market Share

Skin Health Supplement Market By Product Type

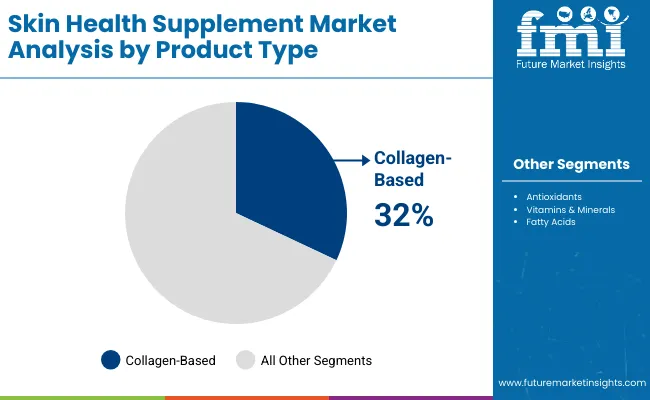
Market Position: Collagen-based formulations command the leading position in the skin health supplement market with 32% market share through advanced bioactive features, including superior absorption characteristics, operational efficiency, and wellness optimization that enable consumers to achieve optimal skin health across diverse beauty and wellness applications.

Value Drivers: The segment benefits from consumer preference for proven bioactive ingredients that provide consistent performance characteristics, reduced wellness complexity, and operational efficiency optimization without requiring significant lifestyle modifications. Advanced formulation features enable automated wellness monitoring systems, health tracking, and integration with existing beauty routines, where operational performance and health compliance represent critical consumer requirements.

Competitive Advantages: Collagen-based formulations differentiate through proven bioactive reliability, consistent wellness characteristics, and integration with automated health management systems that enhance skin effectiveness while maintaining optimal beauty standards for diverse wellness and beauty applications.

Key market characteristics:

  • Advanced peptide designs with optimized absorption configuration and operational efficiency capabilities
  • Enhanced bioactive effectiveness, enabling bioavailability consistency with reliable wellness performance
  • Beauty routine compatibility, including automated monitoring systems, health integration, and process optimization for wellness control

Herbal/Botanical Extracts Applications Show Natural Market Growth

Herbal/botanical extracts maintain a 16% market position in the skin health supplement market due to their enhanced natural properties and wellness application characteristics. These systems appeal to consumers requiring specialized performance with premium positioning for beauty and health applications. Market growth is driven by wellness segment expansion, emphasizing natural beauty solutions and operational efficiency through optimized botanical designs.

Antioxidant Applications Demonstrate Protection Focus

Antioxidant formulations capture 14% market share through specialized protection requirements in anti-aging operations, cellular health applications, and wellness products. These operations demand certified bioactive systems capable of operating with beauty routines while providing effective protection integration and health performance capabilities.
By Ingredient, Collagen Systems Show Market Leadership

Skin Health Supplement Market By Ingredient

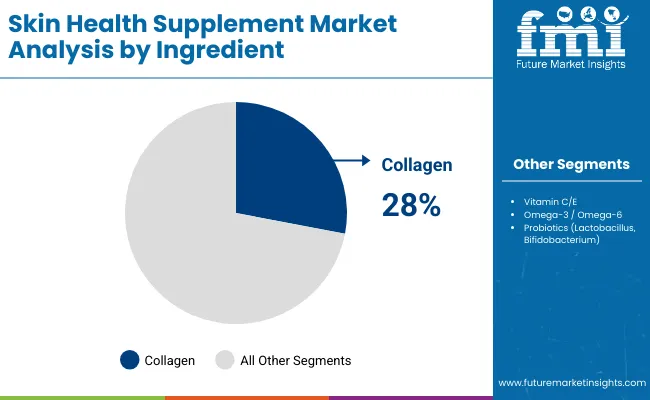
Market Context: Collagen ingredients demonstrate market leadership in the skin health supplement market with 28% share due to widespread adoption of bioactive wellness systems and increasing focus on operational cost efficiency, beauty processing optimization, and health applications that maximize wellness while maintaining beauty standards.

Appeal Factors: Beauty consumers prioritize ingredient consistency, operational efficiency, and integration with existing wellness infrastructure that enables coordinated beauty operations across multiple health applications. The segment benefits from substantial wellness investment and modernization programs that emphasize the acquisition of collagen-based systems for beauty optimization and health efficiency applications.

Growth Drivers: Wellness facility expansion programs incorporate collagen ingredients as standard components for beauty operations, while health growth increases demand for consistent bioactive capabilities that comply with wellness standards and minimize beauty complexity.

Vitamin/Mineral Complexes Maintain Nutritional Support

Vitamin/mineral complexes capture 18% market share through comprehensive nutritional requirements in beauty enhancement, wellness support, and health applications requiring reliable nutrient ingredients capable of operating within beauty routines while providing effective health integration and wellness performance capabilities.

Polyphenol Systems Show Antioxidant Growth

Polyphenol ingredients account for 12% market share, including cellular protection, anti-aging applications, and health wellness requiring specialized antioxidant solutions for beauty optimization and health accessibility.
By Format, Capsules Format Shows Market Leadership

Skin Health Supplement Market By Format

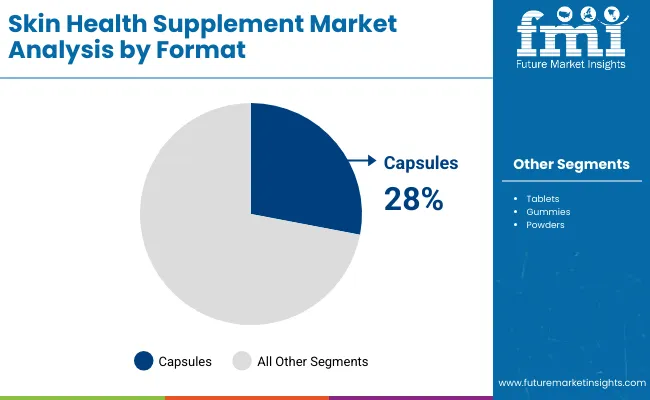
Market Context: Capsule formats demonstrate market leadership in the skin health supplement market with 28% share due to widespread adoption of convenient delivery systems and increasing focus on consumer accessibility, wellness flexibility, and health applications that maximize convenience while maintaining bioactive standards.

Appeal Factors: Health consumers prioritize delivery convenience, operational flexibility, and integration with existing wellness infrastructure that enables coordinated health operations across multiple beauty applications. The segment benefits from substantial format investment and modernization programs that emphasize the acquisition of capsule-based systems for wellness optimization and health accessibility applications.

Growth Drivers: Consumer wellness expansion programs incorporate capsule formats as standard delivery for health operations, while beauty growth increases demand for consistent delivery capabilities that comply with wellness standards and minimize consumption complexity.

Application dynamics include:

  • Strong growth in consumer wellness and health operations requiring reliable bioactive capabilities
  • Increasing adoption in beauty optimization and operational efficiency applications for consumers
  • Rising integration with automated wellness systems for operational optimization and health assurance

Gummies Format Maintains Consumer Appeal

Gummies formats capture 22% market share through comprehensive taste requirements in consumer wellness, beauty applications, and convenience products. These operations demand appealing delivery systems capable of handling bioactive ingredients while providing effective consumer experience and health performance capabilities.

Tablets Format Shows Traditional Growth

Tablet formats account for 18% market share, including clinical applications, therapeutic wellness, and professional health requiring traditional delivery solutions for wellness optimization and bioactive accessibility.

What are the Drivers, Restraints, and Key Trends of the Skin Health Supplement Market?

Category Factor Impact Why It Matters
Driver Beauty awareness growth & wellness demand (anti- aging requirements, skin health standards) ★★★★★ Large-scale beauty markets require efficient, reliable wellness solutions with consistent performance and health compliance across consumer applications.
Driver Aging population expansion & health consciousness ★★★★★ Drives demand for specialized wellness solutions and high-efficacy bioactive capabilities; suppliers providing clinical-grade ingredients gain competitive advantage.
Driver Social media influence & beauty trends (influencer marketing, wellness lifestyle) ★★★★☆ Consumer markets need accessible beauty solutions; demand for convenient formats expanding addressable market segments.
Restraint Regulatory complexity & ingredient approval requirements ★★★★☆ Small brands face compliance pressure; increases cost sensitivity and affects ingredient consistency in budget-sensitive markets.
Restraint Topical beauty competition & alternative wellness methods ★★★☆☆ Price-focused applications face challenges with ingredient selection and wellness requirements, limiting adoption in cost-sensitive segments.
Trend Personalized nutrition & targeted wellness (custom formulations, individual health profiles) ★★★★★ Growing demand for personalized wellness solutions; custom formulation becomes core value proposition in health-focused segments.
Trend Asian market expansion & regional beauty growth ★★★★☆ Regional wellness development drives demand for local beauty solutions; regional bioactive capabilities drive competition toward localization.

Analysis of the Skin Health Supplement Market by Key Country

The skin health supplement market demonstrates varied regional dynamics with growth leaders including France (6.9% growth rate) and UK (6.6% growth rate) driving expansion through beauty initiatives and wellness capacity development. Steady Performers encompass Germany (6.4% growth rate), China (6.3% growth rate), and India (6.0% growth rate), benefiting from established beauty industries and advanced wellness adoption. Mature Markets feature USA (5.3% growth rate) and Brazil (1.2% growth rate), where wellness technology advancement and consumer requirements support consistent growth patterns.

Regional synthesis reveals European and Asian markets leading adoption through beauty expansion and wellness development, while North American countries maintain steady expansion supported by technology advancement and regulatory requirements. Emerging markets show strong growth driven by beauty applications and wellness modernization trends.
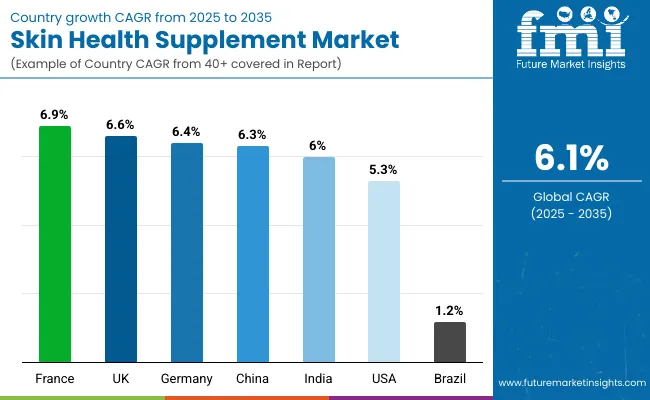
Country Wise Analysis Skin Health Supplement Market

Region/Country 2025-2035 Growth How to win What to watch out
France 6.9% Premium beauty positioning Facility precision; regulatory compliance
UK 6.6% Provide comprehensive wellness services Brexit impacts; regulatory requirements
Germany 6.4% Premium quality positioning Over-specification; regulatory compliance
China 6.3% Lead with high-volume wellness systems Quality regulations; facility complexity
India 6.0% Focus on cost-effective beauty solutions Infrastructure challenges; distribution availability
USA 5.3% Provide health-compliant applications FDA regulations; facility requirements
Brazil 1.2% Push regional integration solutions Economic conditions; infrastructure costs

France Drives Premium Beauty Growth

France establishes premium beauty growth through comprehensive wellness programs and advanced beauty infrastructure, integrating skin health supplements across consumer wellness facilities and beauty applications. The country's 6.9% growth rate reflects mature beauty industry relationships and established wellness adoption that supports widespread use of bioactive systems in beauty facilities and health-compliant operations. Growth concentrates in major beauty centers, including Paris, Lyon, and Marseille, where beauty technology showcases mature supplement deployment that appeals to consumers seeking proven wellness capabilities and operational beauty applications.

French distributors leverage established distribution networks and comprehensive beauty capabilities, including wellness programs and technical support that create customer relationships and operational advantages. The market benefits from mature beauty standards and EU requirements that support supplement system use while supporting technology advancement and operational optimization. Distribution channels through beauty retailers and wellness service distributors expand market access, while regulatory support for beauty development supports adoption across diverse consumer segments.

UK Shows Comprehensive Wellness Services

In London, Manchester, and Birmingham regions, wellness facilities and beauty operations are implementing advanced skin health supplements as standard components for beauty optimization and operational wellness enhancement, driven by increasing consumer beauty investment and wellness modernization programs that emphasize the importance of bioactive capabilities. The market holds a 6.6% growth rate, supported by beauty initiatives and wellness development programs that promote advanced bioactive systems for beauty facilities. British operators are adopting wellness systems that provide consistent operational performance and beauty compliance features, appealing in beauty regions where wellness efficiency and health standards represent critical operational requirements.

Market expansion benefits from growing beauty processing capabilities and wellness integration agreements that enable domestic production of advanced supplement systems for beauty applications. Technology adoption follows patterns established in wellness equipment, where efficiency and performance drive consumer decisions and operational deployment. British distributors leverage beauty capabilities and comprehensive wellness expertise, including supply programs and technical support that create customer relationships and operational advantages. The market benefits from established beauty standards and regulatory requirements that support wellness system use while supporting technology advancement and operational optimization.

Germany Demonstrates Premium Quality Focus

Germany's advanced wellness technology market demonstrates sophisticated skin health supplement integration with documented operational effectiveness in premium beauty applications and modern wellness installations through integration with existing quality systems and beauty infrastructure. The country maintains a 6.4% growth rate, leveraging traditional quality expertise and precision systems integration in wellness technology. Beauty centers, including North Rhine-Westphalia, Bavaria, and Baden-Württemberg, showcase premium installations where supplement systems integrate with traditional quality platforms and modern wellness management systems to optimize beauty operations and maintain wellness quality profiles.

German distributors prioritize wellness precision and quality consistency in supplement development, creating demand for premium systems with advanced features, including quality monitoring and automated wellness systems. The market benefits from established quality infrastructure and commitment to beauty standards that provide long-term operational benefits and compliance with traditional quality wellness methods.

China Emerges as High-Volume Market

China establishes high-volume market development through comprehensive beauty programs and expanding wellness infrastructure, integrating skin health supplements across consumer wellness facilities and beauty applications. The country's 6.3% growth rate reflects growing beauty industry relationships and increasing wellness adoption that supports expanding use of bioactive systems in Chinese beauty facilities. Growth concentrates in major beauty centers, including Shanghai, Beijing, and Guangzhou, where wellness technology development showcases integrated supplement systems that appeal to Chinese consumers seeking advanced beauty capabilities and operational wellness applications.

Chinese distributors are developing high-volume wellness solutions that combine domestic distribution advantages with advanced operational features, including automated delivery systems and enhanced reliability capabilities. Distribution channels through beauty suppliers and wellness service distributors expand market access, while government support for beauty development supports adoption across diverse consumer segments.
India Shows Cost-Effective Beauty Development

India establishes cost-effective beauty development through aggressive wellness programs and comprehensive beauty capacity development, integrating advanced skin health supplement distribution as standard components in consumer beauty and wellness facility installations. The country's 6.0% growth rate reflects government initiatives promoting beauty modernization and wellness development capabilities that mandate the use of bioactive systems in beauty facilities. Growth concentrates in major wellness centers, including Mumbai, Delhi, and Bangalore, where beauty technology development showcases integrated supplement systems that appeal to consumers seeking advanced wellness capabilities and operational beauty applications.

Indian distributors are developing cost-effective beauty solutions that combine domestic distribution advantages with advanced operational features, including automated delivery systems and enhanced reliability capabilities. Distribution channels through wellness suppliers and beauty service distributors expand market access, while government support for beauty development supports adoption across diverse consumer segments.

USA Shows Health-Compliant Market Development

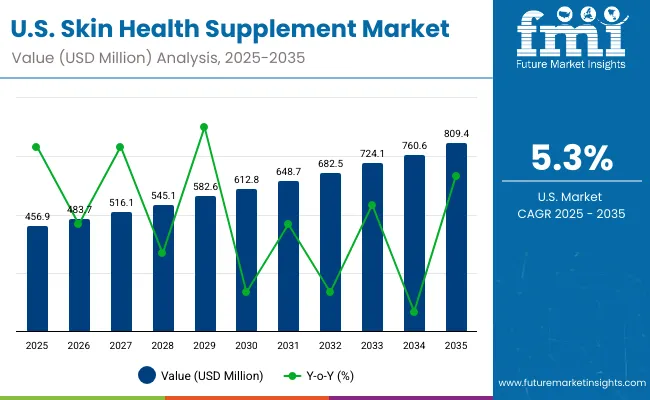
Usa Skin Health Supplement Market

USA establishes health-compliant market development through comprehensive wellness programs and established health infrastructure, integrating skin health supplements across consumer wellness facilities and beauty applications. The country's 5.3% growth rate reflects mature wellness industry relationships and established beauty adoption that supports widespread use of bioactive systems in beauty facilities and health-compliant operations. Growth concentrates in major wellness centers, including California, New York, and Florida, where beauty technology showcases mature supplement deployment that appeals to consumers seeking proven health capabilities and operational beauty applications.

American distributors leverage established distribution networks and comprehensive wellness capabilities, including compliance programs and technical support that create customer relationships and operational advantages. The market benefits from mature health standards and FDA requirements that support bioactive system use while supporting technology advancement and operational optimization.

Brazil Shows Regional Integration Development

Brazil establishes regional integration development through beauty modernization and technology adoption, integrating skin health supplements across wellness facilities and regional beauty applications. The country's 1.2% growth rate reflects economic challenges and regional beauty investment that supports limited expansion of bioactive systems in Brazilian beauty facilities. Growth concentrates in major beauty areas, including São Paulo, Rio de Janeiro, and Belo Horizonte, where wellness technology development showcases regional supplement systems that appeal to Brazilian consumers seeking cost-effective solutions with beauty compatibility.

Brazilian distributors focus on maintaining regional standards while adopting wellness efficiency, creating demand for systems that balance performance with economic advantages. The market benefits from regional beauty infrastructure and growing wellness opportunities that support supplement technology adoption while maintaining economic standards important to Brazilian beauty applications.
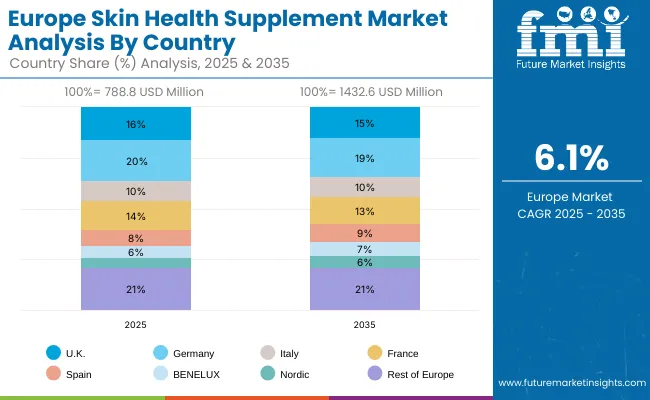
Europe Market Split by Country

Europe Skin Health Supplement Market

The European skin health supplement market is projected to represent a significant portion of global consumption, with strong regional distribution across major economies. Germany is expected to maintain its leadership position with USD 157.5 million in 2025, accounting for 22.5% European market share, supported by its advanced wellness infrastructure and major beauty centers.

United Kingdom follows with USD 126.0 million, representing 16% European market share in 2025, driven by comprehensive beauty programs and wellness technology development initiatives. France holds USD 110.3 million through specialized beauty applications and wellness compliance requirements. Italy commands USD 78.8 million, while Spain accounts for USD 63.0 million in 2025. The rest of Europe region maintains USD 165.4 million, attributed to increasing supplement system adoption in Nordic countries and emerging beauty facilities implementing wellness modernization programs.

Competitive Landscape of the Skin Health Supplement Market

  • Leadership is maintained through: global distribution networks, specialized wellness systems, and regional service capabilities (multi-application versatility + health support + beauty compliance).
  • What's commoditizing: standard supplement supply and basic wellness systems.
  • Margin Opportunities: specialized beauty applications, IoT-enabled monitoring, and comprehensive service contracts (predictive delivery, wellness management, compliance documentation).
Stakeholder What they actually control Typical strengths Typical blind spots
Global platforms Distribution networks, broad wellness portfolios, manufacturing facilities Proven reliability, multi-region support, comprehensive service Technology refresh cycles; customer lock-in dependency
Technology innovators R&D capabilities; advanced wellness systems; digital interfaces Latest technology first; attractive ROI on specialized applications Service density outside core regions; customization complexity
Regional specialists Local sourcing, fast delivery, nearby technical support "Close to site" support; pragmatic pricing; local regulations Technology gaps; talent retention in wellness science
Application-focused ecosystems Industry expertise, technical support, specialized solutions Lowest application variation; comprehensive industry support Scaling costs if overpromised; technology obsolescence
Service specialists Delivery programs, wellness supply, technical training Win service-intensive applications; flexible support Scalability limitations; narrow market focus

Key Players in the Skin Health Supplement Market

  • Nestlé Health Science (Vital Proteins, GlowSweet)
  • Amway (Nutrilite)
  • Shiseido (The Collagen)
  • Blackmores
  • Herbalife Nutrition

Scope of the Report

Items Values
Quantitative Units (2025) USD 2,567 million
Product Type Collagen-Based, Antioxidants, Vitamins & Minerals, Fatty Acids, Carotenoids, Herbal/Botanical Extracts, Probiotic-Based
Ingredient Collagen (Type I, Type II, Marine, Bovine), Vitamin C/E/Biotin/Zinc/Selenium, Omega-3/Omega-6, Lycopene/Beta-Carotene/Lutein, Hyaluronic Acid, Polyphenols (Green Tea, Grape Seed), Probiotics (Lactobacillus, Bifidobacterium)
Format Capsules, Tablets, Gummies, Powders, Liquids/Shots, Softgels
Function/Claim Anti-Aging, Acne Control, Hydration & Elasticity, Skin Brightening, UV Protection, Wound Healing/Repair
Target Consumer Women, Men, Teenagers, Seniors, Dermatology Patients
Distribution Channel Pharmacies/Drugstores, Health & Beauty Retail Stores, Online Channels, Supermarkets/Hypermarkets, Direct-to-Consumer (D2C)
Application Nutraceuticals, Cosmeceuticals, Functional Beverages, Nutricosmetics
Regions Covered East Asia, Western Europe, South Asia Pacific, North America, Latin America, Middle East & Africa
Countries Covered China, Germany, United States, Japan, India, South Korea, France, United Kingdom, Brazil, and 25+ additional countries
Key Companies Profiled Nestlé Health Science, Amway, Shiseido, Blackmores, Herbalife Nutrition, Unilever, L'Oréal Nutricosmetics, Nature's Bounty
Additional Attributes Dollar sales by product type and ingredient categories, regional adoption trends across East Asia, Western Europe, and South Asia Pacific, competitive landscape with wellness suppliers and service providers, consumer preferences for beauty consistency and operational reliability, integration with wellness platforms and health monitoring systems.

Skin Health Supplement Market by Segments

Product Type:

  • Collagen-Based
  • Antioxidants
  • Vitamins & Minerals
  • Fatty Acids
  • Carotenoids
  • Herbal/Botanical Extracts
  • Probiotic-Based

Ingredient:

  • Collagen (Type I, Type II, Marine, Bovine)
  • Vitamin C, Vitamin E, Biotin, Zinc, Selenium
  • Omega-3, Omega-6
  • Lycopene, Beta-Carotene, Lutein
  • Hyaluronic Acid
  • Polyphenols (Green Tea, Grape Seed)
  • Probiotics (Lactobacillus, Bifidobacterium)

Format:

  • Capsules
  • Tablets
  • Gummies
  • Powders
  • Liquids/Shots
  • Softgels

Function/Claim:

  • Anti-Aging
  • Acne Control
  • Hydration & Elasticity
  • Skin Brightening
  • UV Protection
  • Wound Healing/Repair

Target Consumer:

  • Women
  • Men
  • Teenagers
  • Seniors
  • Dermatology Patients

Distribution Channel:

  • Pharmacies/Drugstores
  • Health & Beauty Retail Stores
  • Online Channels
  • Supermarkets/Hypermarkets
  • Direct-to-Consumer (D2C)

Application:

  • Nutraceuticals
  • Cosmeceuticals
  • Functional Beverages
  • Nutricosmetics

Region:

  • East Asia
    • China
    • Japan
    • South Korea
  • South Asia Pacific
    • India
    • ASEAN
    • Australia & New Zealand
    • Rest of South Asia Pacific
  • Western Europe
    • Germany
    • France
    • United Kingdom
    • Italy
    • Spain
    • Rest of Western Europe
  • North America
    • United States
    • Canada
    • Mexico
  • Latin America
    • Brazil
    • Rest of Latin America
  • Middle East & Africa
    • GCC Countries
    • South Africa
    • Rest of Middle East & Africa

Frequently Asked Questions

What is the current value of the skin health supplement market?

The global skin health supplement market is valued at approximately USD 2,567 million in 2025.

How fast is the skin health supplement market expected to grow?

The market is forecast to reach USD 4,620.4 million by 2035, expanding at a CAGR of 6.1% over 2025 to 2035.

Which product type holds the largest share in the skin health supplement market?

Collagen-based formulations account for the leading share at around 32% of global revenue, driven by strong demand for clinically supported anti-aging and skin-strengthening benefits.

Which format is most preferred for skin health supplements?

Capsules represent the leading delivery format with roughly 28% share, followed by gummies and tablets, reflecting the need for convenient, compliant, and dosage-consistent intake.

Which applications drive most of the demand for skin health supplements?

Nutraceutical applications dominate market demand, supported by rising consumer adoption of beauty-from-within solutions, anti-aging regimens, and daily skin wellness protocols.

Which regions are emerging as key growth hubs for skin health supplements?

Europe, South Asia Pacific, and East Asia are the key growth regions, with countries such as France, the United Kingdom, Germany, China, India, and Japan driving adoption through strong beauty cultures, expanding wellness infrastructure, and rising penetration of nutricosmetics.

Table of Content

  1. Executive Summary
    • Global Market Outlook
    • Demand-side Trends
    • Supply-side Trends
    • Technology Roadmap Analysis
    • Analysis and Recommendations
  2. Market Overview
    • Market Coverage / Taxonomy
    • Market Definition / Scope / Limitations
  3. Market Background
    • Market Dynamics
      • Drivers
      • Restraints
      • Opportunity
      • Trends
    • Scenario Forecast
      • Demand in Optimistic Scenario
      • Demand in Likely Scenario
      • Demand in Conservative Scenario
    • Opportunity Map Analysis
    • Product Life Cycle Analysis
    • Supply Chain Analysis
      • Supply Side Participants and their Roles
        • Producers
        • Mid-Level Participants (Traders/ Agents/ Brokers)
        • Wholesalers and Distributors
      • Value Added and Value Created at Node in the Supply Chain
      • List of Raw Material Suppliers
      • List of Existing and Potential Buyer's
    • Investment Feasibility Matrix
    • Value Chain Analysis
      • Profit Margin Analysis
      • Wholesalers and Distributors
      • Retailers
    • PESTLE and Porter's Analysis
    • Regulatory Landscape
      • By Key Regions
      • By Key Countries
    • Regional Parent Market Outlook
    • Production and Consumption Statistics
    • Import and Export Statistics
  4. Global Market Analysis 2020-2024 and Forecast, 2025-2035
    • Historical Market Size Value (USD Mn) & Volume (Kilotons) Analysis, 2020-2024
    • Current and Future Market Size Value (USD Mn) & Volume (Kilotons) Projections, 2025-2035
      • Y-o-Y Growth Trend Analysis
      • Absolute $ Opportunity Analysis
  5. Global Market Pricing Analysis 2020-2024 and Forecast 2025-2035
  6. Global Market Analysis 2020-2024 and Forecast 2025-2035, By Product Type
    • Introduction / Key Findings
    • Historical Market Size Value (USD Million) & Volume (Kilotons) Analysis By Product Type, 2020-2024
    • Current and Future Market Size Value (USD Million) & Volume (Kilotons) Analysis and Forecast By Product Type, 2025-2035
      • Collagen-Based
      • Antioxidants
      • Vitamins & Minerals
      • Fatty Acids
      • Carotenoids
      • Herbal/Botanical Extracts
      • Probiotic-Based
    • Y-o-Y Growth Trend Analysis By Product Type, 2020-2024
    • Absolute $ Opportunity Analysis By Product Type, 2025-2035
  7. Global Market Analysis 2020-2024 and Forecast 2025-2035, By Ingredient
    • Introduction / Key Findings
    • Historical Market Size Value (USD Million) & Volume (Kilotons) Analysis By Ingredient, 2020-2024
    • Current and Future Market Size Value (USD Million) & Volume (Kilotons) Analysis and Forecast By Ingredient, 2025-2035
      • Collagen (Type I, Type II, Marine, Bovine)
      • Vitamin C, Vitamin E, Biotin, Zinc, Selenium
      • Omega-3, Omega-6
      • Lycopene, Beta-Carotene, Lutein
      • Hyaluronic Acid
      • Polyphenols (Green Tea, Grape Seed)
      • Probiotics (Lactobacillus, Bifidobacterium)
    • Y-o-Y Growth Trend Analysis By Ingredient, 2020-2024
    • Absolute $ Opportunity Analysis By Ingredient, 2025-2035
  8. Global Market Analysis 2020-2024 and Forecast 2025-2035, By Format
    • Introduction / Key Findings
    • Historical Market Size Value (USD Million) & Volume (Kilotons) Analysis By Format, 2020-2024
    • Current and Future Market Size Value (USD Million) & Volume (Kilotons) Analysis and Forecast By Format, 2025-2035
      • Capsules
      • Tablets
      • Gummies
      • Powders
      • Liquids/Shots
      • Softgels
    • Y-o-Y Growth Trend Analysis By Format, 2020-2024
    • Absolute $ Opportunity Analysis By Format, 2025-2035
  9. Global Market Analysis 2020-2024 and Forecast 2025-2035, By Function/Claim
    • Introduction / Key Findings
    • Historical Market Size Value (USD Million) & Volume (Kilotons) Analysis By Function/Claim, 2020-2024
    • Current and Future Market Size Value (USD Million) & Volume (Kilotons) Analysis and Forecast By Function/Claim, 2025-2035
      • Anti-Aging
      • Acne Control
      • Hydration & Elasticity
      • Skin Brightening
      • UV Protection
      • Wound Healing/Repair
    • Y-o-Y Growth Trend Analysis By Function/Claim, 2020-2024
    • Absolute $ Opportunity Analysis By Function/Claim, 2025-2035
  10. Global Market Analysis 2020-2024 and Forecast 2025-2035, By Target Consumer
    • Introduction / Key Findings
    • Historical Market Size Value (USD Million) & Volume (Kilotons) Analysis By Target Consumer, 2020-2024
    • Current and Future Market Size Value (USD Million) & Volume (Kilotons) Analysis and Forecast By Target Consumer, 2025-2035
      • Women
      • Men
      • Teenagers
      • Seniors
      • Dermatology Patients
    • Y-o-Y Growth Trend Analysis By Target Consumer, 2020-2024
    • Absolute $ Opportunity Analysis By Target Consumer, 2025-2035
  11. Global Market Analysis 2020-2024 and Forecast 2025-2035, By Distribution Channel
    • Introduction / Key Findings
    • Historical Market Size Value (USD Million) & Volume (Kilotons) Analysis By Distribution Channel, 2020-2024
    • Current and Future Market Size Value (USD Million) & Volume (Kilotons) Analysis and Forecast By Distribution Channel, 2025-2035
      • Pharmacies/Drugstores
      • Health & Beauty Retail Stores
      • Online Channels
      • Supermarkets/Hypermarkets
      • Direct-to-Consumer (D2C)
    • Y-o-Y Growth Trend Analysis By Distribution Channel, 2020-2024
    • Absolute $ Opportunity Analysis By Distribution Channel, 2025-2035
  12. Global Market Analysis 2020-2024 and Forecast 2025-2035, By Application
    • Introduction / Key Findings
    • Historical Market Size Value (USD Million) & Volume (Kilotons) Analysis By Application, 2020-2024
    • Current and Future Market Size Value (USD Million) & Volume (Kilotons) Analysis and Forecast By Application, 2025-2035
      • Nutraceuticals
      • Cosmeceuticals
      • Functional Beverages
      • Nutricosmetics
    • Y-o-Y Growth Trend Analysis By Application, 2020-2024
    • Absolute $ Opportunity Analysis By Application, 2025-2035
  13. Global Market Analysis 2020-2024 and Forecast 2025-2035, By Region
    • Introduction
    • Historical Market Size Value (USD Million) & Volume (Kilotons) Analysis By Region, 2020-2024
    • Current Market Size Value (USD Million) & Volume (Kilotons) Analysis and Forecast By Region, 2025-2035
      • North America
      • Europe
      • Asia Pacific
      • Latin America
      • Middle East and Africa
    • Market Attractiveness Analysis By Region
  14. North America Market Analysis 2020-2024 and Forecast 2025-2035, By Country
    • Historical Market Size Value (USD Million) & Volume (Kilotons) Trend Analysis By Market Taxonomy, 2020-2024
    • Market Size Value (USD Million) & Volume (Kilotons) Forecast By Market Taxonomy, 2025-2035
      • By Country
        • USA
        • Canada
        • Mexico
      • By Product Type
      • By Ingredient
      • By Format
      • By Function/Claim
      • By Target Consumer
      • By Distribution Channel
      • By Application
    • Market Attractiveness Analysis
      • By Country
      • By Product Type
      • By Ingredient
      • By Format
      • By Function/Claim
      • By Target Consumer
      • By Distribution Channel
      • By Application
    • Key Takeaways
  15. Europe Market Analysis 2020-2024 and Forecast 2025-2035, By Country
    • Historical Market Size Value (USD Million) & Volume (Kilotons) Trend Analysis By Market Taxonomy, 2020-2024
    • Market Size Value (USD Million) & Volume (Kilotons) Forecast By Market Taxonomy, 2025-2035
      • By Country
        • Germany
        • United Kingdom
        • France
        • Italy
        • Spain
        • BENELUX
        • Nordic
        • Rest of Europe
      • By Product Type
      • By Ingredient
      • By Format
      • By Function/Claim
      • By Target Consumer
      • By Distribution Channel
      • By Application
    • Market Attractiveness Analysis
      • By Country
      • By Product Type
      • By Ingredient
      • By Format
      • By Function/Claim
      • By Target Consumer
      • By Distribution Channel
      • By Application
    • Key Takeaways
  16. Asia Pacific Market Analysis 2020-2024 and Forecast 2025-2035, By Country
    • Historical Market Size Value (USD Million) & Volume (Kilotons) Trend Analysis By Market Taxonomy, 2020-2024
    • Market Size Value (USD Million) & Volume (Kilotons) Forecast By Market Taxonomy, 2025-2035
      • By Country
        • China
        • Japan
        • South Korea
        • India
        • Australia & New Zealand
        • ASEAN
        • Rest of Asia Pacific
      • By Product Type
      • By Ingredient
      • By Format
      • By Function/Claim
      • By Target Consumer
      • By Distribution Channel
      • By Application
    • Market Attractiveness Analysis
      • By Country
      • By Product Type
      • By Ingredient
      • By Format
      • By Function/Claim
      • By Target Consumer
      • By Distribution Channel
      • By Application
    • Key Takeaways
  17. Latin America Market Analysis 2020-2024 and Forecast 2025-2035, By Country
    • Historical Market Size Value (USD Million) & Volume (Kilotons) Trend Analysis By Market Taxonomy, 2020-2024
    • Market Size Value (USD Million) & Volume (Kilotons) Forecast By Market Taxonomy, 2025-2035
      • By Country
        • Brazil
        • Argentina
        • Rest of LATAM
      • By Product Type
      • By Ingredient
      • By Format
      • By Function/Claim
      • By Target Consumer
      • By Distribution Channel
      • By Application
    • Market Attractiveness Analysis
      • By Country
      • By Product Type
      • By Ingredient
      • By Format
      • By Function/Claim
      • By Target Consumer
      • By Distribution Channel
      • By Application
    • Key Takeaways
  18. Middle East and Africa Market Analysis 2020-2024 and Forecast 2025-2035, By Country
    • Historical Market Size Value (USD Million) & Volume (Kilotons) Trend Analysis By Market Taxonomy, 2020-2024
    • Market Size Value (USD Million) & Volume (Kilotons) Forecast By Market Taxonomy, 2025-2035
      • By Country
        • Kingdom of Saudi Arabia
        • Other GCC Countries
        • Turkey
        • South Africa
        • Other African Union
        • Rest of MEA
      • By Product Type
      • By Ingredient
      • By Format
      • By Function/Claim
      • By Target Consumer
      • By Distribution Channel
      • By Application
    • Market Attractiveness Analysis
      • By Country
      • By Product Type
      • By Ingredient
      • By Format
      • By Function/Claim
      • By Target Consumer
      • By Distribution Channel
      • By Application
    • Key Takeaways
  19. Key Countries Market Analysis
    • USA
      • Pricing Analysis
      • Market Share Analysis, 2024
        • By Product Type
        • By Ingredient
        • By Format
        • By Function/Claim
        • By Target Consumer
        • By Distribution Channel
        • By Application
    • Germany
      • Pricing Analysis
      • Market Share Analysis, 2024
        • By Product Type
        • By Ingredient
        • By Format
        • By Function/Claim
        • By Target Consumer
        • By Distribution Channel
        • By Application
    • China
      • Pricing Analysis
      • Market Share Analysis, 2024
        • By Product Type
        • By Ingredient
        • By Format
        • By Function/Claim
        • By Target Consumer
        • By Distribution Channel
        • By Application
    • France
      • Pricing Analysis
      • Market Share Analysis, 2024
        • By Product Type
        • By Ingredient
        • By Format
        • By Function/Claim
        • By Target Consumer
        • By Distribution Channel
        • By Application
    • India
      • Pricing Analysis
      • Market Share Analysis, 2024
        • By Product Type
        • By Ingredient
        • By Format
        • By Function/Claim
        • By Target Consumer
        • By Distribution Channel
        • By Application
  20. Market Structure Analysis
    • Competition Dashboard
    • Competition Benchmarking
    • Market Share Analysis of Top Players
      • By Region
      • By Product Type
      • By Ingredient
      • By Format
      • By Function/Claim
      • By Target Consumer
      • By Distribution Channel
      • By Application
  21. Competition Analysis
    • Competition Deep Dive
      • Nestlé Health Science
        • Overview
        • Product Portfolio
        • Profitability by Market Segments (Product Type/Ingredient/Format/Distribution Channel/Region)
        • Sales Footprint
        • Strategy Overview
          • Marketing Strategy
          • Product Strategy
          • Channel Strategy
      • Amway
      • Shiseido
      • Blackmores
      • Herbalife Nutrition
  22. Assumptions & Acronyms Used
  23. Research Methodology

List of Tables

  • Table 1: Global Market Value (USD Million) Forecast by Region, 2020-2035
  • Table 2: Global Market Volume (Kilotons) Forecast by Region, 2020-2035
  • Table 3: Global Market Value (USD Million) Forecast by Product Type, 2020-2035
  • Table 4: Global Market Volume (Kilotons) Forecast by Product Type, 2020-2035
  • Table 5: Global Market Value (USD Million) Forecast by Ingredient, 2020-2035
  • Table 6: Global Market Volume (Kilotons) Forecast by Ingredient, 2020-2035
  • Table 7: Global Market Value (USD Million) Forecast by Format, 2020-2035
  • Table 8: Global Market Volume (Kilotons) Forecast by Format, 2020-2035
  • Table 9: Global Market Value (USD Million) Forecast by Function/Claim, 2020-2035
  • Table 10: Global Market Volume (Kilotons) Forecast by Function/Claim, 2020-2035
  • Table 11: Global Market Value (USD Million) Forecast by Target Consumer, 2020-2035
  • Table 12: Global Market Volume (Kilotons) Forecast by Target Consumer, 2020-2035
  • Table 13: Global Market Value (USD Million) Forecast by Distribution Channel, 2020-2035
  • Table 14: Global Market Volume (Kilotons) Forecast by Distribution Channel, 2020-2035
  • Table 15: Global Market Value (USD Million) Forecast by Application, 2020-2035
  • Table 16: Global Market Volume (Kilotons) Forecast by Application, 2020-2035
  • Table 17: North America Market Value (USD Million) Forecast by Country, 2020-2035
  • Table 18: North America Market Volume (Kilotons) Forecast by Country, 2020-2035
  • Table 19: North America Market Value (USD Million) Forecast by Product Type, 2020-2035
  • Table 20: North America Market Volume (Kilotons) Forecast by Product Type, 2020-2035
  • Table 21: North America Market Value (USD Million) Forecast by Ingredient, 2020-2035
  • Table 22: North America Market Volume (Kilotons) Forecast by Ingredient, 2020-2035
  • Table 23: North America Market Value (USD Million) Forecast by Format, 2020-2035
  • Table 24: North America Market Volume (Kilotons) Forecast by Format, 2020-2035
  • Table 25: North America Market Value (USD Million) Forecast by Function/Claim, 2020-2035
  • Table 26: North America Market Volume (Kilotons) Forecast by Function/Claim, 2020-2035
  • Table 27: North America Market Value (USD Million) Forecast by Target Consumer, 2020-2035
  • Table 28: North America Market Volume (Kilotons) Forecast by Target Consumer, 2020-2035
  • Table 29: North America Market Value (USD Million) Forecast by Distribution Channel, 2020-2035
  • Table 30: North America Market Volume (Kilotons) Forecast by Distribution Channel, 2020-2035
  • Table 31: North America Market Value (USD Million) Forecast by Application, 2020-2035
  • Table 32: North America Market Volume (Kilotons) Forecast by Application, 2020-2035
  • Table 33: Europe Market Value (USD Million) Forecast by Country, 2020-2035
  • Table 34: Europe Market Volume (Kilotons) Forecast by Country, 2020-2035
  • Table 35: Europe Market Value (USD Million) Forecast by Product Type, 2020-2035
  • Table 36: Europe Market Volume (Kilotons) Forecast by Product Type, 2020-2035
  • Table 37: Europe Market Value (USD Million) Forecast by Ingredient, 2020-2035
  • Table 38: Europe Market Volume (Kilotons) Forecast by Ingredient, 2020-2035
  • Table 39: Europe Market Value (USD Million) Forecast by Format, 2020-2035
  • Table 40: Europe Market Volume (Kilotons) Forecast by Format, 2020-2035
  • Table 41: Europe Market Value (USD Million) Forecast by Function/Claim, 2020-2035
  • Table 42: Europe Market Volume (Kilotons) Forecast by Function/Claim, 2020-2035
  • Table 43: Europe Market Value (USD Million) Forecast by Target Consumer, 2020-2035
  • Table 44: Europe Market Volume (Kilotons) Forecast by Target Consumer, 2020-2035
  • Table 45: Europe Market Value (USD Million) Forecast by Distribution Channel, 2020-2035
  • Table 46: Europe Market Volume (Kilotons) Forecast by Distribution Channel, 2020-2035
  • Table 47: Europe Market Value (USD Million) Forecast by Application, 2020-2035
  • Table 48: Europe Market Volume (Kilotons) Forecast by Application, 2020-2035
  • Table 49: Asia Pacific Market Value (USD Million) Forecast by Country, 2020-2035
  • Table 50: Asia Pacific Market Volume (Kilotons) Forecast by Country, 2020-2035
  • Table 51: Asia Pacific Market Value (USD Million) Forecast by Product Type, 2020-2035
  • Table 52: Asia Pacific Market Volume (Kilotons) Forecast by Product Type, 2020-2035
  • Table 53: Asia Pacific Market Value (USD Million) Forecast by Ingredient, 2020-2035
  • Table 54: Asia Pacific Market Volume (Kilotons) Forecast by Ingredient, 2020-2035
  • Table 55: Asia Pacific Market Value (USD Million) Forecast by Format, 2020-2035
  • Table 56: Asia Pacific Market Volume (Kilotons) Forecast by Format, 2020-2035
  • Table 57: Asia Pacific Market Value (USD Million) Forecast by Function/Claim, 2020-2035
  • Table 58: Asia Pacific Market Volume (Kilotons) Forecast by Function/Claim, 2020-2035
  • Table 59: Asia Pacific Market Value (USD Million) Forecast by Target Consumer, 2020-2035
  • Table 60: Asia Pacific Market Volume (Kilotons) Forecast by Target Consumer, 2020-2035
  • Table 61: Asia Pacific Market Value (USD Million) Forecast by Distribution Channel, 2020-2035
  • Table 62: Asia Pacific Market Volume (Kilotons) Forecast by Distribution Channel, 2020-2035
  • Table 63: Asia Pacific Market Value (USD Million) Forecast by Application, 2020-2035
  • Table 64: Asia Pacific Market Volume (Kilotons) Forecast by Application, 2020-2035
  • Table 65: Latin America Market Value (USD Million) Forecast by Country, 2020-2035
  • Table 66: Latin America Market Volume (Kilotons) Forecast by Country, 2020-2035
  • Table 67: Latin America Market Value (USD Million) Forecast by Product Type, 2020-2035
  • Table 68: Latin America Market Volume (Kilotons) Forecast by Product Type, 2020-2035
  • Table 69: Latin America Market Value (USD Million) Forecast by Ingredient, 2020-2035
  • Table 70: Latin America Market Volume (Kilotons) Forecast by Ingredient, 2020-2035
  • Table 71: Latin America Market Value (USD Million) Forecast by Format, 2020-2035
  • Table 72: Latin America Market Volume (Kilotons) Forecast by Format, 2020-2035
  • Table 73: Latin America Market Value (USD Million) Forecast by Function/Claim, 2020-2035
  • Table 74: Latin America Market Volume (Kilotons) Forecast by Function/Claim, 2020-2035
  • Table 75: Latin America Market Value (USD Million) Forecast by Target Consumer, 2020-2035
  • Table 76: Latin America Market Volume (Kilotons) Forecast by Target Consumer, 2020-2035
  • Table 77: Latin America Market Value (USD Million) Forecast by Distribution Channel, 2020-2035
  • Table 78: Latin America Market Volume (Kilotons) Forecast by Distribution Channel, 2020-2035
  • Table 79: Latin America Market Value (USD Million) Forecast by Application, 2020-2035
  • Table 80: Latin America Market Volume (Kilotons) Forecast by Application, 2020-2035
  • Table 81: Middle East and Africa Market Value (USD Million) Forecast by Country, 2020-2035
  • Table 82: Middle East and Africa Market Volume (Kilotons) Forecast by Country, 2020-2035
  • Table 83: Middle East and Africa Market Value (USD Million) Forecast by Product Type, 2020-2035
  • Table 84: Middle East and Africa Market Volume (Kilotons) Forecast by Product Type, 2020-2035
  • Table 85: Middle East and Africa Market Value (USD Million) Forecast by Ingredient, 2020-2035
  • Table 86: Middle East and Africa Market Volume (Kilotons) Forecast by Ingredient, 2020-2035
  • Table 87: Middle East and Africa Market Value (USD Million) Forecast by Format, 2020-2035
  • Table 88: Middle East and Africa Market Volume (Kilotons) Forecast by Format, 2020-2035
  • Table 89: Middle East and Africa Market Value (USD Million) Forecast by Function/Claim, 2020-2035
  • Table 90: Middle East and Africa Market Volume (Kilotons) Forecast by Function/Claim, 2020-2035
  • Table 91: Middle East and Africa Market Value (USD Million) Forecast by Target Consumer, 2020-2035
  • Table 92: Middle East and Africa Market Volume (Kilotons) Forecast by Target Consumer, 2020-2035
  • Table 93: Middle East and Africa Market Value (USD Million) Forecast by Distribution Channel, 2020-2035
  • Table 94: Middle East and Africa Market Volume (Kilotons) Forecast by Distribution Channel, 2020-2035
  • Table 95: Middle East and Africa Market Value (USD Million) Forecast by Application, 2020-2035
  • Table 96: Middle East and Africa Market Volume (Kilotons) Forecast by Application, 2020-2035

List of Figures

  • Figure 1: Global Market Volume (Kilotons) Forecast 2020-2035
  • Figure 2: Global Market Pricing Analysis
  • Figure 3: Global Market Value (USD Million) Forecast 2020-2035
  • Figure 4: Global Market Value Share and BPS Analysis by Product Type, 2025 and 2035
  • Figure 5: Global Market Y-o-Y Growth Comparison by Product Type, 2025-2035
  • Figure 6: Global Market Attractiveness Analysis by Product Type
  • Figure 7: Global Market Value Share and BPS Analysis by Ingredient, 2025 and 2035
  • Figure 8: Global Market Y-o-Y Growth Comparison by Ingredient, 2025-2035
  • Figure 9: Global Market Attractiveness Analysis by Ingredient
  • Figure 10: Global Market Value Share and BPS Analysis by Format, 2025 and 2035
  • Figure 11: Global Market Y-o-Y Growth Comparison by Format, 2025-2035
  • Figure 12: Global Market Attractiveness Analysis by Format
  • Figure 13: Global Market Value Share and BPS Analysis by Function/Claim, 2025 and 2035
  • Figure 14: Global Market Y-o-Y Growth Comparison by Function/Claim, 2025-2035
  • Figure 15: Global Market Attractiveness Analysis by Function/Claim
  • Figure 16: Global Market Value Share and BPS Analysis by Target Consumer, 2025 and 2035
  • Figure 17: Global Market Y-o-Y Growth Comparison by Target Consumer, 2025-2035
  • Figure 18: Global Market Attractiveness Analysis by Target Consumer
  • Figure 19: Global Market Value Share and BPS Analysis by Distribution Channel, 2025 and 2035
  • Figure 20: Global Market Y-o-Y Growth Comparison by Distribution Channel, 2025-2035
  • Figure 21: Global Market Attractiveness Analysis by Distribution Channel
  • Figure 22: Global Market Value Share and BPS Analysis by Application, 2025 and 2035
  • Figure 23: Global Market Y-o-Y Growth Comparison by Application, 2025-2035
  • Figure 24: Global Market Attractiveness Analysis by Application
  • Figure 25: Global Market Value (USD Million) Share and BPS Analysis by Region, 2025 and 2035
  • Figure 26: Global Market Y-o-Y Growth Comparison by Region, 2025-2035
  • Figure 27: Global Market Attractiveness Analysis by Region
  • Figure 28: North America Market Incremental $ Opportunity, 2025-2035
  • Figure 29: Europe Market Incremental $ Opportunity, 2025-2035
  • Figure 30: Asia Pacific Market Incremental $ Opportunity, 2025-2035
  • Figure 31: Latin America Market Incremental $ Opportunity, 2025-2035
  • Figure 32: Middle East and Africa Market Incremental $ Opportunity, 2025-2035
  • Figure 33: North America Market Value Share and BPS Analysis by Country, 2025 and 2035
  • Figure 34: North America Market Value Share and BPS Analysis by Product Type, 2025 and 2035
  • Figure 35: North America Market Y-o-Y Growth Comparison by Product Type, 2025-2035
  • Figure 36: North America Market Attractiveness Analysis by Product Type
  • Figure 37: North America Market Value Share and BPS Analysis by Ingredient, 2025 and 2035
  • Figure 38: North America Market Y-o-Y Growth Comparison by Ingredient, 2025-2035
  • Figure 39: North America Market Attractiveness Analysis by Ingredient
  • Figure 40: North America Market Value Share and BPS Analysis by Format, 2025 and 2035
  • Figure 41: North America Market Y-o-Y Growth Comparison by Format, 2025-2035
  • Figure 42: North America Market Attractiveness Analysis by Format
  • Figure 43: North America Market Value Share and BPS Analysis by Function/Claim, 2025 and 2035
  • Figure 44: North America Market Y-o-Y Growth Comparison by Function/Claim, 2025-2035
  • Figure 45: North America Market Attractiveness Analysis by Function/Claim
  • Figure 46: North America Market Value Share and BPS Analysis by Target Consumer, 2025 and 2035
  • Figure 47: North America Market Y-o-Y Growth Comparison by Target Consumer, 2025-2035
  • Figure 48: North America Market Attractiveness Analysis by Target Consumer
  • Figure 49: North America Market Value Share and BPS Analysis by Distribution Channel, 2025 and 2035
  • Figure 50: North America Market Y-o-Y Growth Comparison by Distribution Channel, 2025-2035
  • Figure 51: North America Market Attractiveness Analysis by Distribution Channel
  • Figure 52: North America Market Value Share and BPS Analysis by Application, 2025 and 2035
  • Figure 53: North America Market Y-o-Y Growth Comparison by Application, 2025-2035
  • Figure 54: North America Market Attractiveness Analysis by Application
  • Figure 55: Europe Market Value Share and BPS Analysis by Country, 2025 and 2035
  • Figure 56: Europe Market Value Share and BPS Analysis by Product Type, 2025 and 2035
  • Figure 57: Europe Market Y-o-Y Growth Comparison by Product Type, 2025-2035
  • Figure 58: Europe Market Attractiveness Analysis by Product Type
  • Figure 59: Europe Market Value Share and BPS Analysis by Ingredient, 2025 and 2035
  • Figure 60: Europe Market Y-o-Y Growth Comparison by Ingredient, 2025-2035
  • Figure 61: Europe Market Attractiveness Analysis by Ingredient
  • Figure 62: Europe Market Value Share and BPS Analysis by Format, 2025 and 2035
  • Figure 63: Europe Market Y-o-Y Growth Comparison by Format, 2025-2035
  • Figure 64: Europe Market Attractiveness Analysis by Format
  • Figure 65: Europe Market Value Share and BPS Analysis by Function/Claim, 2025 and 2035
  • Figure 66: Europe Market Y-o-Y Growth Comparison by Function/Claim, 2025-2035
  • Figure 67: Europe Market Attractiveness Analysis by Function/Claim
  • Figure 68: Europe Market Value Share and BPS Analysis by Target Consumer, 2025 and 2035
  • Figure 69: Europe Market Y-o-Y Growth Comparison by Target Consumer, 2025-2035
  • Figure 70: Europe Market Attractiveness Analysis by Target Consumer
  • Figure 71: Europe Market Value Share and BPS Analysis by Distribution Channel, 2025 and 2035
  • Figure 72: Europe Market Y-o-Y Growth Comparison by Distribution Channel, 2025-2035
  • Figure 73: Europe Market Attractiveness Analysis by Distribution Channel
  • Figure 74: Europe Market Value Share and BPS Analysis by Application, 2025 and 2035
  • Figure 75: Europe Market Y-o-Y Growth Comparison by Application, 2025-2035
  • Figure 76: Europe Market Attractiveness Analysis by Application
  • Figure 77: Asia Pacific Market Value Share and BPS Analysis by Country, 2025 and 2035
  • Figure 78: Asia Pacific Market Value Share and BPS Analysis by Product Type, 2025 and 2035
  • Figure 79: Asia Pacific Market Y-o-Y Growth Comparison by Product Type, 2025-2035
  • Figure 80: Asia Pacific Market Attractiveness Analysis by Product Type
  • Figure 81: Asia Pacific Market Value Share and BPS Analysis by Ingredient, 2025 and 2035
  • Figure 82: Asia Pacific Market Y-o-Y Growth Comparison by Ingredient, 2025-2035
  • Figure 83: Asia Pacific Market Attractiveness Analysis by Ingredient
  • Figure 84: Asia Pacific Market Value Share and BPS Analysis by Format, 2025 and 2035
  • Figure 85: Asia Pacific Market Y-o-Y Growth Comparison by Format, 2025-2035
  • Figure 86: Asia Pacific Market Attractiveness Analysis by Format
  • Figure 87: Asia Pacific Market Value Share and BPS Analysis by Function/Claim, 2025 and 2035
  • Figure 88: Asia Pacific Market Y-o-Y Growth Comparison by Function/Claim, 2025-2035
  • Figure 89: Asia Pacific Market Attractiveness Analysis by Function/Claim
  • Figure 90: Asia Pacific Market Value Share and BPS Analysis by Target Consumer, 2025 and 2035
  • Figure 91: Asia Pacific Market Y-o-Y Growth Comparison by Target Consumer, 2025-2035
  • Figure 92: Asia Pacific Market Attractiveness Analysis by Target Consumer
  • Figure 93: Asia Pacific Market Value Share and BPS Analysis by Distribution Channel, 2025 and 2035
  • Figure 94: Asia Pacific Market Y-o-Y Growth Comparison by Distribution Channel, 2025-2035
  • Figure 95: Asia Pacific Market Attractiveness Analysis by Distribution Channel
  • Figure 96: Asia Pacific Market Value Share and BPS Analysis by Application, 2025 and 2035
  • Figure 97: Asia Pacific Market Y-o-Y Growth Comparison by Application, 2025-2035
  • Figure 98: Asia Pacific Market Attractiveness Analysis by Application
  • Figure 99: Latin America Market Value Share and BPS Analysis by Country, 2025 and 2035
  • Figure 100: Latin America Market Value Share and BPS Analysis by Product Type, 2025 and 2035
  • Figure 101: Latin America Market Y-o-Y Growth Comparison by Product Type, 2025-2035
  • Figure 102: Latin America Market Attractiveness Analysis by Product Type
  • Figure 103: Latin America Market Value Share and BPS Analysis by Ingredient, 2025 and 2035
  • Figure 104: Latin America Market Y-o-Y Growth Comparison by Ingredient, 2025-2035
  • Figure 105: Latin America Market Attractiveness Analysis by Ingredient
  • Figure 106: Latin America Market Value Share and BPS Analysis by Format, 2025 and 2035
  • Figure 107: Latin America Market Y-o-Y Growth Comparison by Format, 2025-2035
  • Figure 108: Latin America Market Attractiveness Analysis by Format
  • Figure 109: Latin America Market Value Share and BPS Analysis by Function/Claim, 2025 and 2035
  • Figure 110: Latin America Market Y-o-Y Growth Comparison by Function/Claim, 2025-2035
  • Figure 111: Latin America Market Attractiveness Analysis by Function/Claim
  • Figure 112: Latin America Market Value Share and BPS Analysis by Target Consumer, 2025 and 2035
  • Figure 113: Latin America Market Y-o-Y Growth Comparison by Target Consumer, 2025-2035
  • Figure 114: Latin America Market Attractiveness Analysis by Target Consumer
  • Figure 115: Latin America Market Value Share and BPS Analysis by Distribution Channel, 2025 and 2035
  • Figure 116: Latin America Market Y-o-Y Growth Comparison by Distribution Channel, 2025-2035
  • Figure 117: Latin America Market Attractiveness Analysis by Distribution Channel
  • Figure 118: Latin America Market Value Share and BPS Analysis by Application, 2025 and 2035
  • Figure 119: Latin America Market Y-o-Y Growth Comparison by Application, 2025-2035
  • Figure 120: Latin America Market Attractiveness Analysis by Application
  • Figure 121: Middle East and Africa Market Value Share and BPS Analysis by Country, 2025 and 2035
  • Figure 122: Middle East and Africa Market Value Share and BPS Analysis by Product Type, 2025 and 2035
  • Figure 123: Middle East and Africa Market Y-o-Y Growth Comparison by Product Type, 2025-2035
  • Figure 124: Middle East and Africa Market Attractiveness Analysis by Product Type
  • Figure 125: Middle East and Africa Market Value Share and BPS Analysis by Ingredient, 2025 and 2035
  • Figure 126: Middle East and Africa Market Y-o-Y Growth Comparison by Ingredient, 2025-2035
  • Figure 127: Middle East and Africa Market Attractiveness Analysis by Ingredient
  • Figure 128: Middle East and Africa Market Value Share and BPS Analysis by Format, 2025 and 2035
  • Figure 129: Middle East and Africa Market Y-o-Y Growth Comparison by Format, 2025-2035
  • Figure 130: Middle East and Africa Market Attractiveness Analysis by Format
  • Figure 131: Middle East and Africa Market Value Share and BPS Analysis by Function/Claim, 2025 and 2035
  • Figure 132: Middle East and Africa Market Y-o-Y Growth Comparison by Function/Claim, 2025-2035
  • Figure 133: Middle East and Africa Market Attractiveness Analysis by Function/Claim
  • Figure 134: Middle East and Africa Market Value Share and BPS Analysis by Target Consumer, 2025 and 2035
  • Figure 135: Middle East and Africa Market Y-o-Y Growth Comparison by Target Consumer, 2025-2035
  • Figure 136: Middle East and Africa Market Attractiveness Analysis by Target Consumer
  • Figure 137: Middle East and Africa Market Value Share and BPS Analysis by Distribution Channel, 2025 and 2035
  • Figure 138: Middle East and Africa Market Y-o-Y Growth Comparison by Distribution Channel, 2025-2035
  • Figure 139: Middle East and Africa Market Attractiveness Analysis by Distribution Channel
  • Figure 140: Middle East and Africa Market Value Share and BPS Analysis by Application, 2025 and 2035
  • Figure 141: Middle East and Africa Market Y-o-Y Growth Comparison by Application, 2025-2035
  • Figure 142: Middle East and Africa Market Attractiveness Analysis by Application
  • Figure 143: Global Market - Tier Structure Analysis
  • Figure 144: Global Market - Company Share Analysis
Dashboard
Dashboard
Dashboard
Dashboard
Dashboard
Dashboard

Our Research Products

Full Research Suite

The "Full Research Suite" delivers actionable market intel, deep dives on markets or technologies, so clients act faster, cut risk, and unlock growth.

Competitor Leaderboard Report

The Leaderboard benchmarks and ranks top vendors, classifying them as Established Leaders, Leading Challengers, or Disruptors & Challengers.

Future Leaders Index

Locates where complements amplify value and substitutes erode it, forecasting net impact by horizon

Market Data & Forecasts

We deliver granular, decision-grade intel: market sizing, 5-year forecasts, pricing, adoption, usage, revenue, and operational KPIs—plus competitor tracking, regulation, and value chains—across 60 countries broadly.

Market Focus Report

Spot the shifts before they hit your P&L. We track inflection points, adoption curves, pricing moves, and ecosystem plays to show where demand is heading, why it is changing, and what to do next across high-growth markets and disruptive tech

Survey Report

Real-time reads of user behavior. We track shifting priorities, perceptions of today’s and next-gen services, and provider experience, then pace how fast tech moves from trial to adoption, blending buyer, consumer, and channel inputs with social signals (#WhySwitch, #UX).

Bespoke Reports

Partner with our analyst team to build a custom report designed around your business priorities. From analysing market trends to assessing competitors or crafting bespoke datasets, we tailor insights to your needs.

Supplier Intelligence

Discovery & Profiling

Capacity & Footprint

Performance & Risk

Compliance & Governance

Commercial Readiness

Who Supplies Whom

Scorecards & Shortlists

Playbooks & Docs

Category Intelligence

Definition & Scope

Demand & Use Cases

Cost Drivers

Market Structure

Supply Chain Map

Trade & Policy

Operating Norms

Deliverables

Buyer Intelligence

Account Basics

Spend & Scope

Procurement Model

Vendor Requirements

Terms & Policies

Entry Strategy

Pain Points & Triggers

Outputs

Pricing Analysis

Benchmarks

Trends

Should-Cost

Indexation

Landed Cost

Commercial Terms

Deliverables

Brand Analysis

Positioning & Value Prop

Share & Presence

Customer Evidence

Go-to-Market

Digital & Reputation

Compliance & Trust

KPIs & Gaps

Outputs

Full Research Suite comprises of:

Market outlook & trends analysis

Market outlook & trends analysis

Interviews & case studies

Interviews & case studies

Strategic recommendations

Strategic recommendations

Vendor profiles & capabilities analysis

Vendor profiles & capabilities analysis

5-year forecasts

5-year forecasts

8 regions and 60+ country-level data splits

8 regions and 60+ country-level data splits

Market segment data splits

Market segment data splits

12 months of continuous data updates

12 months of continuous data updates

DELIVERED AS:

PDF EXCEL ONLINE

Full Research Suite


$3500

$5000

$6500

Buy Report Now
Similar Industry Reports

Similar Industry Reports

Pet Skin and Coat Health Supplement Market

Pet Skin & Coat Health Supplement Market Analysis by Pet Type, Form, Availability and Sales Channel Through 2035

Skincare Supplement Market

Skincare Supplement Market Size and Share Forecast Outlook 2025 to 2035

Healthy Aging Supplement Market

Healthy Aging Supplement Market – Demand, Innovations & Market Growth

Gut Health Supplement Market

Gut Health Supplement Market Size, Growth, and Forecast for 2025 to 2035

Bone Health Supplement Market

Bone Health Supplement Market Size and Share Forecast Outlook 2025 to 2035

Liver Health Supplements Market

Liver Health Supplements Market Analysis - Size, Growth, and Forecast 2025 to 2035

Brain Health Supplement Market

Brain Health Supplement Market Analysis - Size, Share, and Forecast Outlook 2025 to 2035

Immune Health Supplements Market

Immune Health Supplements Market Insights - Growth & Innovation 2025 to 2035

Women's Health Supplement Market

Women's Health Supplements Market Analysis - Size and Share Forecast Outlook 2025 to 2035

Cellular Health Supplement Market

Cellular Health Supplement Market Size and Share Forecast Outlook 2025 to 2035

Hormonal Health Supplements Market

Hormonal Health Supplements Market – Growth, Demand & Nutritional Trends

Pet Joint Health Supplement Market

Pet Joint Health Supplement Market Size and Share Forecast Outlook 2025 to 2035

Digestive Health Supplements Market

Digestive Health Supplements Market Analysis - Size, Share, and Forecast Outlook 2025 to 2035

Postnatal Health Supplements Market

Postnatal Health Supplements Market Trends – Demand & Forecast 2025-2035

Cognitive Health Supplement Market

Cognitive health supplements market analysis by product type, form, sales channel, functionality, and by region – Growth, trends, and Forecast from 2025 to 2035

Postpartum Health Supplements Market

Postpartum Health Supplements Market Size and Share Forecast Outlook 2025 to 2035

Children’s Health Supplement Market

Children’s Health Supplement Market Analysis by Product Type, Application and Age Group Through 2025 to 2035.

Kids’ Brain Health Supplements market

Kids’ Brain Health Supplements Market Size and Share Forecast Outlook 2025 to 2035

Older Adults Health Supplements Market

Older Adults Health Supplements Market Outlook - Growth, Demand & Forecast 2024 to 2034

Bone and Joint Health Supplement Market

Bone and Joint Health Supplement Market Analysis by Product Type, Form and Sale Channels Through 2035

Future Market Insights

Skin Health Supplement Market

Chat With MaRIA

Chat With

MaRIA

Hi There, I am MaRIA, Your Market Research Intelligence Assistant. How may I help you?