Liver Health Supplements Market Size and Share Forecast Outlook 2025 to 2035

The global liver health supplements market is valued at USD 10.8 billion in 2025 and is projected to reach USD 17.1 billion by 2035, growing at a CAGR of 5.2%.
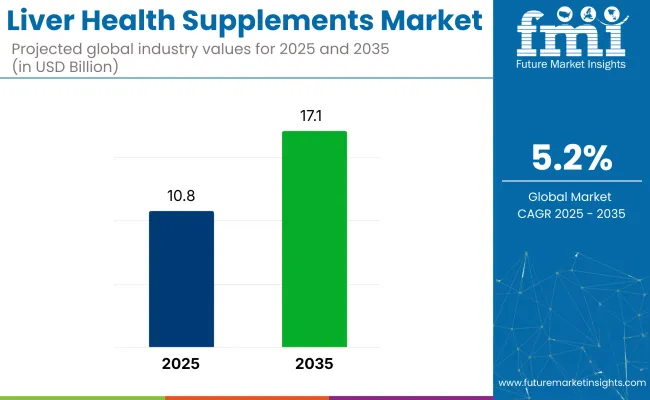
Quick Stats for Liver Health Supplements Market

  • Market Value (2025): USD 10.8 billion
  • Forecast Value (2035): USD 17.1 billion
  • Forecast CAGR: 5.2%
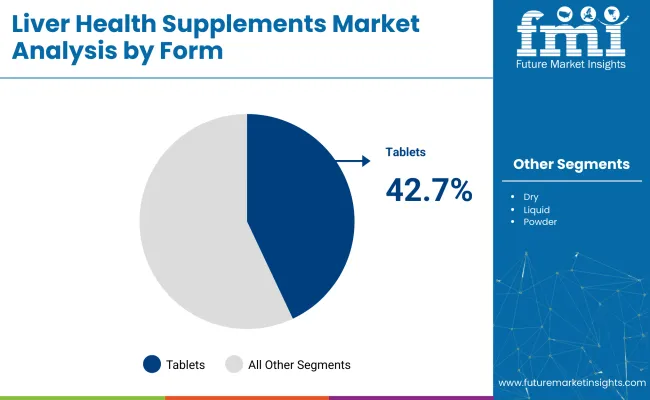
  • Form Leader in 2025: Tablets (42.7% Market Share)
  • Top Distribution Channel: Online Retail (38.6% Market Share)
  • Key Growth Region: Asia-Pacific (fastest-growing market in Japan with 4.5% CAGR)
Liver Health Supplements Market
Metric Value
Estimated Size (2025) USD 10.8 billion
Projected Value (2035) USD 17.1 billion
CAGR (2025 to 2035) 5.2%

The market will be driven by rising consumer demand for natural and organic supplements, personalized nutrition, and the increasing prevalence of liver-related diseases such as NAFLD and hepatitis. In addition, a shift towards plant-based ingredients like milk thistle and turmeric, alongside rising health awareness, will continue to propel market expansion over the forecast period.

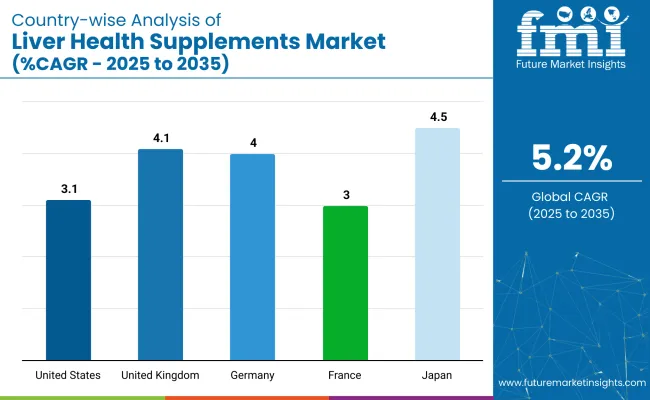
In 2025, the United States will remain the largest market for liver health supplements, contributing to the largest share globally, expanding at a CAGR of 3.1%. In contrast, Japan and the UK are likely to register the fastest growth with CAGRs of 4.5% and 4.1% respectively. By nature, the organic segment accounts for 55% of the market share, while by form, tablets hold a prominent share of 42.7% in 2025.

The liver health supplements market holds a small yet significant share in its parent markets. It represents a fraction of the dietary supplements market, likely around 5-7%, due to its niche focus on liver health. In the functional foods market, liver supplements contribute around 2-3%, given their specific health benefits within a broader category. In the herbal supplements market, liver supplements, especially plant-based options, may hold approximately 4-5%.

The nutraceuticals market sees liver health supplements comprising roughly 3-4%. Overall, while liver health supplements form a smaller portion of these larger markets, their growth is steadily rising with increased consumer interest in holistic health.

Looking forward, innovations in bio-based ingredients, the rise of personalized supplements, and advancements in online retailing will continue to drive market growth. Governments worldwide, especially in North America and Europe, are implementing stricter regulations on ingredient sourcing and labeling, which will further promote the use of high-quality, sustainable, and safe products.

As a result, the market will witness the introduction of cutting-edge liver health formulations designed to enhance both efficacy and consumer trust. Additionally, growing consumer awareness around liver health and prevention will fuel demand for these advanced, scientifically backed products, further strengthening market expansion.

Liver Health Supplement Market Analysis by Top Investment Segments

The global market for liver health supplements can be analyzed across various segments, including form, nature, source, end user, distribution channel, and region. Under form, the major categories are dry, tablet, powder, and liquid. For nature, the market is segmented into organic and conventional. Source includes vitamins, minerals, botanicals, and others.

End user segments include human nutrition and animal nutrition. For the distribution channel, the market is divided into online retailers, specialty stores, and supermarkets/hypermarkets. Finally, regional analysis covers North America, Latin America, Europe, East Asia, South Asia, Oceania, the Middle East and Africa.

By Form, Tablet Segment Accounts for 42.7% Market Share

The tablet segment is expected to dominate, with a market share of around 42.7% in 2025. Tablets are preferred for their ease of consumption and precise dosage, making them highly convenient for consumers. Dry forms will also experience significant growth due to their long shelf life and storage ease, while powders and liquids will remain less popular due to the need for additional preparation.
  • Tablets lead in ease of consumption.
  • Dry forms offer long shelf life.
  • Convenience factors strongly influence consumer choice.

Liver Health Supplements Market By Form

By Nature, the Organic Segment Accounts for 55% of the Market Share

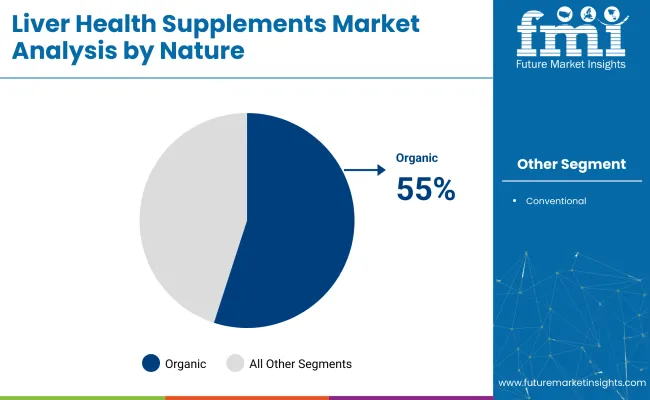
The organic segment is projected to experience the highest growth within the natural category, accounting for a prominent market share of nearly 55%, driven by rising demand for natural, chemical-free supplements.

As consumer preferences shift towards sustainable and eco-friendly products, organic liver health supplements are becoming more popular. Conventional supplements will still maintain a strong market presence due to their lower cost, but organic options are expected to dominate the market gradually.
  • Conventional supplements will still maintain demand.
  • Organic options cater to the rising trend for clean labels.
  • Organic market share is growing rapidly in the coming years.
Liver Health Supplements Market By Nature

By Source, Botanicals Account for 40% of the Market Share in 2025

Botanicals are anticipated to be the most lucrative source, accounting for 40% of the market share among all. Ingredients like milk thistle, dandelion root, and turmeric become more sought after for their liver-protective properties. Botanicals have been gaining popularity due to their natural healing properties and the increasing consumer demand for plant-based supplements. Vitamins and minerals remain significant but are less likely to experience as fast growth.

  • Vitamins and minerals will maintain steady demand.
  • Botanicals are gaining traction in liver health.
  • Plant-based ingredients are appealing to the growing health-conscious market.

By End User, Human Nutrition Holds a Prominent Share of 80%

The human nutrition segment will continue to lead, driven by the rising focus on preventive health and the increasing prevalence of liver diseases. The segment accounts for a significant share of 80%. The animal nutrition segment is also growing, with supplements formulated for pet health seeing increased demand, particularly for pets with liver health issues. Human nutrition, however, is expected to account for the bulk of the market share.

  • Pet nutrition is witnessing increased demand.
  • The shift towards preventative health boosts human nutrition.
  • Pet health trends are expanding the market for animal supplements.

By Distribution Channel, Online Retailers Account for 38.6% Market Share in 2025

Online retailers are expected to remain the top distribution channel, with a market share of 38.6% in 2025. The growth of e-commerce platforms makes it easier for consumers to access liver health supplements from the comfort of their homes. Specialty stores and supermarkets/hypermarkets will also see consistent demand, particularly as consumers seek trusted local and in-person options.

  • E-commerce enables easy accessibility for consumers.
  • Specialty stores maintain a strong physical presence.
  • Growth in online platforms boosts market reach.

Top Liver Health Supplements Market Dynamics

Recent Trends in the Liver Health Supplements Market
  • Increasing demand for natural and organic liver health supplements.
  • Growth of e-commerce platforms for the distribution of liver health supplements.
  • Rising popularity of plant-based ingredients like botanicals in liver health products.
  • Expansion of personalized nutrition solutions tailored to specific liver health needs.

Challenges in the Liver Health Supplements Market

  • Regulatory hurdles related to ingredient sourcing and labeling, especially for organic products.
  • High price sensitivity in cost-conscious markets, limiting premium product adoption.
  • Supply chain disruptions are affecting the availability of specialized raw materials.
  • Limited consumer awareness in emerging markets about the benefits of liver health supplements.

Analyzing Top Countries Manufacturing and Supplying Liver Health Supplements

Country Wise Analysis Of Liver Health Supplements Market

The growth rates of liver health supplements in key markets show a varying pace. Japan leads with a projected CAGR of 4.5% from 2025 to 2035, driven by increasing liver conditions like hepatitis and strong demand for functional foods. The UK follows closely with a 4.1% CAGR, spurred by growing health awareness and preference for natural remedies.

Germany shows steady growth at 4.0%, supported by its health-conscious population and regulatory environment. The USA grows at 3.1%, benefiting from robust e-commerce and a focus on organic ingredients. France experiences more moderate growth at 3.0%, driven by holistic health trends.

The report covers an in-depth analysis of 40+ countries; five top-performing OECD countries are highlighted below.

United States Liver Health Supplements Market Analysis

The USA liver health supplements revenue is projected to grow at a CAGR of 3.1% from 2025 to 2035. Growth will be driven by a rising health-conscious population, increasing prevalence of liver-related diseases like NAFLD and hepatitis, and a robust demand for preventive healthcare.

  • Strong demand for liver health supplements due to rising health concerns.
  • High consumer preference for natural, organic supplements.
  • Well-established retail infrastructure and online platforms boost market penetration.

Liver Health Supplements Demand Analysis in the United Kingdom

The liver health supplements market in the UK is expected to grow at a CAGR of 4.1% from 2025 to 2035. This growth is driven by increasing health awareness, especially in managing liver diseases, and a growing preference for natural, herbal remedies.

  • Rising focus on preventive healthcare and liver disease management.
  • Increased consumer preference for plant-based ingredients and organic options.
  • Growth of online retail platforms and health-focused stores.

Germany Liver Health Supplement Sales Analysis

Germany is expected to see steady growth in the liver health supplements market, with a projected CAGR of 4.0% from 2025 to 2035. The country’s strong economy, health-conscious population, and demand for high-quality supplements will drive the market.

  • Strong preference for high-quality, regulated supplements.
  • Increasing demand for liver health solutions in an aging population.
  • Growing focus on sustainability and natural ingredients.

Liver Health Supplement Demand Analysis in France

The French liver health supplements market is projected to grow at a CAGR of 3.0% from 2025 to 2035. This growth is attributed to a rising interest in holistic health and the increasing prevalence of liver diseases. France’s health-conscious population, coupled with its focus on preventive care, is driving demand for liver supplements.

  • Increasing awareness about liver diseases and preventive care.
  • Growing consumer demand for herbal and organic supplements.
  • Expansion of online retail platforms offering liver health products.

Japan Liver Health Supplements Industry Analysis

Japan’s liver health supplements market is expected to grow at a CAGR of 4.5% from 2025 to 2035. With a highly health-conscious population, Japan is witnessing a surge in demand for liver health products due to increasing cases of liver conditions like hepatitis. Consumers in Japan are increasingly looking for supplements that provide liver protection and overall wellness.

  • Strong consumer demand for functional foods and liver health products.
  • Rising health concerns related to liver diseases like hepatitis.
  • Increasing market penetration via online retailers and health food stores.

Leading Liver Health Supplements Suppliers

The liver health supplements market is highly competitive, with several prominent players occupying substantial shares of the market. Leading companies like NOW Foods, Glanbia PLC, Nestlé (Nature's Bounty), Jarrow Formulas, and Swisse have maintained their market dominance by leveraging strong portfolios of natural and organic supplements.

These companies differentiate themselves by focusing on product innovation, emphasizing the use of botanical extracts like milk thistle and turmeric, which have gained popularity due to their hepatoprotective properties. Additionally, they are focusing on expanding their reach through digital platforms and retail partnerships, ensuring broad accessibility of their products.

Recent Liver Health Supplements Industry News

In December 2023, Balchem completed a major expansion of its manufacturing facility for VitaCholine, its leading choline brand, increasing output by 50% to meet rising demand for this essential nutrient, which is well-known for its role in cognitive, liver, and overall health.

Liver Health Supplements Market Report Scope

Report Attributes Details
Current Total Market Size (2025) USD 10.8 billion
Projected Market Size (2035) USD 17.1 billion
CAGR (2025 to 2035) 5.2%
Base Year for Estimation 2024
Historical Period 2020 - 2024
Projections Period 2025 - 2035
Market Analysis Parameters Revenue in USD billions/Volume in Units
By Form Tablets, Dry, Liquid, Powder
By Nature Organic, Conventional
By Source Botanical, Vitamins, Minerals, Others
By End User Human Consumption, Pet Nutrition
Regions Covered North America, Latin America, Europe, East Asia, South Asia, Oceania, Middle East & Africa
Countries Covered United States, Canada, United Kingdom, Germany, France, China, Japan, South Korea, Brazil, Australia
Key Players Balchem Corporation, Amway Corp., GNC, Enzymedica , Sanofi, America’s Finest Inc., Banyan Botanicals, Himalaya Herbal Healthcare, NUTRALife , Gaia Herbs, Jarrow Formulas, Inc., Swisse , Thompson, Blackmore, Nestle (Nature's Bounty), Now Foods
Additional Attributes Dollar sales by value, market share analysis by region, country-wise analysis, and distribution channel analysis

Key Segments

By Form:

As per form, the market has been categorized into dry, tablet, powder, and liquid.

By Nature:

This segment is further categorized into organic and conventional.

By Source:

This segment is further categorized into vitamins, minerals, botanicals, and others.

By End User:

As per end user, the market has been categorized into human nutrition, and animal nutrition

By Distribution Channel:

Different distribution channels include online retailers, specialty stores, and supermarkets/hypermarkets.

By Region:

Industry analysis has been carried out in key countries of North America, Latin America, Europe, East Asia, South Asia, Oceania, and the Middle East & Africa.

Table of Content

  1. Executive Summary
    • Global Market Outlook
    • Demand-side Trends
    • Supply-side Trends
    • Technology Roadmap Analysis
    • Analysis and Recommendations
  2. Market Overview
    • Market Coverage / Taxonomy
    • Market Definition / Scope / Limitations
  3. Market Background
    • Market Dynamics
      • Drivers
      • Restraints
      • Opportunity
      • Trends
    • Scenario Forecast
      • Demand in Optimistic Scenario
      • Demand in Likely Scenario
      • Demand in Conservative Scenario
    • Opportunity Map Analysis
    • Product Life Cycle Analysis
    • Supply Chain Analysis
      • Supply Side Participants and their Roles
        • Producers
        • Mid-Level Participants (Traders/ Agents/ Brokers)
        • Wholesalers and Distributors
      • Value Added and Value Created at Node in the Supply Chain
      • List of Raw Material Suppliers
      • List of Existing and Potential Buyer’s
    • Investment Feasibility Matrix
    • Value Chain Analysis
      • Profit Margin Analysis
      • Wholesalers and Distributors
      • Retailers
    • PESTLE and Porter’s Analysis
    • Regulatory Landscape
      • By Key Regions
      • By Key Countries
    • Regional Parent Market Outlook
    • Production and Consumption Statistics
    • Import and Export Statistics
  4. Global Market Analysis 2020-2024 and Forecast, 2025-2035
    • Historical Market Size Value (USD Billion) & Volume (Units) Analysis, 2020-2024
    • Current and Future Market Size Value (USD Billion) & Volume (Units) Projections, 2025-2035
      • Y-o-Y Growth Trend Analysis
      • Absolute $ Opportunity Analysis
  5. Global Market Pricing Analysis 2020-2024 and Forecast 2025-2035
  6. Global Market Analysis 2020-2024 and Forecast 2025-2035, By Form
    • Introduction / Key Findings
    • Historical Market Size Value (USD Billion) & Volume (Units) Analysis By Form, 2020-2024
    • Current and Future Market Size Value (USD Billion) & Volume (Units) Analysis and Forecast By Form, 2025-2035
      • Dry
      • Tablet
      • Powder
      • Liquid
    • Y-o-Y Growth Trend Analysis By Form, 2020-2024
    • Absolute $ Opportunity Analysis By Form, 2025-2035
  7. Global Market Analysis 2020-2024 and Forecast 2025-2035, By Nature
    • Introduction / Key Findings
    • Historical Market Size Value (USD Billion) & Volume (Units) Analysis By Nature, 2020-2024
    • Current and Future Market Size Value (USD Billion) & Volume (Units) Analysis and Forecast By Nature, 2025-2035
      • Organic
      • Conventional
    • Y-o-Y Growth Trend Analysis By Nature, 2020-2024
    • Absolute $ Opportunity Analysis By Nature, 2025-2035
  8. Global Market Analysis 2020-2024 and Forecast 2025-2035, By Source
    • Introduction / Key Findings
    • Historical Market Size Value (USD Billion) & Volume (Units) Analysis By Source, 2020-2024
    • Current and Future Market Size Value (USD Billion) & Volume (Units) Analysis and Forecast By Source, 2025-2035
      • Vitamins
      • Minerals
      • Botanicals
      • Others
    • Y-o-Y Growth Trend Analysis By Source, 2020-2024
    • Absolute $ Opportunity Analysis By Source, 2025-2035
  9. Global Market Analysis 2020-2024 and Forecast 2025-2035, By End User
    • Introduction / Key Findings
    • Historical Market Size Value (USD Billion) & Volume (Units) Analysis By End User, 2020-2024
    • Current and Future Market Size Value (USD Billion) & Volume (Units) Analysis and Forecast By End User, 2025-2035
      • Human Nutrition
      • Animal Nutrition
    • Y-o-Y Growth Trend Analysis By End User, 2020-2024
    • Absolute $ Opportunity Analysis By End User, 2025-2035
  10. Global Market Analysis 2020-2024 and Forecast 2025-2035, By Distribution Channel
    • Introduction / Key Findings
    • Historical Market Size Value (USD Billion) & Volume (Units) Analysis By Distribution Channel, 2020-2024
    • Current and Future Market Size Value (USD Billion) & Volume (Units) Analysis and Forecast By Distribution Channel, 2025-2035
      • Online Retailers
      • Specialty Stores
      • Supermarkets/Hypermarkets
    • Y-o-Y Growth Trend Analysis By Distribution Channel, 2020-2024
    • Absolute $ Opportunity Analysis By Distribution Channel, 2025-2035
  11. Global Market Analysis 2020-2024 and Forecast 2025-2035, By Region
    • Introduction
    • Historical Market Size Value (USD Billion) & Volume (Units) Analysis By Region, 2020-2024
    • Current Market Size Value (USD Billion) & Volume (Units) Analysis and Forecast By Region, 2025-2035
      • North America
      • Latin America
      • Western Europe
      • Eastern Europe
      • East Asia
      • South Asia & Pacific
      • Middle East and Africa
    • Market Attractiveness Analysis By Region
  12. North America Market Analysis 2020-2024 and Forecast 2025-2035, By Country
    • Historical Market Size Value (USD Billion) & Volume (Units) Trend Analysis By Market Taxonomy, 2020-2024
    • Market Size Value (USD Billion) & Volume (Units) Forecast By Market Taxonomy, 2025-2035
      • By Country
        • USA
        • Canada
        • Mexico
      • By Form
      • By Nature
      • By Source
      • By End User
      • By Distribution Channel
    • Market Attractiveness Analysis
      • By Country
      • By Form
      • By Nature
      • By Source
      • By End User
      • By Distribution Channel
    • Key Takeaways
  13. Latin America Market Analysis 2020-2024 and Forecast 2025-2035, By Country
    • Historical Market Size Value (USD Billion) & Volume (Units) Trend Analysis By Market Taxonomy, 2020-2024
    • Market Size Value (USD Billion) & Volume (Units) Forecast By Market Taxonomy, 2025-2035
      • By Country
        • Brazil
        • Argentina
        • Rest of LATAM
      • By Form
      • By Nature
      • By Source
      • By End User
      • By Distribution Channel
    • Market Attractiveness Analysis
      • By Country
      • By Form
      • By Nature
      • By Source
      • By End User
      • By Distribution Channel
    • Key Takeaways
  14. Western Europe Market Analysis 2020-2024 and Forecast 2025-2035, By Country
    • Historical Market Size Value (USD Billion) & Volume (Units) Trend Analysis By Market Taxonomy, 2020-2024
    • Market Size Value (USD Billion) & Volume (Units) Forecast By Market Taxonomy, 2025-2035
      • By Country
        • Germany
        • Italy
        • France
        • UK
        • Spain
        • BENELUX
        • Nordic
        • Rest of W.Europe
      • By Form
      • By Nature
      • By Source
      • By End User
      • By Distribution Channel
    • Market Attractiveness Analysis
      • By Country
      • By Form
      • By Nature
      • By Source
      • By End User
      • By Distribution Channel
    • Key Takeaways
  15. Eastern Europe Market Analysis 2020-2024 and Forecast 2025-2035, By Country
    • Historical Market Size Value (USD Billion) & Volume (Units) Trend Analysis By Market Taxonomy, 2020-2024
    • Market Size Value (USD Billion) & Volume (Units) Forecast By Market Taxonomy, 2025-2035
      • By Country
        • Russia
        • Hungary
        • Poland
        • Balkan & Baltics
        • Rest of E. Europe
      • By Form
      • By Nature
      • By Source
      • By End User
      • By Distribution Channel
    • Market Attractiveness Analysis
      • By Country
      • By Form
      • By Nature
      • By Source
      • By End User
      • By Distribution Channel
    • Key Takeaways
  16. East Asia Market Analysis 2020-2024 and Forecast 2025-2035, By Country
    • Historical Market Size Value (USD Billion) & Volume (Units) Trend Analysis By Market Taxonomy, 2020-2024
    • Market Size Value (USD Billion) & Volume (Units) Forecast By Market Taxonomy, 2025-2035
      • By Country
        • China
        • Japan
        • South Korea
      • By Form
      • By Nature
      • By Source
      • By End User
      • By Distribution Channel
    • Market Attractiveness Analysis
      • By Country
      • By Form
      • By Nature
      • By Source
      • By End User
      • By Distribution Channel
    • Key Takeaways
  17. South Asia & Pacific Market Analysis 2020-2024 and Forecast 2025-2035, By Country
    • Historical Market Size Value (USD Billion) & Volume (Units) Trend Analysis By Market Taxonomy, 2020-2024
    • Market Size Value (USD Billion) & Volume (Units) Forecast By Market Taxonomy, 2025-2035
      • By Country
        • India
        • Australia & New Zealand
        • ASEAN
        • Rest of SAP
      • By Form
      • By Nature
      • By Source
      • By End User
      • By Distribution Channel
    • Market Attractiveness Analysis
      • By Country
      • By Form
      • By Nature
      • By Source
      • By End User
      • By Distribution Channel
    • Key Takeaways
  18. Middle East and Africa Market Analysis 2020-2024 and Forecast 2025-2035, By Country
    • Historical Market Size Value (USD Billion) & Volume (Units) Trend Analysis By Market Taxonomy, 2020-2024
    • Market Size Value (USD Billion) & Volume (Units) Forecast By Market Taxonomy, 2025-2035
      • By Country
        • GCC Countries
        • Northern Africa
        • South Africa
        • Turkiye
        • Rest of MEA
      • By Form
      • By Nature
      • By Source
      • By End User
      • By Distribution Channel
    • Market Attractiveness Analysis
      • By Country
      • By Form
      • By Nature
      • By Source
      • By End User
      • By Distribution Channel
    • Key Takeaways
  19. Key Countries Market Analysis
    • USA
      • Pricing Analysis
      • Market Share Analysis, 2024
        • By Form
        • By Nature
        • By Source
        • By End User
        • By Distribution Channel
    • Canada
      • Pricing Analysis
      • Market Share Analysis, 2024
        • By Form
        • By Nature
        • By Source
        • By End User
        • By Distribution Channel
    • Brazil
      • Pricing Analysis
      • Market Share Analysis, 2024
        • By Form
        • By Nature
        • By Source
        • By End User
        • By Distribution Channel
    • Mexico
      • Pricing Analysis
      • Market Share Analysis, 2024
        • By Form
        • By Nature
        • By Source
        • By End User
        • By Distribution Channel
    • Argentina
      • Pricing Analysis
      • Market Share Analysis, 2024
        • By Form
        • By Nature
        • By Source
        • By End User
        • By Distribution Channel
  20. Market Structure Analysis
    • Competition Dashboard
    • Competition Benchmarking
    • Market Share Analysis of Top Players
      • By Regional
      • By Form
      • By Nature
      • By Source
      • By End User
      • By Distribution Channel
  21. Competition Analysis
    • Competition Deep Dive
      • Balchem Corporation
        • Overview
        • Product Portfolio
        • Profitability by Market Segments (Product/Age /Sales Channel/Region)
        • Sales Footprint
        • Strategy Overview
          • Marketing Strategy
          • Product Strategy
          • Channel Strategy
      • Amway Corp.
        • Overview
        • Product Portfolio
        • Profitability by Market Segments (Product/Age /Sales Channel/Region)
        • Sales Footprint
        • Strategy Overview
          • Marketing Strategy
          • Product Strategy
          • Channel Strategy
      • GNC
        • Overview
        • Product Portfolio
        • Profitability by Market Segments (Product/Age /Sales Channel/Region)
        • Sales Footprint
        • Strategy Overview
          • Marketing Strategy
          • Product Strategy
          • Channel Strategy
      • Enzymedica
        • Overview
        • Product Portfolio
        • Profitability by Market Segments (Product/Age /Sales Channel/Region)
        • Sales Footprint
        • Strategy Overview
          • Marketing Strategy
          • Product Strategy
          • Channel Strategy
      • Sanofi
        • Overview
        • Product Portfolio
        • Profitability by Market Segments (Product/Age /Sales Channel/Region)
        • Sales Footprint
        • Strategy Overview
          • Marketing Strategy
          • Product Strategy
          • Channel Strategy
      • America’s Finest Inc.
        • Overview
        • Product Portfolio
        • Profitability by Market Segments (Product/Age /Sales Channel/Region)
        • Sales Footprint
        • Strategy Overview
          • Marketing Strategy
          • Product Strategy
          • Channel Strategy
      • Banyan Botanicals
        • Overview
        • Product Portfolio
        • Profitability by Market Segments (Product/Age /Sales Channel/Region)
        • Sales Footprint
        • Strategy Overview
          • Marketing Strategy
          • Product Strategy
          • Channel Strategy
      • Himalaya Herbal Healthcare
        • Overview
        • Product Portfolio
        • Profitability by Market Segments (Product/Age /Sales Channel/Region)
        • Sales Footprint
        • Strategy Overview
          • Marketing Strategy
          • Product Strategy
          • Channel Strategy
      • NUTRALife
        • Overview
        • Product Portfolio
        • Profitability by Market Segments (Product/Age /Sales Channel/Region)
        • Sales Footprint
        • Strategy Overview
          • Marketing Strategy
          • Product Strategy
          • Channel Strategy
      • Gaia Herbs
        • Overview
        • Product Portfolio
        • Profitability by Market Segments (Product/Age /Sales Channel/Region)
        • Sales Footprint
        • Strategy Overview
          • Marketing Strategy
          • Product Strategy
          • Channel Strategy
      • Jarrow Formulas, Inc.
        • Overview
        • Product Portfolio
        • Profitability by Market Segments (Product/Age /Sales Channel/Region)
        • Sales Footprint
        • Strategy Overview
          • Marketing Strategy
          • Product Strategy
          • Channel Strategy
      • Swisse
        • Overview
        • Product Portfolio
        • Profitability by Market Segments (Product/Age /Sales Channel/Region)
        • Sales Footprint
        • Strategy Overview
          • Marketing Strategy
          • Product Strategy
          • Channel Strategy
      • Thompson
        • Overview
        • Product Portfolio
        • Profitability by Market Segments (Product/Age /Sales Channel/Region)
        • Sales Footprint
        • Strategy Overview
          • Marketing Strategy
          • Product Strategy
          • Channel Strategy
      • Blackmore
        • Overview
        • Product Portfolio
        • Profitability by Market Segments (Product/Age /Sales Channel/Region)
        • Sales Footprint
        • Strategy Overview
          • Marketing Strategy
          • Product Strategy
          • Channel Strategy
      • Nestle (Nature's Bounty)
        • Overview
        • Product Portfolio
        • Profitability by Market Segments (Product/Age /Sales Channel/Region)
        • Sales Footprint
        • Strategy Overview
          • Marketing Strategy
          • Product Strategy
          • Channel Strategy
      • Now Foods
        • Overview
        • Product Portfolio
        • Profitability by Market Segments (Product/Age /Sales Channel/Region)
        • Sales Footprint
        • Strategy Overview
          • Marketing Strategy
          • Product Strategy
          • Channel Strategy
  22. Assumptions & Acronyms Used
  23. Research Methodology

List of Tables

  • Table 1: Global Market Value (USD Billion) Forecast by Region, 2020-2035
  • Table 2: Global Market Volume (Units) Forecast by Region, 2020-2035
  • Table 3: Global Market Value (USD Billion) Forecast by Form, 2020-2035
  • Table 4: Global Market Volume (Units) Forecast by Form, 2020-2035
  • Table 5: Global Market Value (USD Billion) Forecast by Nature, 2020-2035
  • Table 6: Global Market Volume (Units) Forecast by Nature, 2020-2035
  • Table 7: Global Market Value (USD Billion) Forecast by Source, 2020-2035
  • Table 8: Global Market Volume (Units) Forecast by Source, 2020-2035
  • Table 9: Global Market Value (USD Billion) Forecast by End User, 2020-2035
  • Table 10: Global Market Volume (Units) Forecast by End User, 2020-2035
  • Table 11: Global Market Value (USD Billion) Forecast by Distribution Channel, 2020-2035
  • Table 12: Global Market Volume (Units) Forecast by Distribution Channel, 2020-2035
  • Table 13: North America Market Value (USD Billion) Forecast by Country, 2020-2035
  • Table 14: North America Market Volume (Units) Forecast by Country, 2020-2035
  • Table 15: North America Market Value (USD Billion) Forecast by Form, 2020-2035
  • Table 16: North America Market Volume (Units) Forecast by Form, 2020-2035
  • Table 17: North America Market Value (USD Billion) Forecast by Nature, 2020-2035
  • Table 18: North America Market Volume (Units) Forecast by Nature, 2020-2035
  • Table 19: North America Market Value (USD Billion) Forecast by Source, 2020-2035
  • Table 20: North America Market Volume (Units) Forecast by Source, 2020-2035
  • Table 21: North America Market Value (USD Billion) Forecast by End User, 2020-2035
  • Table 22: North America Market Volume (Units) Forecast by End User, 2020-2035
  • Table 23: North America Market Value (USD Billion) Forecast by Distribution Channel, 2020-2035
  • Table 24: North America Market Volume (Units) Forecast by Distribution Channel, 2020-2035
  • Table 25: Latin America Market Value (USD Billion) Forecast by Country, 2020-2035
  • Table 26: Latin America Market Volume (Units) Forecast by Country, 2020-2035
  • Table 27: Latin America Market Value (USD Billion) Forecast by Form, 2020-2035
  • Table 28: Latin America Market Volume (Units) Forecast by Form, 2020-2035
  • Table 29: Latin America Market Value (USD Billion) Forecast by Nature, 2020-2035
  • Table 30: Latin America Market Volume (Units) Forecast by Nature, 2020-2035
  • Table 31: Latin America Market Value (USD Billion) Forecast by Source, 2020-2035
  • Table 32: Latin America Market Volume (Units) Forecast by Source, 2020-2035
  • Table 33: Latin America Market Value (USD Billion) Forecast by End User, 2020-2035
  • Table 34: Latin America Market Volume (Units) Forecast by End User, 2020-2035
  • Table 35: Latin America Market Value (USD Billion) Forecast by Distribution Channel, 2020-2035
  • Table 36: Latin America Market Volume (Units) Forecast by Distribution Channel, 2020-2035
  • Table 37: Western Europe Market Value (USD Billion) Forecast by Country, 2020-2035
  • Table 38: Western Europe Market Volume (Units) Forecast by Country, 2020-2035
  • Table 39: Western Europe Market Value (USD Billion) Forecast by Form, 2020-2035
  • Table 40: Western Europe Market Volume (Units) Forecast by Form, 2020-2035
  • Table 41: Western Europe Market Value (USD Billion) Forecast by Nature, 2020-2035
  • Table 42: Western Europe Market Volume (Units) Forecast by Nature, 2020-2035
  • Table 43: Western Europe Market Value (USD Billion) Forecast by Source, 2020-2035
  • Table 44: Western Europe Market Volume (Units) Forecast by Source, 2020-2035
  • Table 45: Western Europe Market Value (USD Billion) Forecast by End User, 2020-2035
  • Table 46: Western Europe Market Volume (Units) Forecast by End User, 2020-2035
  • Table 47: Western Europe Market Value (USD Billion) Forecast by Distribution Channel, 2020-2035
  • Table 48: Western Europe Market Volume (Units) Forecast by Distribution Channel, 2020-2035
  • Table 49: Eastern Europe Market Value (USD Billion) Forecast by Country, 2020-2035
  • Table 50: Eastern Europe Market Volume (Units) Forecast by Country, 2020-2035
  • Table 51: Eastern Europe Market Value (USD Billion) Forecast by Form, 2020-2035
  • Table 52: Eastern Europe Market Volume (Units) Forecast by Form, 2020-2035
  • Table 53: Eastern Europe Market Value (USD Billion) Forecast by Nature, 2020-2035
  • Table 54: Eastern Europe Market Volume (Units) Forecast by Nature, 2020-2035
  • Table 55: Eastern Europe Market Value (USD Billion) Forecast by Source, 2020-2035
  • Table 56: Eastern Europe Market Volume (Units) Forecast by Source, 2020-2035
  • Table 57: Eastern Europe Market Value (USD Billion) Forecast by End User, 2020-2035
  • Table 58: Eastern Europe Market Volume (Units) Forecast by End User, 2020-2035
  • Table 59: Eastern Europe Market Value (USD Billion) Forecast by Distribution Channel, 2020-2035
  • Table 60: Eastern Europe Market Volume (Units) Forecast by Distribution Channel, 2020-2035
  • Table 61: East Asia Market Value (USD Billion) Forecast by Country, 2020-2035
  • Table 62: East Asia Market Volume (Units) Forecast by Country, 2020-2035
  • Table 63: East Asia Market Value (USD Billion) Forecast by Form, 2020-2035
  • Table 64: East Asia Market Volume (Units) Forecast by Form, 2020-2035
  • Table 65: East Asia Market Value (USD Billion) Forecast by Nature, 2020-2035
  • Table 66: East Asia Market Volume (Units) Forecast by Nature, 2020-2035
  • Table 67: East Asia Market Value (USD Billion) Forecast by Source, 2020-2035
  • Table 68: East Asia Market Volume (Units) Forecast by Source, 2020-2035
  • Table 69: East Asia Market Value (USD Billion) Forecast by End User, 2020-2035
  • Table 70: East Asia Market Volume (Units) Forecast by End User, 2020-2035
  • Table 71: East Asia Market Value (USD Billion) Forecast by Distribution Channel, 2020-2035
  • Table 72: East Asia Market Volume (Units) Forecast by Distribution Channel, 2020-2035
  • Table 73: South Asia & Pacific Market Value (USD Billion) Forecast by Country, 2020-2035
  • Table 74: South Asia & Pacific Market Volume (Units) Forecast by Country, 2020-2035
  • Table 75: South Asia & Pacific Market Value (USD Billion) Forecast by Form, 2020-2035
  • Table 76: South Asia & Pacific Market Volume (Units) Forecast by Form, 2020-2035
  • Table 77: South Asia & Pacific Market Value (USD Billion) Forecast by Nature, 2020-2035
  • Table 78: South Asia & Pacific Market Volume (Units) Forecast by Nature, 2020-2035
  • Table 79: South Asia & Pacific Market Value (USD Billion) Forecast by Source, 2020-2035
  • Table 80: South Asia & Pacific Market Volume (Units) Forecast by Source, 2020-2035
  • Table 81: South Asia & Pacific Market Value (USD Billion) Forecast by End User, 2020-2035
  • Table 82: South Asia & Pacific Market Volume (Units) Forecast by End User, 2020-2035
  • Table 83: South Asia & Pacific Market Value (USD Billion) Forecast by Distribution Channel, 2020-2035
  • Table 84: South Asia & Pacific Market Volume (Units) Forecast by Distribution Channel, 2020-2035
  • Table 85: Middle East and Africa Market Value (USD Billion) Forecast by Country, 2020-2035
  • Table 86: Middle East and Africa Market Volume (Units) Forecast by Country, 2020-2035
  • Table 87: Middle East and Africa Market Value (USD Billion) Forecast by Form, 2020-2035
  • Table 88: Middle East and Africa Market Volume (Units) Forecast by Form, 2020-2035
  • Table 89: Middle East and Africa Market Value (USD Billion) Forecast by Nature, 2020-2035
  • Table 90: Middle East and Africa Market Volume (Units) Forecast by Nature, 2020-2035
  • Table 91: Middle East and Africa Market Value (USD Billion) Forecast by Source, 2020-2035
  • Table 92: Middle East and Africa Market Volume (Units) Forecast by Source, 2020-2035
  • Table 93: Middle East and Africa Market Value (USD Billion) Forecast by End User, 2020-2035
  • Table 94: Middle East and Africa Market Volume (Units) Forecast by End User, 2020-2035
  • Table 95: Middle East and Africa Market Value (USD Billion) Forecast by Distribution Channel, 2020-2035
  • Table 96: Middle East and Africa Market Volume (Units) Forecast by Distribution Channel, 2020-2035

List of Figures

  • Figure 1: Global Market Volume (Units) Forecast 2020-2035
  • Figure 2: Global Market Pricing Analysis
  • Figure 3: Global Market Value (USD Billion) Forecast 2020-2035
  • Figure 4: Global Market Value Share and BPS Analysis by Form, 2025 and 2035
  • Figure 5: Global Market Y-o-Y Growth Comparison by Form, 2025-2035
  • Figure 6: Global Market Attractiveness Analysis by Form
  • Figure 7: Global Market Value Share and BPS Analysis by Nature, 2025 and 2035
  • Figure 8: Global Market Y-o-Y Growth Comparison by Nature, 2025-2035
  • Figure 9: Global Market Attractiveness Analysis by Nature
  • Figure 10: Global Market Value Share and BPS Analysis by Source, 2025 and 2035
  • Figure 11: Global Market Y-o-Y Growth Comparison by Source, 2025-2035
  • Figure 12: Global Market Attractiveness Analysis by Source
  • Figure 13: Global Market Value Share and BPS Analysis by End User, 2025 and 2035
  • Figure 14: Global Market Y-o-Y Growth Comparison by End User, 2025-2035
  • Figure 15: Global Market Attractiveness Analysis by End User
  • Figure 16: Global Market Value Share and BPS Analysis by Distribution Channel, 2025 and 2035
  • Figure 17: Global Market Y-o-Y Growth Comparison by Distribution Channel, 2025-2035
  • Figure 18: Global Market Attractiveness Analysis by Distribution Channel
  • Figure 19: Global Market Value (USD Billion) Share and BPS Analysis by Region, 2025 and 2035
  • Figure 20: Global Market Y-o-Y Growth Comparison by Region, 2025-2035
  • Figure 21: Global Market Attractiveness Analysis by Region
  • Figure 22: North America Market Incremental $ Opportunity, 2025-2035
  • Figure 23: Latin America Market Incremental $ Opportunity, 2025-2035
  • Figure 24: Western Europe Market Incremental $ Opportunity, 2025-2035
  • Figure 25: Eastern Europe Market Incremental $ Opportunity, 2025-2035
  • Figure 26: East Asia Market Incremental $ Opportunity, 2025-2035
  • Figure 27: South Asia & Pacific Market Incremental $ Opportunity, 2025-2035
  • Figure 28: Middle East and Africa Market Incremental $ Opportunity, 2025-2035
  • Figure 29: North America Market Value Share and BPS Analysis by Country, 2025 and 2035
  • Figure 30: North America Market Value Share and BPS Analysis by Form, 2025 and 2035
  • Figure 31: North America Market Y-o-Y Growth Comparison by Form, 2025-2035
  • Figure 32: North America Market Attractiveness Analysis by Form
  • Figure 33: North America Market Value Share and BPS Analysis by Nature, 2025 and 2035
  • Figure 34: North America Market Y-o-Y Growth Comparison by Nature, 2025-2035
  • Figure 35: North America Market Attractiveness Analysis by Nature
  • Figure 36: North America Market Value Share and BPS Analysis by Source, 2025 and 2035
  • Figure 37: North America Market Y-o-Y Growth Comparison by Source, 2025-2035
  • Figure 38: North America Market Attractiveness Analysis by Source
  • Figure 39: North America Market Value Share and BPS Analysis by End User, 2025 and 2035
  • Figure 40: North America Market Y-o-Y Growth Comparison by End User, 2025-2035
  • Figure 41: North America Market Attractiveness Analysis by End User
  • Figure 42: North America Market Value Share and BPS Analysis by Distribution Channel, 2025 and 2035
  • Figure 43: North America Market Y-o-Y Growth Comparison by Distribution Channel, 2025-2035
  • Figure 44: North America Market Attractiveness Analysis by Distribution Channel
  • Figure 45: Latin America Market Value Share and BPS Analysis by Country, 2025 and 2035
  • Figure 46: Latin America Market Value Share and BPS Analysis by Form, 2025 and 2035
  • Figure 47: Latin America Market Y-o-Y Growth Comparison by Form, 2025-2035
  • Figure 48: Latin America Market Attractiveness Analysis by Form
  • Figure 49: Latin America Market Value Share and BPS Analysis by Nature, 2025 and 2035
  • Figure 50: Latin America Market Y-o-Y Growth Comparison by Nature, 2025-2035
  • Figure 51: Latin America Market Attractiveness Analysis by Nature
  • Figure 52: Latin America Market Value Share and BPS Analysis by Source, 2025 and 2035
  • Figure 53: Latin America Market Y-o-Y Growth Comparison by Source, 2025-2035
  • Figure 54: Latin America Market Attractiveness Analysis by Source
  • Figure 55: Latin America Market Value Share and BPS Analysis by End User, 2025 and 2035
  • Figure 56: Latin America Market Y-o-Y Growth Comparison by End User, 2025-2035
  • Figure 57: Latin America Market Attractiveness Analysis by End User
  • Figure 58: Latin America Market Value Share and BPS Analysis by Distribution Channel, 2025 and 2035
  • Figure 59: Latin America Market Y-o-Y Growth Comparison by Distribution Channel, 2025-2035
  • Figure 60: Latin America Market Attractiveness Analysis by Distribution Channel
  • Figure 61: Western Europe Market Value Share and BPS Analysis by Country, 2025 and 2035
  • Figure 62: Western Europe Market Value Share and BPS Analysis by Form, 2025 and 2035
  • Figure 63: Western Europe Market Y-o-Y Growth Comparison by Form, 2025-2035
  • Figure 64: Western Europe Market Attractiveness Analysis by Form
  • Figure 65: Western Europe Market Value Share and BPS Analysis by Nature, 2025 and 2035
  • Figure 66: Western Europe Market Y-o-Y Growth Comparison by Nature, 2025-2035
  • Figure 67: Western Europe Market Attractiveness Analysis by Nature
  • Figure 68: Western Europe Market Value Share and BPS Analysis by Source, 2025 and 2035
  • Figure 69: Western Europe Market Y-o-Y Growth Comparison by Source, 2025-2035
  • Figure 70: Western Europe Market Attractiveness Analysis by Source
  • Figure 71: Western Europe Market Value Share and BPS Analysis by End User, 2025 and 2035
  • Figure 72: Western Europe Market Y-o-Y Growth Comparison by End User, 2025-2035
  • Figure 73: Western Europe Market Attractiveness Analysis by End User
  • Figure 74: Western Europe Market Value Share and BPS Analysis by Distribution Channel, 2025 and 2035
  • Figure 75: Western Europe Market Y-o-Y Growth Comparison by Distribution Channel, 2025-2035
  • Figure 76: Western Europe Market Attractiveness Analysis by Distribution Channel
  • Figure 77: Eastern Europe Market Value Share and BPS Analysis by Country, 2025 and 2035
  • Figure 78: Eastern Europe Market Value Share and BPS Analysis by Form, 2025 and 2035
  • Figure 79: Eastern Europe Market Y-o-Y Growth Comparison by Form, 2025-2035
  • Figure 80: Eastern Europe Market Attractiveness Analysis by Form
  • Figure 81: Eastern Europe Market Value Share and BPS Analysis by Nature, 2025 and 2035
  • Figure 82: Eastern Europe Market Y-o-Y Growth Comparison by Nature, 2025-2035
  • Figure 83: Eastern Europe Market Attractiveness Analysis by Nature
  • Figure 84: Eastern Europe Market Value Share and BPS Analysis by Source, 2025 and 2035
  • Figure 85: Eastern Europe Market Y-o-Y Growth Comparison by Source, 2025-2035
  • Figure 86: Eastern Europe Market Attractiveness Analysis by Source
  • Figure 87: Eastern Europe Market Value Share and BPS Analysis by End User, 2025 and 2035
  • Figure 88: Eastern Europe Market Y-o-Y Growth Comparison by End User, 2025-2035
  • Figure 89: Eastern Europe Market Attractiveness Analysis by End User
  • Figure 90: Eastern Europe Market Value Share and BPS Analysis by Distribution Channel, 2025 and 2035
  • Figure 91: Eastern Europe Market Y-o-Y Growth Comparison by Distribution Channel, 2025-2035
  • Figure 92: Eastern Europe Market Attractiveness Analysis by Distribution Channel
  • Figure 93: East Asia Market Value Share and BPS Analysis by Country, 2025 and 2035
  • Figure 94: East Asia Market Value Share and BPS Analysis by Form, 2025 and 2035
  • Figure 95: East Asia Market Y-o-Y Growth Comparison by Form, 2025-2035
  • Figure 96: East Asia Market Attractiveness Analysis by Form
  • Figure 97: East Asia Market Value Share and BPS Analysis by Nature, 2025 and 2035
  • Figure 98: East Asia Market Y-o-Y Growth Comparison by Nature, 2025-2035
  • Figure 99: East Asia Market Attractiveness Analysis by Nature
  • Figure 100: East Asia Market Value Share and BPS Analysis by Source, 2025 and 2035
  • Figure 101: East Asia Market Y-o-Y Growth Comparison by Source, 2025-2035
  • Figure 102: East Asia Market Attractiveness Analysis by Source
  • Figure 103: East Asia Market Value Share and BPS Analysis by End User, 2025 and 2035
  • Figure 104: East Asia Market Y-o-Y Growth Comparison by End User, 2025-2035
  • Figure 105: East Asia Market Attractiveness Analysis by End User
  • Figure 106: East Asia Market Value Share and BPS Analysis by Distribution Channel, 2025 and 2035
  • Figure 107: East Asia Market Y-o-Y Growth Comparison by Distribution Channel, 2025-2035
  • Figure 108: East Asia Market Attractiveness Analysis by Distribution Channel
  • Figure 109: South Asia & Pacific Market Value Share and BPS Analysis by Country, 2025 and 2035
  • Figure 110: South Asia & Pacific Market Value Share and BPS Analysis by Form, 2025 and 2035
  • Figure 111: South Asia & Pacific Market Y-o-Y Growth Comparison by Form, 2025-2035
  • Figure 112: South Asia & Pacific Market Attractiveness Analysis by Form
  • Figure 113: South Asia & Pacific Market Value Share and BPS Analysis by Nature, 2025 and 2035
  • Figure 114: South Asia & Pacific Market Y-o-Y Growth Comparison by Nature, 2025-2035
  • Figure 115: South Asia & Pacific Market Attractiveness Analysis by Nature
  • Figure 116: South Asia & Pacific Market Value Share and BPS Analysis by Source, 2025 and 2035
  • Figure 117: South Asia & Pacific Market Y-o-Y Growth Comparison by Source, 2025-2035
  • Figure 118: South Asia & Pacific Market Attractiveness Analysis by Source
  • Figure 119: South Asia & Pacific Market Value Share and BPS Analysis by End User, 2025 and 2035
  • Figure 120: South Asia & Pacific Market Y-o-Y Growth Comparison by End User, 2025-2035
  • Figure 121: South Asia & Pacific Market Attractiveness Analysis by End User
  • Figure 122: South Asia & Pacific Market Value Share and BPS Analysis by Distribution Channel, 2025 and 2035
  • Figure 123: South Asia & Pacific Market Y-o-Y Growth Comparison by Distribution Channel, 2025-2035
  • Figure 124: South Asia & Pacific Market Attractiveness Analysis by Distribution Channel
  • Figure 125: Middle East and Africa Market Value Share and BPS Analysis by Country, 2025 and 2035
  • Figure 126: Middle East and Africa Market Value Share and BPS Analysis by Form, 2025 and 2035
  • Figure 127: Middle East and Africa Market Y-o-Y Growth Comparison by Form, 2025-2035
  • Figure 128: Middle East and Africa Market Attractiveness Analysis by Form
  • Figure 129: Middle East and Africa Market Value Share and BPS Analysis by Nature, 2025 and 2035
  • Figure 130: Middle East and Africa Market Y-o-Y Growth Comparison by Nature, 2025-2035
  • Figure 131: Middle East and Africa Market Attractiveness Analysis by Nature
  • Figure 132: Middle East and Africa Market Value Share and BPS Analysis by Source, 2025 and 2035
  • Figure 133: Middle East and Africa Market Y-o-Y Growth Comparison by Source, 2025-2035
  • Figure 134: Middle East and Africa Market Attractiveness Analysis by Source
  • Figure 135: Middle East and Africa Market Value Share and BPS Analysis by End User, 2025 and 2035
  • Figure 136: Middle East and Africa Market Y-o-Y Growth Comparison by End User, 2025-2035
  • Figure 137: Middle East and Africa Market Attractiveness Analysis by End User
  • Figure 138: Middle East and Africa Market Value Share and BPS Analysis by Distribution Channel, 2025 and 2035
  • Figure 139: Middle East and Africa Market Y-o-Y Growth Comparison by Distribution Channel, 2025-2035
  • Figure 140: Middle East and Africa Market Attractiveness Analysis by Distribution Channel
  • Figure 141: Global Market - Tier Structure Analysis
  • Figure 142: Global Market - Company Share Analysis

Frequently Asked Questions

What is the projected size of the liver health supplements market in 2025?

The liver health supplements market is valued at USD 10.8 billion in 2025.

What is the outlook on liver health supplements demand by 2035?

The market is forecasted to reach USD 17.1 billion by 2035, reflecting a CAGR of 5.2%.

Which form leads the liver health supplements market in 2025?

Tablets are expected to lead the market with a 42.7% market share in 2025.

What is the projected share of online retailers in the liver health supplements market by 2025?

Online retailers are projected to hold a 38.6% market share in 2025.

Which country is projected to have the fastest-growing liver health supplements market?

Japan is anticipated to be the fastest-growing market with a CAGR of 4.5% from 2025 to 2035.

Explore Similar Insights

Future Market Insights

Liver Health Supplements Market