Delivery Management Software Market Size and Share Forecast Outlook 2025 to 2035

The Delivery Management Software Market is estimated to be valued at USD 11.6 billion in 2025 and is projected to reach USD 25.5 billion by 2035, registering a compound annual growth rate (CAGR) of 8.2% over the forecast period.
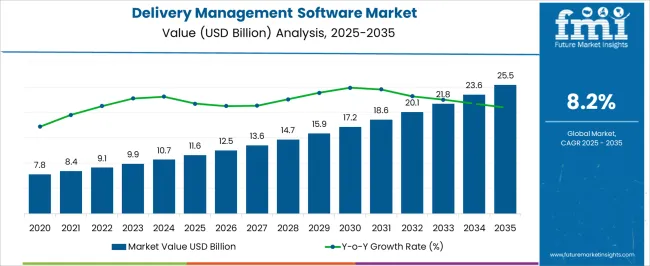
Quick Stats for Delivery Management Software Market

  • Delivery Management Software Market Value (2025): USD 11.6 billion
  • Delivery Management Software Market Forecast Value (2035): USD 25.5 billion
  • Delivery Management Software Market Forecast CAGR: 8.2%
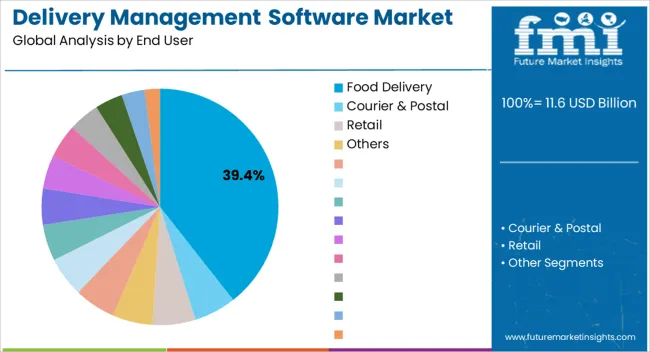
  • Leading Segment in Delivery Management Software Market in 2025: Food Delivery (39.4%)
  • Key Growth Regions in Delivery Management Software Market: North America, Asia-Pacific, Europe
  • Top Key Players in Delivery Management Software Market: Oracle Corporation, SAP SE, Descartes Systems Group, Manhattan Associates, Infor, BluJay Solutions, Project44, Bringg, FarEye, LogiNext Solutions, Onfleet, GetSwift, Shippo, FourKites, Wise Systems, DispatchTrack, Zebra Technologies

Delivery Management Software Market Market Value Analysis

Delivery Management Software Market Key Takeaways

Metric Value
Delivery Management Software Market Estimated Value in (2025 E) USD 11.6 billion
Delivery Management Software Market Forecast Value in (2035 F) USD 25.5 billion
Forecast CAGR (2025 to 2035) 8.2%

Why is the Delivery Management Software Market Growing?

The Delivery Management Software market is experiencing robust growth, driven by the ongoing expansion of e-commerce, on-demand services, and logistics optimization requirements. In the current market scenario, businesses are increasingly adopting intelligent platforms that enable real-time tracking, automated dispatch, route optimization, and data-driven decision-making. Growth is being supported by rising consumer expectations for faster and more reliable deliveries, coupled with the operational need to reduce costs and improve efficiency.

The future outlook of this market is expected to be shaped by the continued integration of artificial intelligence, machine learning, and predictive analytics into delivery management platforms. Investments in SaaS-based solutions and cloud infrastructure are further facilitating scalable adoption across small, medium, and large enterprises.

Increasing demand for contactless and last-mile delivery services, particularly in urban areas, is creating opportunities for software platforms that can provide seamless coordination among drivers, customers, and businesses The adoption of modular solutions that allow for customization according to industry-specific requirements is also driving market expansion, positioning the Delivery Management Software market for sustained growth in the coming decade.

Segmental Analysis

The delivery management software market is segmented by end user, module, deployment, and geographic regions. By end user, delivery management software market is divided into Food Delivery, Courier & Postal, Retail, and Others. In terms of module, delivery management software market is classified into Driver Application, Customer Application, Admin Application, and Dispatcher. Based on deployment, delivery management software market is segmented into SaaS-Based and On-Premise. Regionally, the delivery management software industry is classified into North America, Latin America, Western Europe, Eastern Europe, Balkan & Baltic Countries, Russia & Belarus, Central Asia, East Asia, South Asia & Pacific, and the Middle East & Africa.
Insights into the Food Delivery End User Segment

Delivery Management Software Market Analysis By End User

The Food Delivery end-user segment is projected to hold 39.40% of the Delivery Management Software market revenue in 2025, making it the leading segment. This dominance is being attributed to the rapid expansion of online food ordering platforms, increasing consumer preference for convenient delivery services, and heightened competition among restaurants to provide faster and more reliable delivery experiences.

Growth in this segment has been supported by the need for real-time order tracking, seamless communication with delivery personnel, and optimization of delivery routes to meet strict time constraints. The rise in demand for cloud-based mobile platforms that can integrate with restaurant POS systems has further accelerated adoption.

The use of analytics to monitor performance metrics, reduce delays, and enhance customer satisfaction has reinforced the segment’s position as the largest contributor to market revenue With the continuous expansion of urban delivery networks and increasing consumer reliance on digital ordering, the Food Delivery segment is expected to maintain its leadership, driven by scalable, technology-enabled operational efficiencies.
Insights into the Driver Application Module Segment

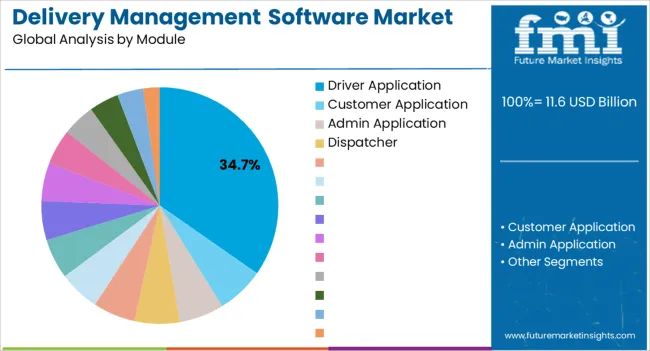
Delivery Management Software Market Analysis By Module

The Driver Application module is anticipated to account for 34.70% of the overall Delivery Management Software market revenue in 2025, reflecting its leading role among functional modules. Its growth has been enabled by the increasing emphasis on real-time driver communication, route optimization, and automated task management. This module allows drivers to efficiently manage deliveries, report status updates, and navigate dynamic traffic conditions, resulting in reduced delivery times and enhanced operational efficiency.

Adoption has been accelerated by the need to streamline last-mile operations, particularly in high-density urban areas where timely delivery is critical. The integration of AI-based routing and predictive analytics within the Driver Application module has further improved performance metrics, while mobile accessibility ensures adaptability across varied geographic regions.

The ability to upgrade the application over software updates without changing the underlying platform has reinforced its adoption As delivery networks expand and customer expectations for timely service continue to rise, the Driver Application module is expected to retain its dominant market position and drive further innovation in delivery management solutions.
Insights into the SaaS-based Deployment Segment

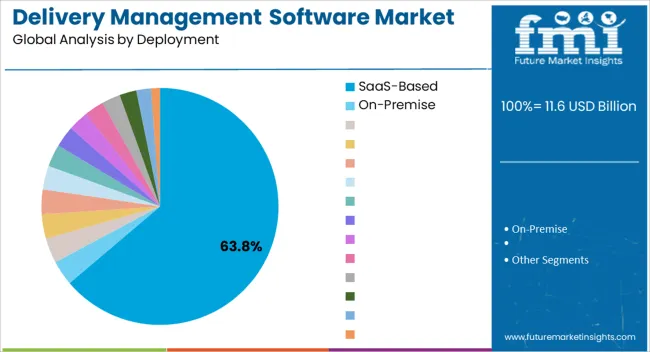
Delivery Management Software Market Analysis By Deployment

The SaaS-based deployment segment is projected to hold 63.80% of the Delivery Management Software market revenue in 2025, representing the leading deployment model. This predominance is being driven by the flexibility, scalability, and cost efficiency offered by cloud-based solutions, allowing businesses to quickly onboard, configure, and expand software without significant infrastructure investment. Growth has been reinforced by the ability to provide real-time updates, centralized management, and seamless integration with multiple endpoints, including drivers, customers, and warehouse systems.

The subscription-based pricing model reduces upfront costs and enables small and medium enterprises to access enterprise-level functionalities. Additionally, SaaS platforms facilitate rapid deployment of feature upgrades, analytics capabilities, and security enhancements, ensuring consistent performance and compliance.

The increasing reliance on remote and distributed delivery networks has further accelerated adoption As enterprises continue to prioritize operational agility, reduced IT overhead, and software flexibility, the SaaS-based deployment model is expected to maintain its leadership, driving market expansion across multiple delivery sectors.

Market Overview

Delivery Management Software Market: Overview

Transforming business operations and the increasing preferences of customers for online shopping are driving the global delivery management software market. Delivery management software connects the driver and the back-end office through a single platform.

Delivery management software provides all the information required by a driver for the delivery of an item and gives a complete overview of the delivery status to the back-end office. Through delivery management software, companies get complete information about the delivery, improvements in driver efficiency, receive real-time updates and improved tracking of deliveries, among others.

Through handheld devices, delivery management software enables the assigning of daily tasks to drivers and provides updates on deliveries, among others. Delivery management software enhances the driver efficiency by providing complete details about the pending delivery and helps avoid late delivery. Delivery management software enables the capturing of the time, date and location of delivery along with reasons for failed delivery. Delivery management software provides real-time updates and data can be directly uploaded to the ERP system, thus providing timely and accurate information needed for reporting and monitoring.

Vendors offer delivery management software with a delivery driver application, admin panel, dispatcher panel, customer tracking application and others. The delivery driver application in delivery management software provides the real-time requests, delivery verification, driver tracking, route optimisation, driver dashboard and other features.

The admin panel in the delivery management software includes route optimisation, intelligent dispatch, customer communication, reporting & analytics, real-time tracking and others. The dispatcher panel in the delivery management software includes a dispatch dashboard that aids in the creation & assignment of a task, tracking of the driver, provides notification alerts, etc. The customer tracking application in the delivery management software provides options that include order tracking, real-time updates, service feedback, contact driver and others. Vendors integrate various modules into the delivery management software, i.e. requirement analytics, payment gateways, notification integration, security compliance checks, marketing services, booking integration, support & maintenance and others.

The global delivery management software market is expected to witness double-digit Y-o-Y growth during the forecast period with a CAGR of around 14%. Several developments in delivery management software with reference to technology, along with recent developments and innovations, are expected to drive the global delivery management software market during the forecast period.
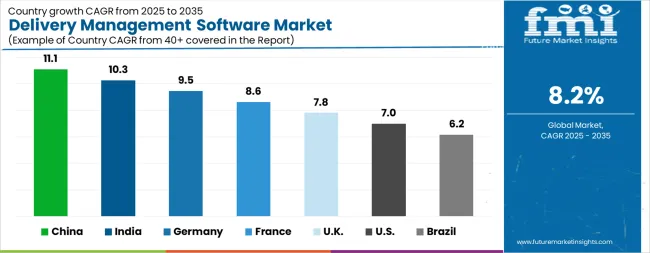
Analysis of Delivery Management Software Market By Key Countries

Delivery Management Software Market Cagr Analysis By Country
Country CAGR
China 11.1%
India 10.3%
Germany 9.5%
France 8.6%
UK 7.8%
USA 7.0%
Brazil 6.2%

Country-wise Analysis

The Delivery Management Software Market is expected to register a CAGR of 8.2% during the forecast period, exhibiting varied country level momentum. China leads with the highest CAGR of 11.1%, followed by India at 10.3%. Developed markets such as Germany, France, and the UK continue to expand steadily, while the USA is likely to grow at consistent rates. Brazil posts the lowest CAGR at 6.2%, yet still underscores a broadly positive trajectory for the global Delivery Management Software Market. In 2024, Germany held a dominant revenue in the Western Europe market and is expected to grow with a CAGR of 9.5%. The USA Delivery Management Software Market is estimated to be valued at USD 4.0 billion in 2025 and is anticipated to reach a valuation of USD 7.9 billion by 2035. Sales are projected to rise at a CAGR of 7.0% over the forecast period between 2025 and 2035. While Japan and South Korea markets are estimated to be valued at USD 522.1 million and USD 354.7 million respectively in 2025.
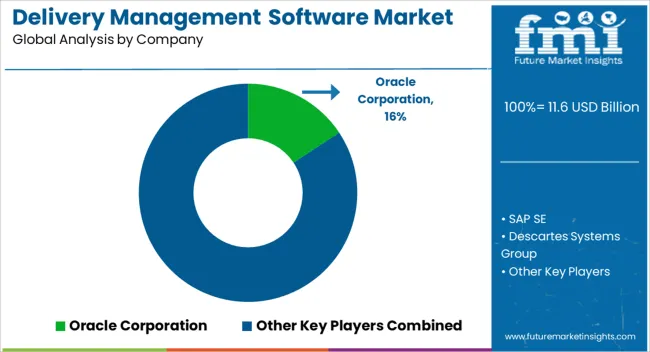
Key Players in the Delivery Management Software Market

Delivery Management Software Market Analysis By Company
  • Oracle Corporation
  • SAP SE
  • Descartes Systems Group
  • Manhattan Associates
  • Infor
  • BluJay Solutions
  • Project44
  • Bringg
  • FarEye
  • LogiNext Solutions
  • Onfleet
  • GetSwift
  • Shippo
  • FourKites
  • Wise Systems
  • DispatchTrack
  • Zebra Technologies

Scope of the Report

Item Value
Quantitative Units USD 11.6 Billion
End User Food Delivery, Courier & Postal, Retail, and Others
Module Driver Application, Customer Application, Admin Application, and Dispatcher
Deployment SaaS-Based and On-Premise
Regions Covered North America, Europe, Asia-Pacific, Latin America, Middle East & Africa
Country Covered United States, Canada, Germany, France, United Kingdom, China, Japan, India, Brazil, South Africa
Key Companies Profiled Oracle Corporation, SAP SE, Descartes Systems Group, Manhattan Associates, Infor, BluJay Solutions, Project44, Bringg, FarEye, LogiNext Solutions, Onfleet, GetSwift, Shippo, FourKites, Wise Systems, DispatchTrack, and Zebra Technologies

Delivery Management Software Market by Segments

End User:

  • Food Delivery
  • Courier & Postal
  • Retail
  • Others

Module:

  • Driver Application
  • Customer Application
  • Admin Application
  • Dispatcher

Deployment:

  • SaaS-Based
  • On-Premise

Region:

  • North America
    • USA
    • Canada
    • Mexico
  • Latin America
    • Brazil
    • Chile
    • Rest of Latin America
  • Western Europe
    • Germany
    • UK
    • Italy
    • Spain
    • France
    • Nordic
    • BENELUX
    • Rest of Western Europe
  • Eastern Europe
    • Russia
    • Poland
    • Hungary
    • Balkan & Baltic
    • Rest of Eastern Europe
  • East Asia
    • China
    • Japan
    • South Korea
  • South Asia and Pacific
    • India
    • ASEAN
    • Australia & New Zealand
    • Rest of South Asia and Pacific
  • Middle East & Africa
    • Kingdom of Saudi Arabia
    • Other GCC Countries
    • Turkiye
    • South Africa
    • Other African Union
    • Rest of Middle East & Africa

Table of Content

  1. Executive Summary
    • Global Market Outlook
    • Demand-side Trends
    • Supply-side Trends
    • Technology Roadmap Analysis
    • Analysis and Recommendations
  2. Market Overview
    • Market Coverage / Taxonomy
    • Market Definition / Scope / Limitations
  3. Market Background
    • Market Dynamics
      • Drivers
      • Restraints
      • Opportunity
      • Trends
    • Scenario Forecast
      • Demand in Optimistic Scenario
      • Demand in Likely Scenario
      • Demand in Conservative Scenario
    • Opportunity Map Analysis
    • Product Life Cycle Analysis
    • Supply Chain Analysis
    • Investment Feasibility Matrix
    • Value Chain Analysis
    • PESTLE and Porter’s Analysis
    • Regulatory Landscape
    • Regional Parent Market Outlook
    • Production and Consumption Statistics
    • Import and Export Statistics
  4. Global Market Analysis 2020 to 2024 and Forecast, 2025 to 2035
    • Historical Market Size Value (USD Million) Analysis, 2020 to 2024
    • Current and Future Market Size Value (USD Million) Projections, 2025 to 2035
      • Y-o-Y Growth Trend Analysis
      • Absolute $ Opportunity Analysis
  5. Global Market Pricing Analysis 2020 to 2024 and Forecast 2025 to 2035
  6. Global Market Analysis 2020 to 2024 and Forecast 2025 to 2035, By End User
    • Introduction / Key Findings
    • Historical Market Size Value (USD Million) Analysis By End User , 2020 to 2024
    • Current and Future Market Size Value (USD Million) Analysis and Forecast By End User , 2025 to 2035
      • Food Delivery
      • Courier & Postal
      • Retail
      • Others
    • Y-o-Y Growth Trend Analysis By End User , 2020 to 2024
    • Absolute $ Opportunity Analysis By End User , 2025 to 2035
  7. Global Market Analysis 2020 to 2024 and Forecast 2025 to 2035, By Module
    • Introduction / Key Findings
    • Historical Market Size Value (USD Million) Analysis By Module, 2020 to 2024
    • Current and Future Market Size Value (USD Million) Analysis and Forecast By Module, 2025 to 2035
      • Driver Application
      • Customer Application
      • Admin Application
      • Dispatcher
    • Y-o-Y Growth Trend Analysis By Module, 2020 to 2024
    • Absolute $ Opportunity Analysis By Module, 2025 to 2035
  8. Global Market Analysis 2020 to 2024 and Forecast 2025 to 2035, By Deployment
    • Introduction / Key Findings
    • Historical Market Size Value (USD Million) Analysis By Deployment, 2020 to 2024
    • Current and Future Market Size Value (USD Million) Analysis and Forecast By Deployment, 2025 to 2035
      • SaaS-Based
      • On-Premise
    • Y-o-Y Growth Trend Analysis By Deployment, 2020 to 2024
    • Absolute $ Opportunity Analysis By Deployment, 2025 to 2035
  9. Global Market Analysis 2020 to 2024 and Forecast 2025 to 2035, By Region
    • Introduction
    • Historical Market Size Value (USD Million) Analysis By Region, 2020 to 2024
    • Current Market Size Value (USD Million) Analysis and Forecast By Region, 2025 to 2035
      • North America
      • Latin America
      • Western Europe
      • Eastern Europe
      • East Asia
      • South Asia and Pacific
      • Middle East & Africa
    • Market Attractiveness Analysis By Region
  10. North America Market Analysis 2020 to 2024 and Forecast 2025 to 2035, By Country
    • Historical Market Size Value (USD Million) Trend Analysis By Market Taxonomy, 2020 to 2024
    • Market Size Value (USD Million) Forecast By Market Taxonomy, 2025 to 2035
      • By Country
        • USA
        • Canada
        • Mexico
      • By End User
      • By Module
      • By Deployment
    • Market Attractiveness Analysis
      • By Country
      • By End User
      • By Module
      • By Deployment
    • Key Takeaways
  11. Latin America Market Analysis 2020 to 2024 and Forecast 2025 to 2035, By Country
    • Historical Market Size Value (USD Million) Trend Analysis By Market Taxonomy, 2020 to 2024
    • Market Size Value (USD Million) Forecast By Market Taxonomy, 2025 to 2035
      • By Country
        • Brazil
        • Chile
        • Rest of Latin America
      • By End User
      • By Module
      • By Deployment
    • Market Attractiveness Analysis
      • By Country
      • By End User
      • By Module
      • By Deployment
    • Key Takeaways
  12. Western Europe Market Analysis 2020 to 2024 and Forecast 2025 to 2035, By Country
    • Historical Market Size Value (USD Million) Trend Analysis By Market Taxonomy, 2020 to 2024
    • Market Size Value (USD Million) Forecast By Market Taxonomy, 2025 to 2035
      • By Country
        • Germany
        • UK
        • Italy
        • Spain
        • France
        • Nordic
        • BENELUX
        • Rest of Western Europe
      • By End User
      • By Module
      • By Deployment
    • Market Attractiveness Analysis
      • By Country
      • By End User
      • By Module
      • By Deployment
    • Key Takeaways
  13. Eastern Europe Market Analysis 2020 to 2024 and Forecast 2025 to 2035, By Country
    • Historical Market Size Value (USD Million) Trend Analysis By Market Taxonomy, 2020 to 2024
    • Market Size Value (USD Million) Forecast By Market Taxonomy, 2025 to 2035
      • By Country
        • Russia
        • Poland
        • Hungary
        • Balkan & Baltic
        • Rest of Eastern Europe
      • By End User
      • By Module
      • By Deployment
    • Market Attractiveness Analysis
      • By Country
      • By End User
      • By Module
      • By Deployment
    • Key Takeaways
  14. East Asia Market Analysis 2020 to 2024 and Forecast 2025 to 2035, By Country
    • Historical Market Size Value (USD Million) Trend Analysis By Market Taxonomy, 2020 to 2024
    • Market Size Value (USD Million) Forecast By Market Taxonomy, 2025 to 2035
      • By Country
        • China
        • Japan
        • South Korea
      • By End User
      • By Module
      • By Deployment
    • Market Attractiveness Analysis
      • By Country
      • By End User
      • By Module
      • By Deployment
    • Key Takeaways
  15. South Asia and Pacific Market Analysis 2020 to 2024 and Forecast 2025 to 2035, By Country
    • Historical Market Size Value (USD Million) Trend Analysis By Market Taxonomy, 2020 to 2024
    • Market Size Value (USD Million) Forecast By Market Taxonomy, 2025 to 2035
      • By Country
        • India
        • ASEAN
        • Australia & New Zealand
        • Rest of South Asia and Pacific
      • By End User
      • By Module
      • By Deployment
    • Market Attractiveness Analysis
      • By Country
      • By End User
      • By Module
      • By Deployment
    • Key Takeaways
  16. Middle East & Africa Market Analysis 2020 to 2024 and Forecast 2025 to 2035, By Country
    • Historical Market Size Value (USD Million) Trend Analysis By Market Taxonomy, 2020 to 2024
    • Market Size Value (USD Million) Forecast By Market Taxonomy, 2025 to 2035
      • By Country
        • Kingdom of Saudi Arabia
        • Other GCC Countries
        • Turkiye
        • South Africa
        • Other African Union
        • Rest of Middle East & Africa
      • By End User
      • By Module
      • By Deployment
    • Market Attractiveness Analysis
      • By Country
      • By End User
      • By Module
      • By Deployment
    • Key Takeaways
  17. Key Countries Market Analysis
    • USA
      • Pricing Analysis
      • Market Share Analysis, 2024
        • By End User
        • By Module
        • By Deployment
    • Canada
      • Pricing Analysis
      • Market Share Analysis, 2024
        • By End User
        • By Module
        • By Deployment
    • Mexico
      • Pricing Analysis
      • Market Share Analysis, 2024
        • By End User
        • By Module
        • By Deployment
    • Brazil
      • Pricing Analysis
      • Market Share Analysis, 2024
        • By End User
        • By Module
        • By Deployment
    • Chile
      • Pricing Analysis
      • Market Share Analysis, 2024
        • By End User
        • By Module
        • By Deployment
    • Germany
      • Pricing Analysis
      • Market Share Analysis, 2024
        • By End User
        • By Module
        • By Deployment
    • UK
      • Pricing Analysis
      • Market Share Analysis, 2024
        • By End User
        • By Module
        • By Deployment
    • Italy
      • Pricing Analysis
      • Market Share Analysis, 2024
        • By End User
        • By Module
        • By Deployment
    • Spain
      • Pricing Analysis
      • Market Share Analysis, 2024
        • By End User
        • By Module
        • By Deployment
    • France
      • Pricing Analysis
      • Market Share Analysis, 2024
        • By End User
        • By Module
        • By Deployment
    • India
      • Pricing Analysis
      • Market Share Analysis, 2024
        • By End User
        • By Module
        • By Deployment
    • ASEAN
      • Pricing Analysis
      • Market Share Analysis, 2024
        • By End User
        • By Module
        • By Deployment
    • Australia & New Zealand
      • Pricing Analysis
      • Market Share Analysis, 2024
        • By End User
        • By Module
        • By Deployment
    • China
      • Pricing Analysis
      • Market Share Analysis, 2024
        • By End User
        • By Module
        • By Deployment
    • Japan
      • Pricing Analysis
      • Market Share Analysis, 2024
        • By End User
        • By Module
        • By Deployment
    • South Korea
      • Pricing Analysis
      • Market Share Analysis, 2024
        • By End User
        • By Module
        • By Deployment
    • Russia
      • Pricing Analysis
      • Market Share Analysis, 2024
        • By End User
        • By Module
        • By Deployment
    • Poland
      • Pricing Analysis
      • Market Share Analysis, 2024
        • By End User
        • By Module
        • By Deployment
    • Hungary
      • Pricing Analysis
      • Market Share Analysis, 2024
        • By End User
        • By Module
        • By Deployment
    • Kingdom of Saudi Arabia
      • Pricing Analysis
      • Market Share Analysis, 2024
        • By End User
        • By Module
        • By Deployment
    • Turkiye
      • Pricing Analysis
      • Market Share Analysis, 2024
        • By End User
        • By Module
        • By Deployment
    • South Africa
      • Pricing Analysis
      • Market Share Analysis, 2024
        • By End User
        • By Module
        • By Deployment
  18. Market Structure Analysis
    • Competition Dashboard
    • Competition Benchmarking
    • Market Share Analysis of Top Players
      • By Regional
      • By End User
      • By Module
      • By Deployment
  19. Competition Analysis
    • Competition Deep Dive
      • Oracle Corporation
        • Overview
        • Product Portfolio
        • Profitability by Market Segments (Product/Age /Sales Channel/Region)
        • Sales Footprint
        • Strategy Overview
          • Marketing Strategy
          • Product Strategy
          • Channel Strategy
      • SAP SE
      • Descartes Systems Group
      • Manhattan Associates
      • Infor
      • BluJay Solutions
      • Project44
      • Bringg
      • FarEye
      • LogiNext Solutions
      • Onfleet
      • GetSwift
      • Shippo
      • FourKites
      • Wise Systems
      • DispatchTrack
      • Zebra Technologies
  20. Assumptions & Acronyms Used
  21. Research Methodology

List of Tables

  • Table 1: Global Market Value (USD Million) Forecast by Region, 2020-2035
  • Table 2: Global Market Value (USD Million) Forecast by End User , 2020-2035
  • Table 3: Global Market Value (USD Million) Forecast by Module, 2020-2035
  • Table 4: Global Market Value (USD Million) Forecast by Deployment, 2020-2035
  • Table 5: North America Market Value (USD Million) Forecast by Country, 2020-2035
  • Table 6: North America Market Value (USD Million) Forecast by End User , 2020-2035
  • Table 7: North America Market Value (USD Million) Forecast by Module, 2020-2035
  • Table 8: North America Market Value (USD Million) Forecast by Deployment, 2020-2035
  • Table 9: Latin America Market Value (USD Million) Forecast by Country, 2020-2035
  • Table 10: Latin America Market Value (USD Million) Forecast by End User , 2020-2035
  • Table 11: Latin America Market Value (USD Million) Forecast by Module, 2020-2035
  • Table 12: Latin America Market Value (USD Million) Forecast by Deployment, 2020-2035
  • Table 13: Western Europe Market Value (USD Million) Forecast by Country, 2020-2035
  • Table 14: Western Europe Market Value (USD Million) Forecast by End User , 2020-2035
  • Table 15: Western Europe Market Value (USD Million) Forecast by Module, 2020-2035
  • Table 16: Western Europe Market Value (USD Million) Forecast by Deployment, 2020-2035
  • Table 17: Eastern Europe Market Value (USD Million) Forecast by Country, 2020-2035
  • Table 18: Eastern Europe Market Value (USD Million) Forecast by End User , 2020-2035
  • Table 19: Eastern Europe Market Value (USD Million) Forecast by Module, 2020-2035
  • Table 20: Eastern Europe Market Value (USD Million) Forecast by Deployment, 2020-2035
  • Table 21: East Asia Market Value (USD Million) Forecast by Country, 2020-2035
  • Table 22: East Asia Market Value (USD Million) Forecast by End User , 2020-2035
  • Table 23: East Asia Market Value (USD Million) Forecast by Module, 2020-2035
  • Table 24: East Asia Market Value (USD Million) Forecast by Deployment, 2020-2035
  • Table 25: South Asia and Pacific Market Value (USD Million) Forecast by Country, 2020-2035
  • Table 26: South Asia and Pacific Market Value (USD Million) Forecast by End User , 2020-2035
  • Table 27: South Asia and Pacific Market Value (USD Million) Forecast by Module, 2020-2035
  • Table 28: South Asia and Pacific Market Value (USD Million) Forecast by Deployment, 2020-2035
  • Table 29: Middle East & Africa Market Value (USD Million) Forecast by Country, 2020-2035
  • Table 30: Middle East & Africa Market Value (USD Million) Forecast by End User , 2020-2035
  • Table 31: Middle East & Africa Market Value (USD Million) Forecast by Module, 2020-2035
  • Table 32: Middle East & Africa Market Value (USD Million) Forecast by Deployment, 2020-2035

List of Figures

  • Figure 1: Global Market Pricing Analysis
  • Figure 2: Global Market Value (USD Million) Forecast 2020-2035
  • Figure 3: Global Market Value Share and BPS Analysis by End User , 2025 and 2035
  • Figure 4: Global Market Y-o-Y Growth Comparison by End User , 2025-2035
  • Figure 5: Global Market Attractiveness Analysis by End User
  • Figure 6: Global Market Value Share and BPS Analysis by Module, 2025 and 2035
  • Figure 7: Global Market Y-o-Y Growth Comparison by Module, 2025-2035
  • Figure 8: Global Market Attractiveness Analysis by Module
  • Figure 9: Global Market Value Share and BPS Analysis by Deployment, 2025 and 2035
  • Figure 10: Global Market Y-o-Y Growth Comparison by Deployment, 2025-2035
  • Figure 11: Global Market Attractiveness Analysis by Deployment
  • Figure 12: Global Market Value (USD Million) Share and BPS Analysis by Region, 2025 and 2035
  • Figure 13: Global Market Y-o-Y Growth Comparison by Region, 2025-2035
  • Figure 14: Global Market Attractiveness Analysis by Region
  • Figure 15: North America Market Incremental Dollar Opportunity, 2025-2035
  • Figure 16: Latin America Market Incremental Dollar Opportunity, 2025-2035
  • Figure 17: Western Europe Market Incremental Dollar Opportunity, 2025-2035
  • Figure 18: Eastern Europe Market Incremental Dollar Opportunity, 2025-2035
  • Figure 19: East Asia Market Incremental Dollar Opportunity, 2025-2035
  • Figure 20: South Asia and Pacific Market Incremental Dollar Opportunity, 2025-2035
  • Figure 21: Middle East & Africa Market Incremental Dollar Opportunity, 2025-2035
  • Figure 22: North America Market Value Share and BPS Analysis by Country, 2025 and 2035
  • Figure 23: North America Market Value Share and BPS Analysis by End User , 2025 and 2035
  • Figure 24: North America Market Y-o-Y Growth Comparison by End User , 2025-2035
  • Figure 25: North America Market Attractiveness Analysis by End User
  • Figure 26: North America Market Value Share and BPS Analysis by Module, 2025 and 2035
  • Figure 27: North America Market Y-o-Y Growth Comparison by Module, 2025-2035
  • Figure 28: North America Market Attractiveness Analysis by Module
  • Figure 29: North America Market Value Share and BPS Analysis by Deployment, 2025 and 2035
  • Figure 30: North America Market Y-o-Y Growth Comparison by Deployment, 2025-2035
  • Figure 31: North America Market Attractiveness Analysis by Deployment
  • Figure 32: Latin America Market Value Share and BPS Analysis by Country, 2025 and 2035
  • Figure 33: Latin America Market Value Share and BPS Analysis by End User , 2025 and 2035
  • Figure 34: Latin America Market Y-o-Y Growth Comparison by End User , 2025-2035
  • Figure 35: Latin America Market Attractiveness Analysis by End User
  • Figure 36: Latin America Market Value Share and BPS Analysis by Module, 2025 and 2035
  • Figure 37: Latin America Market Y-o-Y Growth Comparison by Module, 2025-2035
  • Figure 38: Latin America Market Attractiveness Analysis by Module
  • Figure 39: Latin America Market Value Share and BPS Analysis by Deployment, 2025 and 2035
  • Figure 40: Latin America Market Y-o-Y Growth Comparison by Deployment, 2025-2035
  • Figure 41: Latin America Market Attractiveness Analysis by Deployment
  • Figure 42: Western Europe Market Value Share and BPS Analysis by Country, 2025 and 2035
  • Figure 43: Western Europe Market Value Share and BPS Analysis by End User , 2025 and 2035
  • Figure 44: Western Europe Market Y-o-Y Growth Comparison by End User , 2025-2035
  • Figure 45: Western Europe Market Attractiveness Analysis by End User
  • Figure 46: Western Europe Market Value Share and BPS Analysis by Module, 2025 and 2035
  • Figure 47: Western Europe Market Y-o-Y Growth Comparison by Module, 2025-2035
  • Figure 48: Western Europe Market Attractiveness Analysis by Module
  • Figure 49: Western Europe Market Value Share and BPS Analysis by Deployment, 2025 and 2035
  • Figure 50: Western Europe Market Y-o-Y Growth Comparison by Deployment, 2025-2035
  • Figure 51: Western Europe Market Attractiveness Analysis by Deployment
  • Figure 52: Eastern Europe Market Value Share and BPS Analysis by Country, 2025 and 2035
  • Figure 53: Eastern Europe Market Value Share and BPS Analysis by End User , 2025 and 2035
  • Figure 54: Eastern Europe Market Y-o-Y Growth Comparison by End User , 2025-2035
  • Figure 55: Eastern Europe Market Attractiveness Analysis by End User
  • Figure 56: Eastern Europe Market Value Share and BPS Analysis by Module, 2025 and 2035
  • Figure 57: Eastern Europe Market Y-o-Y Growth Comparison by Module, 2025-2035
  • Figure 58: Eastern Europe Market Attractiveness Analysis by Module
  • Figure 59: Eastern Europe Market Value Share and BPS Analysis by Deployment, 2025 and 2035
  • Figure 60: Eastern Europe Market Y-o-Y Growth Comparison by Deployment, 2025-2035
  • Figure 61: Eastern Europe Market Attractiveness Analysis by Deployment
  • Figure 62: East Asia Market Value Share and BPS Analysis by Country, 2025 and 2035
  • Figure 63: East Asia Market Value Share and BPS Analysis by End User , 2025 and 2035
  • Figure 64: East Asia Market Y-o-Y Growth Comparison by End User , 2025-2035
  • Figure 65: East Asia Market Attractiveness Analysis by End User
  • Figure 66: East Asia Market Value Share and BPS Analysis by Module, 2025 and 2035
  • Figure 67: East Asia Market Y-o-Y Growth Comparison by Module, 2025-2035
  • Figure 68: East Asia Market Attractiveness Analysis by Module
  • Figure 69: East Asia Market Value Share and BPS Analysis by Deployment, 2025 and 2035
  • Figure 70: East Asia Market Y-o-Y Growth Comparison by Deployment, 2025-2035
  • Figure 71: East Asia Market Attractiveness Analysis by Deployment
  • Figure 72: South Asia and Pacific Market Value Share and BPS Analysis by Country, 2025 and 2035
  • Figure 73: South Asia and Pacific Market Value Share and BPS Analysis by End User , 2025 and 2035
  • Figure 74: South Asia and Pacific Market Y-o-Y Growth Comparison by End User , 2025-2035
  • Figure 75: South Asia and Pacific Market Attractiveness Analysis by End User
  • Figure 76: South Asia and Pacific Market Value Share and BPS Analysis by Module, 2025 and 2035
  • Figure 77: South Asia and Pacific Market Y-o-Y Growth Comparison by Module, 2025-2035
  • Figure 78: South Asia and Pacific Market Attractiveness Analysis by Module
  • Figure 79: South Asia and Pacific Market Value Share and BPS Analysis by Deployment, 2025 and 2035
  • Figure 80: South Asia and Pacific Market Y-o-Y Growth Comparison by Deployment, 2025-2035
  • Figure 81: South Asia and Pacific Market Attractiveness Analysis by Deployment
  • Figure 82: Middle East & Africa Market Value Share and BPS Analysis by Country, 2025 and 2035
  • Figure 83: Middle East & Africa Market Value Share and BPS Analysis by End User , 2025 and 2035
  • Figure 84: Middle East & Africa Market Y-o-Y Growth Comparison by End User , 2025-2035
  • Figure 85: Middle East & Africa Market Attractiveness Analysis by End User
  • Figure 86: Middle East & Africa Market Value Share and BPS Analysis by Module, 2025 and 2035
  • Figure 87: Middle East & Africa Market Y-o-Y Growth Comparison by Module, 2025-2035
  • Figure 88: Middle East & Africa Market Attractiveness Analysis by Module
  • Figure 89: Middle East & Africa Market Value Share and BPS Analysis by Deployment, 2025 and 2035
  • Figure 90: Middle East & Africa Market Y-o-Y Growth Comparison by Deployment, 2025-2035
  • Figure 91: Middle East & Africa Market Attractiveness Analysis by Deployment
  • Figure 92: Global Market - Tier Structure Analysis
  • Figure 93: Global Market - Company Share Analysis

Frequently Asked Questions

How big is the delivery management software market in 2025?

The global delivery management software market is estimated to be valued at USD 11.6 billion in 2025.

What will be the size of delivery management software market in 2035?

The market size for the delivery management software market is projected to reach USD 25.5 billion by 2035.

How much will be the delivery management software market growth between 2025 and 2035?

The delivery management software market is expected to grow at a 8.2% CAGR between 2025 and 2035.

What are the key product types in the delivery management software market?

The key product types in delivery management software market are food delivery, courier & postal, retail and others.

Which module segment to contribute significant share in the delivery management software market in 2025?

In terms of module, driver application segment to command 34.7% share in the delivery management software market in 2025.

Explore Similar Insights

Future Market Insights

Delivery Management Software Market

Chat With

MaRIA

Hi There, I am MaRIA, Your Market Research Intelligence Assistant. How may I help you?