Reports

- Global Locations -

Headquarters

Future Market Insights, Inc.

Christiana Corporate, 200
Continental Drive, Suite 401,
Newark, Delaware - 19713,
United States

T: +1-845-579-5705

Americas

Future Market Insights, Inc.

616 Corporate Way, Suite 2-9018,
Valley Cottage, NY 10989, United States

T: +1-347-918-3531

MEA

Future Market Insights

1602-6 Jumeirah Bay X2 Tower, Plot No: JLT-PH2-X2A,
Jumeirah Lakes Towers, Dubai,
United Arab Emirates

Europe

Future Market Insights

3rd Floor, 207 Regent Street,
W1B 3HH London
United Kingdom

T: + 44 (0) 20 8123 9659
D: +44 (0) 20 3287 4268

Asia Pacific

Future Market Insights

IndiaLand Global Tech Park, Unit UG-1, Behind Grand HighStreet, Phase 1, Hinjawadi, MH, Pune – 411057, India

A Complete Study of Content Delivery Network Industry in Korea from 2024 to 2034

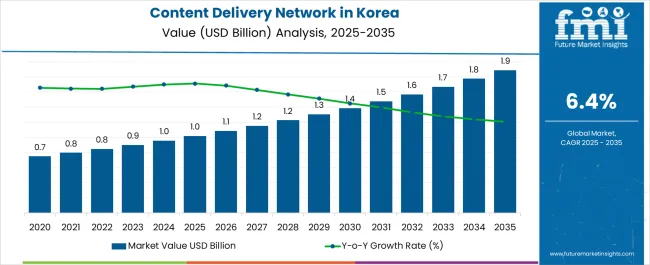
The demand for a content delivery network in Korea is anticipated to exhibit a promising CAGR of 6.7% through 2034. Content delivery network (CDN) sales are expected to grow considerably, from US$ 955.3 million in 2024 to around US$ 1,820.4 million by 2034.

Attributes Key Statistics
Expected Base Year Value (2024) US$ 955.3 million
Anticipated Forecast Value (2034) US$ 1,820.4 million
Estimated Growth (2024 to 2034) 6.7 % CAGR

Don't pay for what you don't need

Customize your report by selecting specific countries or regions and save 30%!

Key Highlights

Rapid Growth in Online Content Consumption Drives the CDN Industry Growth in Korea

Korea is technologically one of the most advanced countries in the world. In the last few years, the demand for online content, including streaming services, gaming, and eCommerce, has grown substantially in Korea. The young population in Korea relies heavily on digital platforms for entertainment, information, and shopping. This has increased the demand for efficient content delivery, driving the expansion of CDN services.

Apart from this, internet services have penetrated every nook and corner of the Korean region. The availability of high-speed internet in the hands of the general Korean population has also been one of the significant drivers for the expansion of this industry. The demand for CDN services is also soaring due to the rise of video streaming services in Korea.

Consumption Analysis of Content Delivery Network in Korea

  • Media and entertainment companies are among Korea's largest consumers of Content Delivery Networks. These companies use CDN solutions to ensure low-latency streaming, reduced buffering, and an improved experience for their viewers.
  • Online gaming companies also significantly contribute to the Korean CDN industry. These companies use CDN to optimize the delivery of game updates, patches, and in-game content to players.
  • Social media platforms and content-sharing websites also utilize CDN to deliver images, videos, and other multimedia content to users. They also employ these networks to optimize the loading times of content for a better viewing experience.
  • Online news outlets and information portals use CDN to promptly deliver news articles, videos, and other content to their readers. CDN help these companies manage traffic and provide continuous updates to viewers during breaking news events.
Sudip Saha
Sudip Saha

Principal Consultant

Talk to Analyst

Find your sweet spots for generating winning opportunities in this market.

Comparative View of Adjacent Content Delivery Network in Key Markets

The table outlines the differences in the adoption patterns of content delivery networks in Korea, Japan, and the global industry. It also mentions the estimated growth rates of the respective industries, their growth factors, and critical challenges in the forecast period from 2024 to 2034. It is evident that, in comparison with Japan and Korea, the Content Delivery Network industry is likely to expand rapidly on a global scale.

Demand for Content Delivery Network in Korea:

Attributes Demand for Content Delivery Network in Korea
CAGR (2024 to 2034) 6.7%
Valuation (2024) US$ 955.3 million
Growth Factor The rise of online gaming culture in the country
Key Challenge Online content growth escalates cybersecurity risks

Demand for Content Delivery Network in Japan:

Attributes Demand for Content Delivery Network in Japan
CAGR (2024 to 2034) 18.8%
Valuation (2024) US$ 2,150.2 million
Growth Factor The rise of internet penetration and social media sites in the country
Key Challenge Rising bandwidth costs are the prime challenge in this industry

Global Content Delivery Network Industry Analysis:

Attributes Global Content Delivery Network Industry Analysis
CAGR (2024 to 2034) 20.8%
Valuation (2024) US$ 28,445.1 million
Growth Factor The widespread use of smartphones and other mobile devices
Key Challenge Global network coverage challenges in remote areas

Category-wise Insights

CDN become Crucial for Optimizing the Transmission of Content from Source to End Users

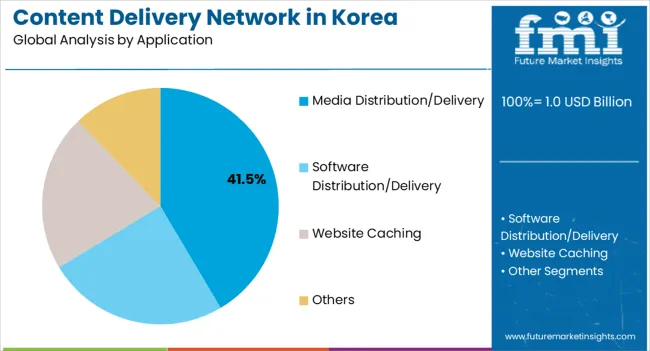
On the basis of application, media distribution/delivery dominates the Korea content delivery network industry, with a whopping share of 24.40%. Not only this, CDN also provide scalability to handle sudden spikes in demand during media events, such as live streaming of sports events, concerts, or popular TV shows.

Attributes Details
Application Media Distribution/Delivery
Value Share in 2024 24.40%

For decades, the media distribution industry has been looking for an efficient way to distribute content in large quantities. CDN deploy servers in multiple locations worldwide, significantly reducing latency and improving load times. This is crucial for media distribution, especially in streaming services, where delays can result in buffering and a poor user experience. Their demand in the media distribution and delivery industry is also rising because of their capability to provide effective analytics tools to monitor the performance of media distribution.

CDN is Gaining Popularity in Media and Entertainment Vertical

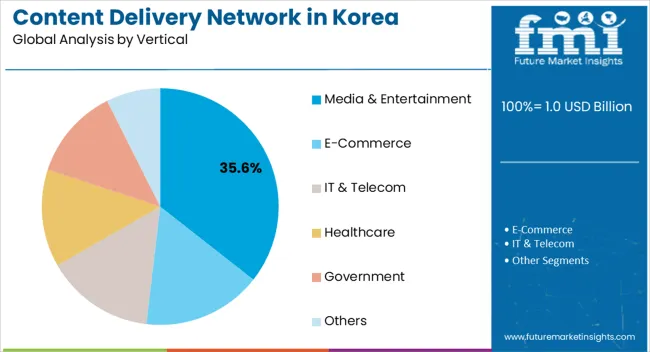
Based on the vertical, media and entertainment industries dominate the Korea CDN industry, holding a share of 15.50%. CDN are in high demand in Korea because they enhance user experience by preventing buffering, reducing load times, and ensuring smooth content delivery.

Attributes Details
Vertical Media and Entertainment
Value Share in 2024 15.50%

The demand for CDN in the Korean media and entertainment world is high, enabling companies to deliver content globally. Video streaming is a dominant form of media consumption, and CDN are instrumental in optimizing the delivery of video content.
Get the data you need at a Fraction of the cost

Personalize your report by choosing insights you need
and save 40%!

Competitive Landscape

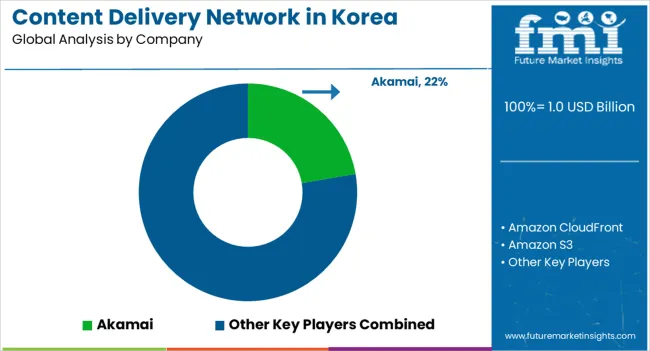
The competitive landscape of the content delivery network industry in Korea is filled with numerous players, such as Akamai, Amazon CloudFront, Alibaba Cloud CDN, etc. These companies provide content delivery services not only to local consumers but also to international consumers. The sustenance of small and new enterprises in this cutthroat competition is very difficult. In this scenario, players have to keep up with new technological innovations and evolving consumer demands to stay relevant in the industry.

Recent Developments in the Content Delivery Network Industry in Korea:

  • In October 2023, Lumen Technologies announced the successful completion of the sale of specific Content Delivery Network (CDN) service contracts to Akamai Technologies, Inc.
  • In June 2023, Bharti Airtel was selected by the Digital India Corporation to oversee the management of the Cloud and Content Delivery Network for DIKSHA, India's national education platform.
  • In 2022, Google Cloud announced the general availability of Media CDN, a tailored content delivery network designed for media and entertainment companies.

Some of the Key Players Offering Content Delivery Network in Korea:

  • Akamai
  • Amazon CloudFront
  • Amazon S3
  • Alibaba Cloud CDN
  • Cloudflare
  • Fastly
  • Google Cloud CDN
  • Limelight Networks
  • Microsoft Azure CDN
  • Oracle Cloud Infrastructure CDN
  • StackPath
  • Verizon Cloud CDN

Scope of the Report

Attribute Details
Estimated Valuation (2024) US$ 955.3 million
Projected Valuation (2034) US$ 1,820.4 million
Anticipated CAGR (2024 to 2034) 6.7% CAGR
Historical Analysis of the Content Delivery Network in Korea 2018 to 2022
Demand Forecast for the Content Delivery Network in Korea 2024 to 2034
Quantitative Units Revenue in US$ million and CAGR from 2024 to 2034
Report Coverage Revenue Forecast, Company Ranking, Competitive Landscape, Growth Factors, Trends and Pricing Analysis
Key Companies Profiled
  • Akamai
  • Amazon CloudFront
  • Amazon S3
  • Alibaba Cloud CDN
  • Cloudflare
  • Fastly
  • Google Cloud CDN
  • Limelight Networks
  • Microsoft Azure CDN
  • Oracle Cloud Infrastructure CDN
  • StackPath
  • Verizon Cloud CDN

Korea Content Delivery Network Industry by Category

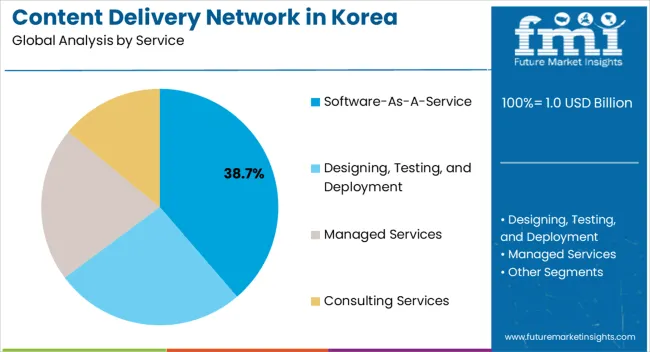
By Service:

  • Designing, Testing, and Deployment
  • Software-as-a-Service
    • Bundled Suites
    • Individual Modules
      • Digital Rights Management
      • CDN Delivery
      • CDN Analytics & Monitoring
      • Transparent Caching
      • Others
  • Managed Services
  • Consulting Services

By Application:

  • Media Distribution/Delivery
  • Software Distribution/Delivery
  • Website Caching
  • Others

By Vertical:

  • Media & Entertainment
  • eCommerce
  • IT & Telecom
  • Healthcare
  • Government
  • Others

By Service Provider:

  • Telecom CDN
  • Conventional CDN
  • Others

Key Province:

  • South Gyeongsang
  • North Jeolla
  • South Jeolla
  • Jeju

Frequently Asked Questions

At What Rate is the Content Delivery Network Industry Growing in Korea?

The anticipated CAGR for the content delivery network industry in Korea through 2034 is 6.7%.

How Big will the Content Delivery Network Landscape be in Korea?

The content delivery network industry in Korea is likely to reach US$ 1,820.4 million by 2034.

In which Vertical is CDN Consumed the most?

In Korea, CDN services are consumed primarily in the media and entertainment vertical.

Which is the most Common Application for Content Delivery Networks?

In Korea, the media distribution and delivery is the leading consumer of CDN services.

Table of Content

1. Executive Summary

    1.1. Market Outlook

    1.2. Demand-side Trends

    1.3. Supply-side Trends

    1.4. Technology Roadmap Analysis

    1.5. Analysis and Recommendations

2. Market Overview

    2.1. Market Coverage / Taxonomy

    2.2. Market Definition / Scope / Limitations

3. Market Background

    3.1. Market Dynamics

        3.1.1. Drivers

        3.1.2. Restraints

        3.1.3. Opportunity

        3.1.4. Trends

    3.2. Scenario Forecast

        3.2.1. Demand in Optimistic Scenario

        3.2.2. Demand in Likely Scenario

        3.2.3. Demand in Conservative Scenario

    3.3. Opportunity Map Analysis

    3.4. Investment Feasibility Matrix

    3.5. PESTLE and Porter’s Analysis

    3.6. Regulatory Landscape

        3.6.1. By Key Regions

    3.7. Regional Parent Market Outlook

4. Industry Analysis and Outlook 2019 to 2023 and Forecast, 2024 to 2034

    4.1. Historical Market Size Value (US$ Million) Analysis, 2019 to 2023

    4.2. Current and Future Market Size Value (US$ Million) Projections, 2024 to 2034

        4.2.1. Y-o-Y Growth Trend Analysis

        4.2.2. Absolute $ Opportunity Analysis

5. Industry Analysis and Outlook 2019 to 2023 and Forecast 2024 to 2034, By Service

    5.1. Introduction / Key Findings

    5.2. Historical Market Size Value (US$ Million) Analysis By Service, 2019 to 2023

    5.3. Current and Future Market Size Value (US$ Million) Analysis and Forecast By Service, 2024 to 2034

        5.3.1. Designing, Testing, and Deployment

        5.3.2. Software-as-a-Service

            5.3.2.1. Bundled Suites

            5.3.2.2. Individual Modules

    5.4. Y-o-Y Growth Trend Analysis By Service, 2019 to 2023

    5.5. Absolute $ Opportunity Analysis By Service, 2024 to 2034

6. Industry Analysis and Outlook 2019 to 2023 and Forecast 2024 to 2034, By Application

    6.1. Introduction / Key Findings

    6.2. Historical Market Size Value (US$ Million) Analysis By Application, 2019 to 2023

    6.3. Current and Future Market Size Value (US$ Million) Analysis and Forecast By Application, 2024 to 2034

        6.3.1. Media Distribution/Delivery

        6.3.2. Software Distribution/Delivery

        6.3.3. Website Caching

        6.3.4. Others

    6.4. Y-o-Y Growth Trend Analysis By Application, 2019 to 2023

    6.5. Absolute $ Opportunity Analysis By Application, 2024 to 2034

7. Industry Analysis and Outlook 2019 to 2023 and Forecast 2024 to 2034, By Vertical

    7.1. Introduction / Key Findings

    7.2. Historical Market Size Value (US$ Million) Analysis By Vertical, 2019 to 2023

    7.3. Current and Future Market Size Value (US$ Million) Analysis and Forecast By Vertical, 2024 to 2034

        7.3.1. Media & Entertainment

        7.3.2. e-Commerce

        7.3.3. IT & Telecom

        7.3.4. Healthcare

        7.3.5. Government

        7.3.6. Advertisement

        7.3.7. Others

    7.4. Y-o-Y Growth Trend Analysis By Vertical, 2019 to 2023

    7.5. Absolute $ Opportunity Analysis By Vertical, 2024 to 2034

8. Industry Analysis and Outlook 2019 to 2023 and Forecast 2024 to 2034, By Service Provider

    8.1. Introduction / Key Findings

    8.2. Historical Market Size Value (US$ Million) Analysis By Service Provider, 2019 to 2023

    8.3. Current and Future Market Size Value (US$ Million) Analysis and Forecast By Service Provider, 2024 to 2034

        8.3.1. Telecom CDNs

        8.3.2. Conventional CDNs

        8.3.3. Others

    8.4. Y-o-Y Growth Trend Analysis By Service Provider, 2019 to 2023

    8.5. Absolute $ Opportunity Analysis By Service Provider, 2024 to 2034

9. Industry Analysis and Outlook 2019 to 2023 and Forecast 2024 to 2034, By Region

    9.1. Introduction

    9.2. Historical Market Size Value (US$ Million) Analysis By Region, 2019 to 2023

    9.3. Current Market Size Value (US$ Million) Analysis and Forecast By Region, 2024 to 2034

        9.3.1. South Gyeongsang

        9.3.2. North Jeolla

        9.3.3. South Jeolla

        9.3.4. Jeju

        9.3.5. Rest of Korea

    9.4. Market Attractiveness Analysis By Region

10. South Gyeongsang Industry Analysis and Outlook 2019 to 2023 and Forecast 2024 to 2034

    10.1. Historical Market Size Value (US$ Million) Trend Analysis By Market Taxonomy, 2019 to 2023

    10.2. Market Size Value (US$ Million) Forecast By Market Taxonomy, 2024 to 2034

        10.2.1. By Service

        10.2.2. By Application

        10.2.3. By Vertical

        10.2.4. By Service Provider

    10.3. Market Attractiveness Analysis

        10.3.1. By Service

        10.3.2. By Application

        10.3.3. By Vertical

        10.3.4. By Service Provider

    10.4. Key Takeaways

11. North Jeolla Industry Analysis and Outlook 2019 to 2023 and Forecast 2024 to 2034

    11.1. Historical Market Size Value (US$ Million) Trend Analysis By Market Taxonomy, 2019 to 2023

    11.2. Market Size Value (US$ Million) Forecast By Market Taxonomy, 2024 to 2034

        11.2.1. By Service

        11.2.2. By Application

        11.2.3. By Vertical

        11.2.4. By Service Provider

    11.3. Market Attractiveness Analysis

        11.3.1. By Service

        11.3.2. By Application

        11.3.3. By Vertical

        11.3.4. By Service Provider

    11.4. Key Takeaways

12. South Jeolla Industry Analysis and Outlook 2019 to 2023 and Forecast 2024 to 2034

    12.1. Historical Market Size Value (US$ Million) Trend Analysis By Market Taxonomy, 2019 to 2023

    12.2. Market Size Value (US$ Million) Forecast By Market Taxonomy, 2024 to 2034

        12.2.1. By Service

        12.2.2. By Application

        12.2.3. By Vertical

        12.2.4. By Service Provider

    12.3. Market Attractiveness Analysis

        12.3.1. By Service

        12.3.2. By Application

        12.3.3. By Vertical

        12.3.4. By Service Provider

    12.4. Key Takeaways

13. Jeju Industry Analysis and Outlook 2019 to 2023 and Forecast 2024 to 2034

    13.1. Historical Market Size Value (US$ Million) Trend Analysis By Market Taxonomy, 2019 to 2023

    13.2. Market Size Value (US$ Million) Forecast By Market Taxonomy, 2024 to 2034

        13.2.1. By Service

        13.2.2. By Application

        13.2.3. By Vertical

        13.2.4. By Service Provider

    13.3. Market Attractiveness Analysis

        13.3.1. By Service

        13.3.2. By Application

        13.3.3. By Vertical

        13.3.4. By Service Provider

    13.4. Key Takeaways

14. Rest of Industry Analysis and Outlook 2019 to 2023 and Forecast 2024 to 2034

    14.1. Historical Market Size Value (US$ Million) Trend Analysis By Market Taxonomy, 2019 to 2023

    14.2. Market Size Value (US$ Million) Forecast By Market Taxonomy, 2024 to 2034

        14.2.1. By Service

        14.2.2. By Application

        14.2.3. By Vertical

        14.2.4. By Service Provider

    14.3. Market Attractiveness Analysis

        14.3.1. By Service

        14.3.2. By Application

        14.3.3. By Vertical

        14.3.4. By Service Provider

    14.4. Key Takeaways

15. Market Structure Analysis

    15.1. Competition Dashboard

    15.2. Competition Benchmarking

    15.3. Market Share Analysis of Top Players

        15.3.1. By Regional

        15.3.2. By Service

        15.3.3. By Application

        15.3.4. By Vertical

        15.3.5. By Service Provider

16. Competition Analysis

    16.1. Competition Deep Dive

        16.1.1. Bunny CDN

            16.1.1.1. Overview

            16.1.1.2. Product Portfolio

            16.1.1.3. Profitability by Market Segments

            16.1.1.4. Sales Footprint

            16.1.1.5. Strategy Overview

                16.1.1.5.1. Marketing Strategy

        16.1.2. CacheFly

            16.1.2.1. Overview

            16.1.2.2. Product Portfolio

            16.1.2.3. Profitability by Market Segments

            16.1.2.4. Sales Footprint

            16.1.2.5. Strategy Overview

                16.1.2.5.1. Marketing Strategy

        16.1.3. Limelight Networks Inc.

            16.1.3.1. Overview

            16.1.3.2. Product Portfolio

            16.1.3.3. Profitability by Market Segments

            16.1.3.4. Sales Footprint

            16.1.3.5. Strategy Overview

                16.1.3.5.1. Marketing Strategy

        16.1.4. CDNetworks Co. Ltd.

            16.1.4.1. Overview

            16.1.4.2. Product Portfolio

            16.1.4.3. Profitability by Market Segments

            16.1.4.4. Sales Footprint

            16.1.4.5. Strategy Overview

                16.1.4.5.1. Marketing Strategy

        16.1.5. Orange S.A.

            16.1.5.1. Overview

            16.1.5.2. Product Portfolio

            16.1.5.3. Profitability by Market Segments

            16.1.5.4. Sales Footprint

            16.1.5.5. Strategy Overview

                16.1.5.5.1. Marketing Strategy

        16.1.6. AT&T

            16.1.6.1. Overview

            16.1.6.2. Product Portfolio

            16.1.6.3. Profitability by Market Segments

            16.1.6.4. Sales Footprint

            16.1.6.5. Strategy Overview

                16.1.6.5.1. Marketing Strategy

        16.1.7. Deutsche Telekom AG

            16.1.7.1. Overview

            16.1.7.2. Product Portfolio

            16.1.7.3. Profitability by Market Segments

            16.1.7.4. Sales Footprint

            16.1.7.5. Strategy Overview

                16.1.7.5.1. Marketing Strategy

        16.1.8. StackPath LLC

            16.1.8.1. Overview

            16.1.8.2. Product Portfolio

            16.1.8.3. Profitability by Market Segments

            16.1.8.4. Sales Footprint

            16.1.8.5. Strategy Overview

                16.1.8.5.1. Marketing Strategy

        16.1.9. Microsoft Corporation

            16.1.9.1. Overview

            16.1.9.2. Product Portfolio

            16.1.9.3. Profitability by Market Segments

            16.1.9.4. Sales Footprint

            16.1.9.5. Strategy Overview

                16.1.9.5.1. Marketing Strategy

        16.1.10. CenturyLink

            16.1.10.1. Overview

            16.1.10.2. Product Portfolio

            16.1.10.3. Profitability by Market Segments

            16.1.10.4. Sales Footprint

            16.1.10.5. Strategy Overview

                16.1.10.5.1. Marketing Strategy

17. Assumptions & Acronyms Used

18. Research Methodology

List of Tables

Table 1: Industry Analysis and Outlook Value (US$ Million) Forecast by Region, 2019 to 2034

Table 2: Industry Analysis and Outlook Value (US$ Million) Forecast by Service, 2019 to 2034

Table 3: Industry Analysis and Outlook Value (US$ Million) Forecast by Application, 2019 to 2034

Table 4: Industry Analysis and Outlook Value (US$ Million) Forecast by Vertical, 2019 to 2034

Table 5: Industry Analysis and Outlook Value (US$ Million) Forecast by Service Provider, 2019 to 2034

Table 6: South Gyeongsang Industry Analysis and Outlook Value (US$ Million) Forecast by Service, 2019 to 2034

Table 7: South Gyeongsang Industry Analysis and Outlook Value (US$ Million) Forecast by Application, 2019 to 2034

Table 8: South Gyeongsang Industry Analysis and Outlook Value (US$ Million) Forecast by Vertical, 2019 to 2034

Table 9: South Gyeongsang Industry Analysis and Outlook Value (US$ Million) Forecast by Service Provider, 2019 to 2034

Table 10: North Jeolla Industry Analysis and Outlook Value (US$ Million) Forecast by Service, 2019 to 2034

Table 11: North Jeolla Industry Analysis and Outlook Value (US$ Million) Forecast by Application, 2019 to 2034

Table 12: North Jeolla Industry Analysis and Outlook Value (US$ Million) Forecast by Vertical, 2019 to 2034

Table 13: North Jeolla Industry Analysis and Outlook Value (US$ Million) Forecast by Service Provider, 2019 to 2034

Table 14: South Jeolla Industry Analysis and Outlook Value (US$ Million) Forecast by Service, 2019 to 2034

Table 15: South Jeolla Industry Analysis and Outlook Value (US$ Million) Forecast by Application, 2019 to 2034

Table 16: South Jeolla Industry Analysis and Outlook Value (US$ Million) Forecast by Vertical, 2019 to 2034

Table 17: South Jeolla Industry Analysis and Outlook Value (US$ Million) Forecast by Service Provider, 2019 to 2034

Table 18: Jeju Industry Analysis and Outlook Value (US$ Million) Forecast by Service, 2019 to 2034

Table 19: Jeju Industry Analysis and Outlook Value (US$ Million) Forecast by Application, 2019 to 2034

Table 20: Jeju Industry Analysis and Outlook Value (US$ Million) Forecast by Vertical, 2019 to 2034

Table 21: Jeju Industry Analysis and Outlook Value (US$ Million) Forecast by Service Provider, 2019 to 2034

Table 22: Rest of Industry Analysis and Outlook Value (US$ Million) Forecast by Service, 2019 to 2034

Table 23: Rest of Industry Analysis and Outlook Value (US$ Million) Forecast by Application, 2019 to 2034

Table 24: Rest of Industry Analysis and Outlook Value (US$ Million) Forecast by Vertical, 2019 to 2034

Table 25: Rest of Industry Analysis and Outlook Value (US$ Million) Forecast by Service Provider, 2019 to 2034

List of Charts

Figure 1: Industry Analysis and Outlook Value (US$ Million) by Service, 2024 to 2034

Figure 2: Industry Analysis and Outlook Value (US$ Million) by Application, 2024 to 2034

Figure 3: Industry Analysis and Outlook Value (US$ Million) by Vertical, 2024 to 2034

Figure 4: Industry Analysis and Outlook Value (US$ Million) by Service Provider, 2024 to 2034

Figure 5: Industry Analysis and Outlook Value (US$ Million) by Region, 2024 to 2034

Figure 6: Industry Analysis and Outlook Value (US$ Million) Analysis by Region, 2019 to 2034

Figure 7: Industry Analysis and Outlook Value Share (%) and BPS Analysis by Region, 2024 to 2034

Figure 8: Industry Analysis and Outlook Y-o-Y Growth (%) Projections by Region, 2024 to 2034

Figure 9: Industry Analysis and Outlook Value (US$ Million) Analysis by Service, 2019 to 2034

Figure 10: Industry Analysis and Outlook Value Share (%) and BPS Analysis by Service, 2024 to 2034

Figure 11: Industry Analysis and Outlook Y-o-Y Growth (%) Projections by Service, 2024 to 2034

Figure 12: Industry Analysis and Outlook Value (US$ Million) Analysis by Application, 2019 to 2034

Figure 13: Industry Analysis and Outlook Value Share (%) and BPS Analysis by Application, 2024 to 2034

Figure 14: Industry Analysis and Outlook Y-o-Y Growth (%) Projections by Application, 2024 to 2034

Figure 15: Industry Analysis and Outlook Value (US$ Million) Analysis by Vertical, 2019 to 2034

Figure 16: Industry Analysis and Outlook Value Share (%) and BPS Analysis by Vertical, 2024 to 2034

Figure 17: Industry Analysis and Outlook Y-o-Y Growth (%) Projections by Vertical, 2024 to 2034

Figure 18: Industry Analysis and Outlook Value (US$ Million) Analysis by Service Provider, 2019 to 2034

Figure 19: Industry Analysis and Outlook Value Share (%) and BPS Analysis by Service Provider, 2024 to 2034

Figure 20: Industry Analysis and Outlook Y-o-Y Growth (%) Projections by Service Provider, 2024 to 2034

Figure 21: Industry Analysis and Outlook Attractiveness by Service, 2024 to 2034

Figure 22: Industry Analysis and Outlook Attractiveness by Application, 2024 to 2034

Figure 23: Industry Analysis and Outlook Attractiveness by Vertical, 2024 to 2034

Figure 24: Industry Analysis and Outlook Attractiveness by Service Provider, 2024 to 2034

Figure 25: Industry Analysis and Outlook Attractiveness by Region, 2024 to 2034

Figure 26: South Gyeongsang Industry Analysis and Outlook Value (US$ Million) by Service, 2024 to 2034

Figure 27: South Gyeongsang Industry Analysis and Outlook Value (US$ Million) by Application, 2024 to 2034

Figure 28: South Gyeongsang Industry Analysis and Outlook Value (US$ Million) by Vertical, 2024 to 2034

Figure 29: South Gyeongsang Industry Analysis and Outlook Value (US$ Million) by Service Provider, 2024 to 2034

Figure 30: South Gyeongsang Industry Analysis and Outlook Value (US$ Million) Analysis by Service, 2019 to 2034

Figure 31: South Gyeongsang Industry Analysis and Outlook Value Share (%) and BPS Analysis by Service, 2024 to 2034

Figure 32: South Gyeongsang Industry Analysis and Outlook Y-o-Y Growth (%) Projections by Service, 2024 to 2034

Figure 33: South Gyeongsang Industry Analysis and Outlook Value (US$ Million) Analysis by Application, 2019 to 2034

Figure 34: South Gyeongsang Industry Analysis and Outlook Value Share (%) and BPS Analysis by Application, 2024 to 2034

Figure 35: South Gyeongsang Industry Analysis and Outlook Y-o-Y Growth (%) Projections by Application, 2024 to 2034

Figure 36: South Gyeongsang Industry Analysis and Outlook Value (US$ Million) Analysis by Vertical, 2019 to 2034

Figure 37: South Gyeongsang Industry Analysis and Outlook Value Share (%) and BPS Analysis by Vertical, 2024 to 2034

Figure 38: South Gyeongsang Industry Analysis and Outlook Y-o-Y Growth (%) Projections by Vertical, 2024 to 2034

Figure 39: South Gyeongsang Industry Analysis and Outlook Value (US$ Million) Analysis by Service Provider, 2019 to 2034

Figure 40: South Gyeongsang Industry Analysis and Outlook Value Share (%) and BPS Analysis by Service Provider, 2024 to 2034

Figure 41: South Gyeongsang Industry Analysis and Outlook Y-o-Y Growth (%) Projections by Service Provider, 2024 to 2034

Figure 42: South Gyeongsang Industry Analysis and Outlook Attractiveness by Service, 2024 to 2034

Figure 43: South Gyeongsang Industry Analysis and Outlook Attractiveness by Application, 2024 to 2034

Figure 44: South Gyeongsang Industry Analysis and Outlook Attractiveness by Vertical, 2024 to 2034

Figure 45: South Gyeongsang Industry Analysis and Outlook Attractiveness by Service Provider, 2024 to 2034

Figure 46: North Jeolla Industry Analysis and Outlook Value (US$ Million) by Service, 2024 to 2034

Figure 47: North Jeolla Industry Analysis and Outlook Value (US$ Million) by Application, 2024 to 2034

Figure 48: North Jeolla Industry Analysis and Outlook Value (US$ Million) by Vertical, 2024 to 2034

Figure 49: North Jeolla Industry Analysis and Outlook Value (US$ Million) by Service Provider, 2024 to 2034

Figure 50: North Jeolla Industry Analysis and Outlook Value (US$ Million) Analysis by Service, 2019 to 2034

Figure 51: North Jeolla Industry Analysis and Outlook Value Share (%) and BPS Analysis by Service, 2024 to 2034

Figure 52: North Jeolla Industry Analysis and Outlook Y-o-Y Growth (%) Projections by Service, 2024 to 2034

Figure 53: North Jeolla Industry Analysis and Outlook Value (US$ Million) Analysis by Application, 2019 to 2034

Figure 54: North Jeolla Industry Analysis and Outlook Value Share (%) and BPS Analysis by Application, 2024 to 2034

Figure 55: North Jeolla Industry Analysis and Outlook Y-o-Y Growth (%) Projections by Application, 2024 to 2034

Figure 56: North Jeolla Industry Analysis and Outlook Value (US$ Million) Analysis by Vertical, 2019 to 2034

Figure 57: North Jeolla Industry Analysis and Outlook Value Share (%) and BPS Analysis by Vertical, 2024 to 2034

Figure 58: North Jeolla Industry Analysis and Outlook Y-o-Y Growth (%) Projections by Vertical, 2024 to 2034

Figure 59: North Jeolla Industry Analysis and Outlook Value (US$ Million) Analysis by Service Provider, 2019 to 2034

Figure 60: North Jeolla Industry Analysis and Outlook Value Share (%) and BPS Analysis by Service Provider, 2024 to 2034

Figure 61: North Jeolla Industry Analysis and Outlook Y-o-Y Growth (%) Projections by Service Provider, 2024 to 2034

Figure 62: North Jeolla Industry Analysis and Outlook Attractiveness by Service, 2024 to 2034

Figure 63: North Jeolla Industry Analysis and Outlook Attractiveness by Application, 2024 to 2034

Figure 64: North Jeolla Industry Analysis and Outlook Attractiveness by Vertical, 2024 to 2034

Figure 65: North Jeolla Industry Analysis and Outlook Attractiveness by Service Provider, 2024 to 2034

Figure 66: South Jeolla Industry Analysis and Outlook Value (US$ Million) by Service, 2024 to 2034

Figure 67: South Jeolla Industry Analysis and Outlook Value (US$ Million) by Application, 2024 to 2034

Figure 68: South Jeolla Industry Analysis and Outlook Value (US$ Million) by Vertical, 2024 to 2034

Figure 69: South Jeolla Industry Analysis and Outlook Value (US$ Million) by Service Provider, 2024 to 2034

Figure 70: South Jeolla Industry Analysis and Outlook Value (US$ Million) Analysis by Service, 2019 to 2034

Figure 71: South Jeolla Industry Analysis and Outlook Value Share (%) and BPS Analysis by Service, 2024 to 2034

Figure 72: South Jeolla Industry Analysis and Outlook Y-o-Y Growth (%) Projections by Service, 2024 to 2034

Figure 73: South Jeolla Industry Analysis and Outlook Value (US$ Million) Analysis by Application, 2019 to 2034

Figure 74: South Jeolla Industry Analysis and Outlook Value Share (%) and BPS Analysis by Application, 2024 to 2034

Figure 75: South Jeolla Industry Analysis and Outlook Y-o-Y Growth (%) Projections by Application, 2024 to 2034

Figure 76: South Jeolla Industry Analysis and Outlook Value (US$ Million) Analysis by Vertical, 2019 to 2034

Figure 77: South Jeolla Industry Analysis and Outlook Value Share (%) and BPS Analysis by Vertical, 2024 to 2034

Figure 78: South Jeolla Industry Analysis and Outlook Y-o-Y Growth (%) Projections by Vertical, 2024 to 2034

Figure 79: South Jeolla Industry Analysis and Outlook Value (US$ Million) Analysis by Service Provider, 2019 to 2034

Figure 80: South Jeolla Industry Analysis and Outlook Value Share (%) and BPS Analysis by Service Provider, 2024 to 2034

Figure 81: South Jeolla Industry Analysis and Outlook Y-o-Y Growth (%) Projections by Service Provider, 2024 to 2034

Figure 82: South Jeolla Industry Analysis and Outlook Attractiveness by Service, 2024 to 2034

Figure 83: South Jeolla Industry Analysis and Outlook Attractiveness by Application, 2024 to 2034

Figure 84: South Jeolla Industry Analysis and Outlook Attractiveness by Vertical, 2024 to 2034

Figure 85: South Jeolla Industry Analysis and Outlook Attractiveness by Service Provider, 2024 to 2034

Figure 86: Jeju Industry Analysis and Outlook Value (US$ Million) by Service, 2024 to 2034

Figure 87: Jeju Industry Analysis and Outlook Value (US$ Million) by Application, 2024 to 2034

Figure 88: Jeju Industry Analysis and Outlook Value (US$ Million) by Vertical, 2024 to 2034

Figure 89: Jeju Industry Analysis and Outlook Value (US$ Million) by Service Provider, 2024 to 2034

Figure 90: Jeju Industry Analysis and Outlook Value (US$ Million) Analysis by Service, 2019 to 2034

Figure 91: Jeju Industry Analysis and Outlook Value Share (%) and BPS Analysis by Service, 2024 to 2034

Figure 92: Jeju Industry Analysis and Outlook Y-o-Y Growth (%) Projections by Service, 2024 to 2034

Figure 93: Jeju Industry Analysis and Outlook Value (US$ Million) Analysis by Application, 2019 to 2034

Figure 94: Jeju Industry Analysis and Outlook Value Share (%) and BPS Analysis by Application, 2024 to 2034

Figure 95: Jeju Industry Analysis and Outlook Y-o-Y Growth (%) Projections by Application, 2024 to 2034

Figure 96: Jeju Industry Analysis and Outlook Value (US$ Million) Analysis by Vertical, 2019 to 2034

Figure 97: Jeju Industry Analysis and Outlook Value Share (%) and BPS Analysis by Vertical, 2024 to 2034

Figure 98: Jeju Industry Analysis and Outlook Y-o-Y Growth (%) Projections by Vertical, 2024 to 2034

Figure 99: Jeju Industry Analysis and Outlook Value (US$ Million) Analysis by Service Provider, 2019 to 2034

Figure 100: Jeju Industry Analysis and Outlook Value Share (%) and BPS Analysis by Service Provider, 2024 to 2034

Figure 101: Jeju Industry Analysis and Outlook Y-o-Y Growth (%) Projections by Service Provider, 2024 to 2034

Figure 102: Jeju Industry Analysis and Outlook Attractiveness by Service, 2024 to 2034

Figure 103: Jeju Industry Analysis and Outlook Attractiveness by Application, 2024 to 2034

Figure 104: Jeju Industry Analysis and Outlook Attractiveness by Vertical, 2024 to 2034

Figure 105: Jeju Industry Analysis and Outlook Attractiveness by Service Provider, 2024 to 2034

Figure 106: Rest of Industry Analysis and Outlook Value (US$ Million) by Service, 2024 to 2034

Figure 107: Rest of Industry Analysis and Outlook Value (US$ Million) by Application, 2024 to 2034

Figure 108: Rest of Industry Analysis and Outlook Value (US$ Million) by Vertical, 2024 to 2034

Figure 109: Rest of Industry Analysis and Outlook Value (US$ Million) by Service Provider, 2024 to 2034

Figure 110: Rest of Industry Analysis and Outlook Value (US$ Million) Analysis by Service, 2019 to 2034

Figure 111: Rest of Industry Analysis and Outlook Value Share (%) and BPS Analysis by Service, 2024 to 2034

Figure 112: Rest of Industry Analysis and Outlook Y-o-Y Growth (%) Projections by Service, 2024 to 2034

Figure 113: Rest of Industry Analysis and Outlook Value (US$ Million) Analysis by Application, 2019 to 2034

Figure 114: Rest of Industry Analysis and Outlook Value Share (%) and BPS Analysis by Application, 2024 to 2034

Figure 115: Rest of Industry Analysis and Outlook Y-o-Y Growth (%) Projections by Application, 2024 to 2034

Figure 116: Rest of Industry Analysis and Outlook Value (US$ Million) Analysis by Vertical, 2019 to 2034

Figure 117: Rest of Industry Analysis and Outlook Value Share (%) and BPS Analysis by Vertical, 2024 to 2034

Figure 118: Rest of Industry Analysis and Outlook Y-o-Y Growth (%) Projections by Vertical, 2024 to 2034

Figure 119: Rest of Industry Analysis and Outlook Value (US$ Million) Analysis by Service Provider, 2019 to 2034

Figure 120: Rest of Industry Analysis and Outlook Value Share (%) and BPS Analysis by Service Provider, 2024 to 2034

Figure 121: Rest of Industry Analysis and Outlook Y-o-Y Growth (%) Projections by Service Provider, 2024 to 2034

Figure 122: Rest of Industry Analysis and Outlook Attractiveness by Service, 2024 to 2034

Figure 123: Rest of Industry Analysis and Outlook Attractiveness by Application, 2024 to 2034

Figure 124: Rest of Industry Analysis and Outlook Attractiveness by Vertical, 2024 to 2034

Figure 125: Rest of Industry Analysis and Outlook Attractiveness by Service Provider, 2024 to 2034

Recommendations

Technology

Content Delivery Network (CDN) Market

Published : January 2024

Technology

Component Content Management Systems Market

Published : June 2022

Explore Technology Insights

View Reports

Content Delivery Network Industry Analysis in Korea