Reports

- Global Locations -

Headquarters

Future Market Insights, Inc.

Christiana Corporate, 200
Continental Drive, Suite 401,
Newark, Delaware - 19713,
United States

T: +1-845-579-5705

Americas

Future Market Insights, Inc.

616 Corporate Way, Suite 2-9018,
Valley Cottage, NY 10989, United States

T: +1-347-918-3531

MEA

Future Market Insights

1602-6 Jumeirah Bay X2 Tower, Plot No: JLT-PH2-X2A,
Jumeirah Lakes Towers, Dubai,
United Arab Emirates

Europe

Future Market Insights

3rd Floor, 207 Regent Street,
W1B 3HH London
United Kingdom

T: + 44 (0) 20 8123 9659
D: +44 (0) 20 3287 4268

Asia Pacific

Future Market Insights

IndiaLand Global Tech Park, Unit UG-1, Behind Grand HighStreet, Phase 1, Hinjawadi, MH, Pune – 411057, India

Content Creation Software Market Snapshot (2023 to 2033)

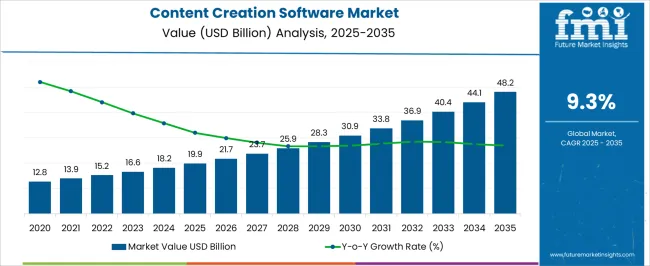
The global content creation software market is valued at US$ 16,507.7 million in 2023. With 10.2%, the projected market growth from 2023 to 2033 is expected to be significantly higher than the historical growth. Content creation platforms are expected to be the highest revenue-generating segment, projected to grow at a CAGR of over 10.2% during 2023 to 2033.

Attributes Details
Global Content Creation Software Material Market Size (2023) US$ 16,507.7 million
Global Content Creation Software Material Market Size (2033) US$ 43733 million
Global Content Creation Software Material Market CAGR (2023 to 2033) 10.2%
United States Content Creation Software Material Market Size (2033) US$ 13.9 billion
United States Content Creation Software Material Market CAGR (2023 to 2033) 9.7%
Key Companies Covered
  • Uberflip
  • CoSchedule
  • Outgrow
  • Joomag
  • Ion Interactive
  • Skyword
  • Ceros
  • Opinion Stage
  • Curata
  • NewsCred
  • RebelMouse
  • TechValidate
  • Scoop. it
  • Advisor Stream

Don't pay for what you don't need

Customize your report by selecting specific countries or regions and save 30%!

Revenue of Content Creation Software Market from 2018 to 2022 Compared to Demand Outlook for 2023 to 2033

As per the content creation software market research by Future Market Insights - a market research and competitive intelligence provider, historically, from 2018 to 2022, the market value of the content creation software market increased at around 10.7% CAGR. With an absolute growth opportunity of US$ 9.7%, the market is projected to reach a valuation of US$ 38.7 billion by 2033.

Factors Propelling Content Creation Software Demand

Marketing and sales strategies are now deeply ingrained in digital content creation software tools and service platforms. And digital marketing is now an important, if not critical, component of almost every marketing department in almost every industry.

Digital content creation tools and services are critical to developing and identifying relevant content to meet the needs of enterprises. The creation of suitable content, such as white papers, articles, posts, testimonials, and so on, aids in the targeting of the intended audience.

A key factor propelling the global content creation software market is the increasing adoption of digital content creation software applications, particularly by the marketing sector worldwide, due to multiple benefits offered by content creation software, such as visual representation, consistent image processing, and others.

Furthermore, growing social media tools are augmenting the potential of digital content creation tools due to the importance of individual connections and better relations. Discovering suitable research associates and copyright infringements, on the other hand, may pose significant barriers to market growth.

Moreover, people spend significant time on social networking sites and constantly share digital content through memes, GIFs, images, and videos. This content has now become a way for people to communicate. Aside from that, the growing demand for brand marketing and promotions is driving the growth of the content creation software market.

Sudip Saha
Sudip Saha

Principal Consultant

Talk to Analyst

Find your sweet spots for generating winning opportunities in this market.

OTT Platforms Leading the Staggering Demand for Content Creation Software

The rise in popularity of OTT platforms has transformed the online content industry. Companies like Netflix and Amazon Prime are developing new content creating and viewing services to cater to a large audience.

On the other hand, YouTube is spreading its video-sharing platform and providing TV services to grab the attention of its primary audience. Watching videos, listening to music, and playing games have become simple with quick access. As a result, the digital content market is expected to grow in the near future.

Another financially rewarding segment for performers in the digital content creation market is the hospitality industry. Players have increasingly gravitated toward using email marketing to acquire new customers or to strengthen relationships with current ones.

Numerous businesses are concentrating on substantial growth tactics such as product releases, product approvals, and other things like patents and events. Acquisitions, partnerships, and collaborations were among the inorganic growth strategies observed in the market.

These activities have set the stage for market participants to expand their business and customer base. With the growing demand for filter products in the international market, players in the digital content creation market are expected to benefit from booming growth opportunities.

Region-Wise Analysis

North America to Offer the Largest Opportunity for Content Creation Software Market

In 2022, North America held the largest content creation software market share. Due to the rapid advancement of digital ecosystems and the greater augmentation of social media networks in this region, North America is anticipated to witness significant growth in the digital content creation market.

For instance, the United States content and services environment has been authorized by entities that have shifted their focus to digital platforms for efficiency gains, preceded by equity holders financing development and improving service growth.

However, owing to massive marketing investments by several regional companies, Asia Pacific is anticipated to fuel the growth of content marketing software and services providers. The growing number of small and medium-sized industries in key APAC countries and the rising adoption of digital marketing strategies are expected to push the boundaries of the Asia Pacific content creation software market.

Furthermore, Asia Pacific is expected to witness profitable growth due to the burgeoning usage of smart content toolkits in countries like China, India, and Japan, which are committed to developing good network connectivity and technological advances, offering exhilarating opportunities for market vendors.
Get the data you need at a Fraction of the cost

Personalize your report by choosing insights you need
and save 40%!

Country-Wise Analysis

United States Lies at the CenterStage for Content Creation Software Market

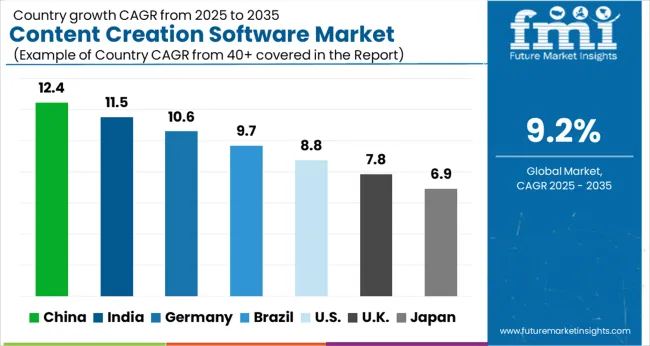
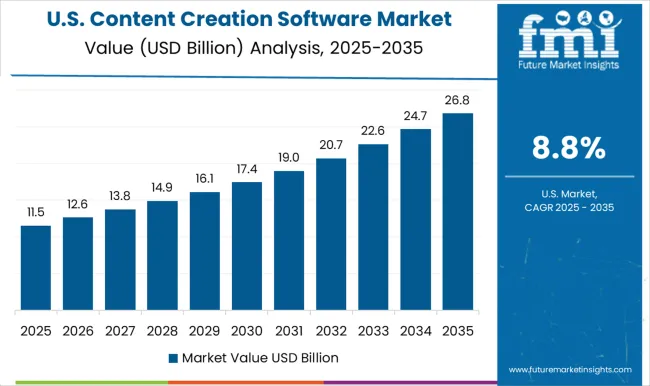
By the end of 2033, the United States is expected to account for the largest market share of US$ 13.9 billion. It previously grew at a significant CAGR of 10.4% from 2018 to 2022 and is now anticipated to grow at a CAGR of 9.7% over the forecast period. Geographically, it is expected to account for the lion's share of the digital content creation market.

The high deployment and intrusion of online content designing options and features and the widespread implementation of digital content creation tools in various terminal sections can be credited to the region's growth.

Category-Wise Insights

Content Creation Platforms Solution Type to Propel Maximum Growth for Content Creation Software Providers

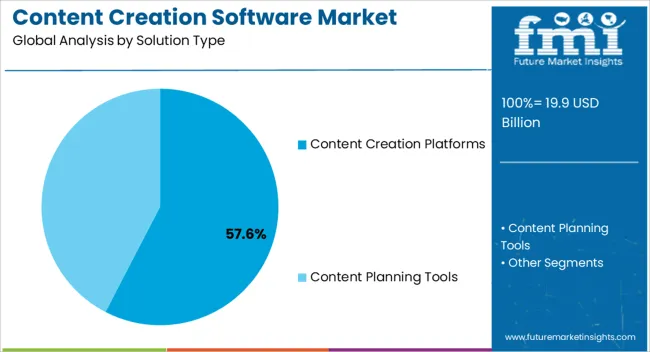
Content creation platforms commanded the largest revenue in this regard. They grew at a CAGR of nearly 10.5% from 2018 to 2022 and are now forecasted to grow at 9.6% throughout the forecast period. TV shows, movies, music videos, and television commercials are examples of digital video content that can be streamed online on numerous platforms.

It is one of the most expedient forms of entertainment and is available on cell phones, tablet devices, laptops, and smart TVs. Content creation platforms such as Amazon Prime, Hulu, Netflix, along with YouTube are producing maximum content and keeping audiences engaged, propelling the market.

There is an increase in the popularity of digital video content, particularly among youth, due to rising smartphone sales and an increasing number of devices that can support digital media. Apart from this, the popularity of digital video content allows brands to launch new products on digital platforms, reaching a larger consumer base.

Large Enterprises Application Segment to Propel the Growth of the Content Creation Software Market

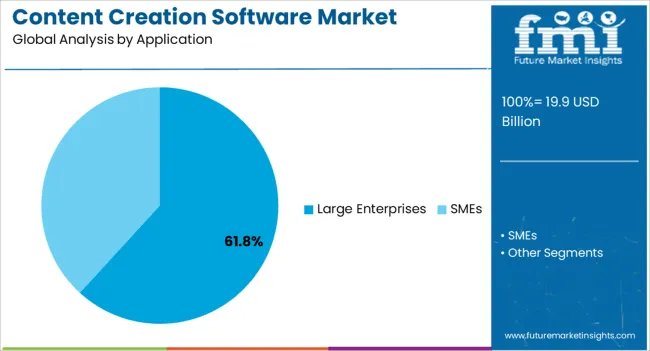
Market revenue through large enterprises has been the highest, which grew at a CAGR of over 10% during 2018 to 2022. The retail industry is another field that is expected to provide significant revenue to the content creation software market.
Competitive Analysis

Players in the content creation software market constantly develop improved solutions and extend their product offerings. Continuous expenditures on digital marketing by businesses of all sizes are projected to spur the global development of the digital content creation market. Companies are investing heavily in advertising to create relevant and customer-friendly content.

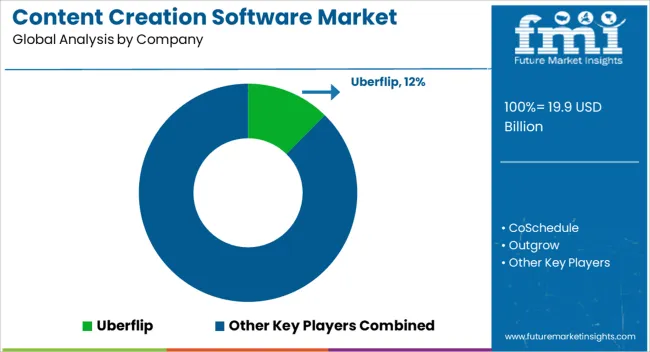
Some of the key players operating in the content creation software market include Uberflip, CoSchedule, Outgrow, Joomag, Ion Interactive, Skyword, Ceros, Opinion Stage, Curata, NewsCred, RebelMouse, TechValidate, Scoop. It, and Advisor Stream.

  • In May 2022, UberFlip announced that it had increased its actionable data, which will help Go-To-Market Teams strengthen content experiences.
  • In January 2022, UberFlip announced some new features and capabilities that are designed to elevate user experience. The company announced that it has significantly improved its Sales Assist product. Alongside, it also launched a new app known as Bulk Task Smasher.
  • Adobe has released a new edition of its Creative Cloud suite, which includes several new content production tools.
  • Canva has introduced a new tool called Canva for Enterprise, which is intended for enterprises requiring large-scale content creation.
  • Similarly, recent developments related to companies in Content Creation Software services have been tracked by the team at Future Market Insights, which are available in the full report.

Market Segments Covered in Content Creation Software Market Analysis

By Solution Type:

  • Content Creation Platforms
  • Content Planning Tools

By Application:

  • Large Enterprises
  • SMEs

By Region:

  • North America
  • Latin America
  • Europe
  • Asia Pacific
  • Middle East and Africa

Frequently Asked Questions

How Big is the Content Creation Software Market?

The market is valued at US$ 16,507.7 million in 2023.

Who are the Key Players in the Content Creation Software Market?

UberFlip and Adobe are key market players.

Which is the Key Segment by Application Type?

Large enterprises segment is likely to remain preferred through 2033.

Which is the Go-to-Market Strategy?

Players opt for mergers, collaborations, new launches and acquisitions.

Which are the Key Countries in the Content Creation Software Market?

The United States, the United Kingdom, and China dominate the global market.

Table of Content

1. Executive Summary

    1.1. Global Market Outlook

    1.2. Demand-side Trends

    1.3. Supply-side Trends

    1.4. Technology Roadmap Analysis

    1.5. Analysis and Recommendations

2. Market Overview

    2.1. Market Coverage / Taxonomy

    2.2. Market Definition / Scope / Limitations

3. Market Background

    3.1. Market Dynamics

        3.1.1. Drivers

        3.1.2. Restraints

        3.1.3. Opportunity

        3.1.4. Trends

    3.2. Scenario Forecast

        3.2.1. Demand in Optimistic Scenario

        3.2.2. Demand in Likely Scenario

        3.2.3. Demand in Conservative Scenario

    3.3. Opportunity Map Analysis

    3.4. Investment Feasibility Matrix

    3.5. PESTLE and Porter’s Analysis

    3.6. Regulatory Landscape

        3.6.1. By Key Regions

        3.6.2. By Key Countries

    3.7. Regional Parent Market Outlook

4. Global Market Analysis 2018 to 2022 and Forecast, 2023 to 2033

    4.1. Historical Market Size Value (US$ Million) Analysis, 2018 to 2022

    4.2. Current and Future Market Size Value (US$ Million) Projections, 2023 to 2033

        4.2.1. Y-o-Y Growth Trend Analysis

        4.2.2. Absolute $ Opportunity Analysis

5. Global Market Analysis 2018 to 2022 and Forecast 2023 to 2033, By Solution Type

    5.1. Introduction / Key Findings

    5.2. Historical Market Size Value (US$ Million) Analysis By Solution Type, 2018 to 2022

    5.3. Current and Future Market Size Value (US$ Million) Analysis and Forecast By Solution Type, 2023 to 2033

        5.3.1. Content Creation Platforms

        5.3.2. Content Planning Tools

    5.4. Y-o-Y Growth Trend Analysis By Solution Type, 2018 to 2022

    5.5. Absolute $ Opportunity Analysis By Solution Type, 2023 to 2033

6. Global Market Analysis 2018 to 2022 and Forecast 2023 to 2033, By Application

    6.1. Introduction / Key Findings

    6.2. Historical Market Size Value (US$ Million) Analysis By Application, 2018 to 2022

    6.3. Current and Future Market Size Value (US$ Million) Analysis and Forecast By Application, 2023 to 2033

        6.3.1. Large Enterprises

        6.3.2. SMEs

    6.4. Y-o-Y Growth Trend Analysis By Application, 2018 to 2022

    6.5. Absolute $ Opportunity Analysis By Application, 2023 to 2033

7. Global Market Analysis 2018 to 2022 and Forecast 2023 to 2033, By Region

    7.1. Introduction

    7.2. Historical Market Size Value (US$ Million) Analysis By Region, 2018 to 2022

    7.3. Current Market Size Value (US$ Million) Analysis and Forecast By Region, 2023 to 2033

        7.3.1. North America

        7.3.2. Latin America

        7.3.3. Western Europe

        7.3.4. Eastern Europe

        7.3.5. South Asia and Pacific

        7.3.6. East Asia

        7.3.7. Middle East and Africa

    7.4. Market Attractiveness Analysis By Region

8. North America Market Analysis 2018 to 2022 and Forecast 2023 to 2033, By Country

    8.1. Historical Market Size Value (US$ Million) Trend Analysis By Market Taxonomy, 2018 to 2022

    8.2. Market Size Value (US$ Million) Forecast By Market Taxonomy, 2023 to 2033

        8.2.1. By Country

            8.2.1.1. USA

            8.2.1.2. Canada

        8.2.2. By Solution Type

        8.2.3. By Application

    8.3. Market Attractiveness Analysis

        8.3.1. By Country

        8.3.2. By Solution Type

        8.3.3. By Application

    8.4. Key Takeaways

9. Latin America Market Analysis 2018 to 2022 and Forecast 2023 to 2033, By Country

    9.1. Historical Market Size Value (US$ Million) Trend Analysis By Market Taxonomy, 2018 to 2022

    9.2. Market Size Value (US$ Million) Forecast By Market Taxonomy, 2023 to 2033

        9.2.1. By Country

            9.2.1.1. Brazil

            9.2.1.2. Mexico

            9.2.1.3. Rest of Latin America

        9.2.2. By Solution Type

        9.2.3. By Application

    9.3. Market Attractiveness Analysis

        9.3.1. By Country

        9.3.2. By Solution Type

        9.3.3. By Application

    9.4. Key Takeaways

10. Western Europe Market Analysis 2018 to 2022 and Forecast 2023 to 2033, By Country

    10.1. Historical Market Size Value (US$ Million) Trend Analysis By Market Taxonomy, 2018 to 2022

    10.2. Market Size Value (US$ Million) Forecast By Market Taxonomy, 2023 to 2033

        10.2.1. By Country

            10.2.1.1. Germany

            10.2.1.2. UK

            10.2.1.3. France

            10.2.1.4. Spain

            10.2.1.5. Italy

            10.2.1.6. Rest of Western Europe

        10.2.2. By Solution Type

        10.2.3. By Application

    10.3. Market Attractiveness Analysis

        10.3.1. By Country

        10.3.2. By Solution Type

        10.3.3. By Application

    10.4. Key Takeaways

11. Eastern Europe Market Analysis 2018 to 2022 and Forecast 2023 to 2033, By Country

    11.1. Historical Market Size Value (US$ Million) Trend Analysis By Market Taxonomy, 2018 to 2022

    11.2. Market Size Value (US$ Million) Forecast By Market Taxonomy, 2023 to 2033

        11.2.1. By Country

            11.2.1.1. Poland

            11.2.1.2. Russia

            11.2.1.3. Czech Republic

            11.2.1.4. Romania

            11.2.1.5. Rest of Eastern Europe

        11.2.2. By Solution Type

        11.2.3. By Application

    11.3. Market Attractiveness Analysis

        11.3.1. By Country

        11.3.2. By Solution Type

        11.3.3. By Application

    11.4. Key Takeaways

12. South Asia and Pacific Market Analysis 2018 to 2022 and Forecast 2023 to 2033, By Country

    12.1. Historical Market Size Value (US$ Million) Trend Analysis By Market Taxonomy, 2018 to 2022

    12.2. Market Size Value (US$ Million) Forecast By Market Taxonomy, 2023 to 2033

        12.2.1. By Country

            12.2.1.1. India

            12.2.1.2. Bangladesh

            12.2.1.3. Australia

            12.2.1.4. New Zealand

            12.2.1.5. Rest of South Asia and Pacific

        12.2.2. By Solution Type

        12.2.3. By Application

    12.3. Market Attractiveness Analysis

        12.3.1. By Country

        12.3.2. By Solution Type

        12.3.3. By Application

    12.4. Key Takeaways

13. East Asia Market Analysis 2018 to 2022 and Forecast 2023 to 2033, By Country

    13.1. Historical Market Size Value (US$ Million) Trend Analysis By Market Taxonomy, 2018 to 2022

    13.2. Market Size Value (US$ Million) Forecast By Market Taxonomy, 2023 to 2033

        13.2.1. By Country

            13.2.1.1. China

            13.2.1.2. Japan

            13.2.1.3. South Korea

        13.2.2. By Solution Type

        13.2.3. By Application

    13.3. Market Attractiveness Analysis

        13.3.1. By Country

        13.3.2. By Solution Type

        13.3.3. By Application

    13.4. Key Takeaways

14. Middle East and Africa Market Analysis 2018 to 2022 and Forecast 2023 to 2033, By Country

    14.1. Historical Market Size Value (US$ Million) Trend Analysis By Market Taxonomy, 2018 to 2022

    14.2. Market Size Value (US$ Million) Forecast By Market Taxonomy, 2023 to 2033

        14.2.1. By Country

            14.2.1.1. GCC Countries

            14.2.1.2. South Africa

            14.2.1.3. Israel

            14.2.1.4. Rest of MEA

        14.2.2. By Solution Type

        14.2.3. By Application

    14.3. Market Attractiveness Analysis

        14.3.1. By Country

        14.3.2. By Solution Type

        14.3.3. By Application

    14.4. Key Takeaways

15. Key Countries Market Analysis

    15.1. USA

        15.1.1. Pricing Analysis

        15.1.2. Market Share Analysis, 2022

            15.1.2.1. By Solution Type

            15.1.2.2. By Application

    15.2. Canada

        15.2.1. Pricing Analysis

        15.2.2. Market Share Analysis, 2022

            15.2.2.1. By Solution Type

            15.2.2.2. By Application

    15.3. Brazil

        15.3.1. Pricing Analysis

        15.3.2. Market Share Analysis, 2022

            15.3.2.1. By Solution Type

            15.3.2.2. By Application

    15.4. Mexico

        15.4.1. Pricing Analysis

        15.4.2. Market Share Analysis, 2022

            15.4.2.1. By Solution Type

            15.4.2.2. By Application

    15.5. Germany

        15.5.1. Pricing Analysis

        15.5.2. Market Share Analysis, 2022

            15.5.2.1. By Solution Type

            15.5.2.2. By Application

    15.6. UK

        15.6.1. Pricing Analysis

        15.6.2. Market Share Analysis, 2022

            15.6.2.1. By Solution Type

            15.6.2.2. By Application

    15.7. France

        15.7.1. Pricing Analysis

        15.7.2. Market Share Analysis, 2022

            15.7.2.1. By Solution Type

            15.7.2.2. By Application

    15.8. Spain

        15.8.1. Pricing Analysis

        15.8.2. Market Share Analysis, 2022

            15.8.2.1. By Solution Type

            15.8.2.2. By Application

    15.9. Italy

        15.9.1. Pricing Analysis

        15.9.2. Market Share Analysis, 2022

            15.9.2.1. By Solution Type

            15.9.2.2. By Application

    15.10. Poland

        15.10.1. Pricing Analysis

        15.10.2. Market Share Analysis, 2022

            15.10.2.1. By Solution Type

            15.10.2.2. By Application

    15.11. Russia

        15.11.1. Pricing Analysis

        15.11.2. Market Share Analysis, 2022

            15.11.2.1. By Solution Type

            15.11.2.2. By Application

    15.12. Czech Republic

        15.12.1. Pricing Analysis

        15.12.2. Market Share Analysis, 2022

            15.12.2.1. By Solution Type

            15.12.2.2. By Application

    15.13. Romania

        15.13.1. Pricing Analysis

        15.13.2. Market Share Analysis, 2022

            15.13.2.1. By Solution Type

            15.13.2.2. By Application

    15.14. India

        15.14.1. Pricing Analysis

        15.14.2. Market Share Analysis, 2022

            15.14.2.1. By Solution Type

            15.14.2.2. By Application

    15.15. Bangladesh

        15.15.1. Pricing Analysis

        15.15.2. Market Share Analysis, 2022

            15.15.2.1. By Solution Type

            15.15.2.2. By Application

    15.16. Australia

        15.16.1. Pricing Analysis

        15.16.2. Market Share Analysis, 2022

            15.16.2.1. By Solution Type

            15.16.2.2. By Application

    15.17. New Zealand

        15.17.1. Pricing Analysis

        15.17.2. Market Share Analysis, 2022

            15.17.2.1. By Solution Type

            15.17.2.2. By Application

    15.18. China

        15.18.1. Pricing Analysis

        15.18.2. Market Share Analysis, 2022

            15.18.2.1. By Solution Type

            15.18.2.2. By Application

    15.19. Japan

        15.19.1. Pricing Analysis

        15.19.2. Market Share Analysis, 2022

            15.19.2.1. By Solution Type

            15.19.2.2. By Application

    15.20. South Korea

        15.20.1. Pricing Analysis

        15.20.2. Market Share Analysis, 2022

            15.20.2.1. By Solution Type

            15.20.2.2. By Application

    15.21. GCC Countries

        15.21.1. Pricing Analysis

        15.21.2. Market Share Analysis, 2022

            15.21.2.1. By Solution Type

            15.21.2.2. By Application

    15.22. South Africa

        15.22.1. Pricing Analysis

        15.22.2. Market Share Analysis, 2022

            15.22.2.1. By Solution Type

            15.22.2.2. By Application

    15.23. Israel

        15.23.1. Pricing Analysis

        15.23.2. Market Share Analysis, 2022

            15.23.2.1. By Solution Type

            15.23.2.2. By Application

16. Market Structure Analysis

    16.1. Competition Dashboard

    16.2. Competition Benchmarking

    16.3. Market Share Analysis of Top Players

        16.3.1. By Regional

        16.3.2. By Solution Type

        16.3.3. By Application

17. Competition Analysis

    17.1. Competition Deep Dive

        17.1.1. Uberflip

            17.1.1.1. Overview

            17.1.1.2. Product Portfolio

            17.1.1.3. Profitability by Market Segments

            17.1.1.4. Sales Footprint

            17.1.1.5. Strategy Overview

                17.1.1.5.1. Marketing Strategy

        17.1.2. CoSchedule

            17.1.2.1. Overview

            17.1.2.2. Product Portfolio

            17.1.2.3. Profitability by Market Segments

            17.1.2.4. Sales Footprint

            17.1.2.5. Strategy Overview

                17.1.2.5.1. Marketing Strategy

        17.1.3. Outgrow

            17.1.3.1. Overview

            17.1.3.2. Product Portfolio

            17.1.3.3. Profitability by Market Segments

            17.1.3.4. Sales Footprint

            17.1.3.5. Strategy Overview

                17.1.3.5.1. Marketing Strategy

        17.1.4. Joomag

            17.1.4.1. Overview

            17.1.4.2. Product Portfolio

            17.1.4.3. Profitability by Market Segments

            17.1.4.4. Sales Footprint

            17.1.4.5. Strategy Overview

                17.1.4.5.1. Marketing Strategy

        17.1.5. Ion Interactive

            17.1.5.1. Overview

            17.1.5.2. Product Portfolio

            17.1.5.3. Profitability by Market Segments

            17.1.5.4. Sales Footprint

            17.1.5.5. Strategy Overview

                17.1.5.5.1. Marketing Strategy

        17.1.6. Skyword

            17.1.6.1. Overview

            17.1.6.2. Product Portfolio

            17.1.6.3. Profitability by Market Segments

            17.1.6.4. Sales Footprint

            17.1.6.5. Strategy Overview

                17.1.6.5.1. Marketing Strategy

        17.1.7. Ceros

            17.1.7.1. Overview

            17.1.7.2. Product Portfolio

            17.1.7.3. Profitability by Market Segments

            17.1.7.4. Sales Footprint

            17.1.7.5. Strategy Overview

                17.1.7.5.1. Marketing Strategy

        17.1.8. Opinion Stage

            17.1.8.1. Overview

            17.1.8.2. Product Portfolio

            17.1.8.3. Profitability by Market Segments

            17.1.8.4. Sales Footprint

            17.1.8.5. Strategy Overview

                17.1.8.5.1. Marketing Strategy

        17.1.9. Curata

            17.1.9.1. Overview

            17.1.9.2. Product Portfolio

            17.1.9.3. Profitability by Market Segments

            17.1.9.4. Sales Footprint

            17.1.9.5. Strategy Overview

                17.1.9.5.1. Marketing Strategy

        17.1.10. NewsCred

            17.1.10.1. Overview

            17.1.10.2. Product Portfolio

            17.1.10.3. Profitability by Market Segments

            17.1.10.4. Sales Footprint

            17.1.10.5. Strategy Overview

                17.1.10.5.1. Marketing Strategy

        17.1.11. RebelMouse

            17.1.11.1. Overview

            17.1.11.2. Product Portfolio

            17.1.11.3. Profitability by Market Segments

            17.1.11.4. Sales Footprint

            17.1.11.5. Strategy Overview

                17.1.11.5.1. Marketing Strategy

        17.1.12. TechValidate

            17.1.12.1. Overview

            17.1.12.2. Product Portfolio

            17.1.12.3. Profitability by Market Segments

            17.1.12.4. Sales Footprint

            17.1.12.5. Strategy Overview

                17.1.12.5.1. Marketing Strategy

        17.1.13. Scoop.it

            17.1.13.1. Overview

            17.1.13.2. Product Portfolio

            17.1.13.3. Profitability by Market Segments

            17.1.13.4. Sales Footprint

            17.1.13.5. Strategy Overview

                17.1.13.5.1. Marketing Strategy

        17.1.14. Advisor Stream

            17.1.14.1. Overview

            17.1.14.2. Product Portfolio

            17.1.14.3. Profitability by Market Segments

            17.1.14.4. Sales Footprint

            17.1.14.5. Strategy Overview

                17.1.14.5.1. Marketing Strategy

18. Assumptions & Acronyms Used

19. Research Methodology

List of Tables

Table 1: Global Market Value (US$ Million) Forecast by Region, 2018 to 2033

Table 2: Global Market Value (US$ Million) Forecast by Solution Type, 2018 to 2033

Table 3: Global Market Value (US$ Million) Forecast by Application, 2018 to 2033

Table 4: North America Market Value (US$ Million) Forecast by Country, 2018 to 2033

Table 5: North America Market Value (US$ Million) Forecast by Solution Type, 2018 to 2033

Table 6: North America Market Value (US$ Million) Forecast by Application, 2018 to 2033

Table 7: Latin America Market Value (US$ Million) Forecast by Country, 2018 to 2033

Table 8: Latin America Market Value (US$ Million) Forecast by Solution Type, 2018 to 2033

Table 9: Latin America Market Value (US$ Million) Forecast by Application, 2018 to 2033

Table 10: Western Europe Market Value (US$ Million) Forecast by Country, 2018 to 2033

Table 11: Western Europe Market Value (US$ Million) Forecast by Solution Type, 2018 to 2033

Table 12: Western Europe Market Value (US$ Million) Forecast by Application, 2018 to 2033

Table 13: Eastern Europe Market Value (US$ Million) Forecast by Country, 2018 to 2033

Table 14: Eastern Europe Market Value (US$ Million) Forecast by Solution Type, 2018 to 2033

Table 15: Eastern Europe Market Value (US$ Million) Forecast by Application, 2018 to 2033

Table 16: South Asia and Pacific Market Value (US$ Million) Forecast by Country, 2018 to 2033

Table 17: South Asia and Pacific Market Value (US$ Million) Forecast by Solution Type, 2018 to 2033

Table 18: South Asia and Pacific Market Value (US$ Million) Forecast by Application, 2018 to 2033

Table 19: East Asia Market Value (US$ Million) Forecast by Country, 2018 to 2033

Table 20: East Asia Market Value (US$ Million) Forecast by Solution Type, 2018 to 2033

Table 21: East Asia Market Value (US$ Million) Forecast by Application, 2018 to 2033

Table 22: Middle East and Africa Market Value (US$ Million) Forecast by Country, 2018 to 2033

Table 23: Middle East and Africa Market Value (US$ Million) Forecast by Solution Type, 2018 to 2033

Table 24: Middle East and Africa Market Value (US$ Million) Forecast by Application, 2018 to 2033

List of Charts

Figure 1: Global Market Value (US$ Million) by Solution Type, 2023 to 2033

Figure 2: Global Market Value (US$ Million) by Application, 2023 to 2033

Figure 3: Global Market Value (US$ Million) by Region, 2023 to 2033

Figure 4: Global Market Value (US$ Million) Analysis by Region, 2018 to 2033

Figure 5: Global Market Value Share (%) and BPS Analysis by Region, 2023 to 2033

Figure 6: Global Market Y-o-Y Growth (%) Projections by Region, 2023 to 2033

Figure 7: Global Market Value (US$ Million) Analysis by Solution Type, 2018 to 2033

Figure 8: Global Market Value Share (%) and BPS Analysis by Solution Type, 2023 to 2033

Figure 9: Global Market Y-o-Y Growth (%) Projections by Solution Type, 2023 to 2033

Figure 10: Global Market Value (US$ Million) Analysis by Application, 2018 to 2033

Figure 11: Global Market Value Share (%) and BPS Analysis by Application, 2023 to 2033

Figure 12: Global Market Y-o-Y Growth (%) Projections by Application, 2023 to 2033

Figure 13: Global Market Attractiveness by Solution Type, 2023 to 2033

Figure 14: Global Market Attractiveness by Application, 2023 to 2033

Figure 15: Global Market Attractiveness by Region, 2023 to 2033

Figure 16: North America Market Value (US$ Million) by Solution Type, 2023 to 2033

Figure 17: North America Market Value (US$ Million) by Application, 2023 to 2033

Figure 18: North America Market Value (US$ Million) by Country, 2023 to 2033

Figure 19: North America Market Value (US$ Million) Analysis by Country, 2018 to 2033

Figure 20: North America Market Value Share (%) and BPS Analysis by Country, 2023 to 2033

Figure 21: North America Market Y-o-Y Growth (%) Projections by Country, 2023 to 2033

Figure 22: North America Market Value (US$ Million) Analysis by Solution Type, 2018 to 2033

Figure 23: North America Market Value Share (%) and BPS Analysis by Solution Type, 2023 to 2033

Figure 24: North America Market Y-o-Y Growth (%) Projections by Solution Type, 2023 to 2033

Figure 25: North America Market Value (US$ Million) Analysis by Application, 2018 to 2033

Figure 26: North America Market Value Share (%) and BPS Analysis by Application, 2023 to 2033

Figure 27: North America Market Y-o-Y Growth (%) Projections by Application, 2023 to 2033

Figure 28: North America Market Attractiveness by Solution Type, 2023 to 2033

Figure 29: North America Market Attractiveness by Application, 2023 to 2033

Figure 30: North America Market Attractiveness by Country, 2023 to 2033

Figure 31: Latin America Market Value (US$ Million) by Solution Type, 2023 to 2033

Figure 32: Latin America Market Value (US$ Million) by Application, 2023 to 2033

Figure 33: Latin America Market Value (US$ Million) by Country, 2023 to 2033

Figure 34: Latin America Market Value (US$ Million) Analysis by Country, 2018 to 2033

Figure 35: Latin America Market Value Share (%) and BPS Analysis by Country, 2023 to 2033

Figure 36: Latin America Market Y-o-Y Growth (%) Projections by Country, 2023 to 2033

Figure 37: Latin America Market Value (US$ Million) Analysis by Solution Type, 2018 to 2033

Figure 38: Latin America Market Value Share (%) and BPS Analysis by Solution Type, 2023 to 2033

Figure 39: Latin America Market Y-o-Y Growth (%) Projections by Solution Type, 2023 to 2033

Figure 40: Latin America Market Value (US$ Million) Analysis by Application, 2018 to 2033

Figure 41: Latin America Market Value Share (%) and BPS Analysis by Application, 2023 to 2033

Figure 42: Latin America Market Y-o-Y Growth (%) Projections by Application, 2023 to 2033

Figure 43: Latin America Market Attractiveness by Solution Type, 2023 to 2033

Figure 44: Latin America Market Attractiveness by Application, 2023 to 2033

Figure 45: Latin America Market Attractiveness by Country, 2023 to 2033

Figure 46: Western Europe Market Value (US$ Million) by Solution Type, 2023 to 2033

Figure 47: Western Europe Market Value (US$ Million) by Application, 2023 to 2033

Figure 48: Western Europe Market Value (US$ Million) by Country, 2023 to 2033

Figure 49: Western Europe Market Value (US$ Million) Analysis by Country, 2018 to 2033

Figure 50: Western Europe Market Value Share (%) and BPS Analysis by Country, 2023 to 2033

Figure 51: Western Europe Market Y-o-Y Growth (%) Projections by Country, 2023 to 2033

Figure 52: Western Europe Market Value (US$ Million) Analysis by Solution Type, 2018 to 2033

Figure 53: Western Europe Market Value Share (%) and BPS Analysis by Solution Type, 2023 to 2033

Figure 54: Western Europe Market Y-o-Y Growth (%) Projections by Solution Type, 2023 to 2033

Figure 55: Western Europe Market Value (US$ Million) Analysis by Application, 2018 to 2033

Figure 56: Western Europe Market Value Share (%) and BPS Analysis by Application, 2023 to 2033

Figure 57: Western Europe Market Y-o-Y Growth (%) Projections by Application, 2023 to 2033

Figure 58: Western Europe Market Attractiveness by Solution Type, 2023 to 2033

Figure 59: Western Europe Market Attractiveness by Application, 2023 to 2033

Figure 60: Western Europe Market Attractiveness by Country, 2023 to 2033

Figure 61: Eastern Europe Market Value (US$ Million) by Solution Type, 2023 to 2033

Figure 62: Eastern Europe Market Value (US$ Million) by Application, 2023 to 2033

Figure 63: Eastern Europe Market Value (US$ Million) by Country, 2023 to 2033

Figure 64: Eastern Europe Market Value (US$ Million) Analysis by Country, 2018 to 2033

Figure 65: Eastern Europe Market Value Share (%) and BPS Analysis by Country, 2023 to 2033

Figure 66: Eastern Europe Market Y-o-Y Growth (%) Projections by Country, 2023 to 2033

Figure 67: Eastern Europe Market Value (US$ Million) Analysis by Solution Type, 2018 to 2033

Figure 68: Eastern Europe Market Value Share (%) and BPS Analysis by Solution Type, 2023 to 2033

Figure 69: Eastern Europe Market Y-o-Y Growth (%) Projections by Solution Type, 2023 to 2033

Figure 70: Eastern Europe Market Value (US$ Million) Analysis by Application, 2018 to 2033

Figure 71: Eastern Europe Market Value Share (%) and BPS Analysis by Application, 2023 to 2033

Figure 72: Eastern Europe Market Y-o-Y Growth (%) Projections by Application, 2023 to 2033

Figure 73: Eastern Europe Market Attractiveness by Solution Type, 2023 to 2033

Figure 74: Eastern Europe Market Attractiveness by Application, 2023 to 2033

Figure 75: Eastern Europe Market Attractiveness by Country, 2023 to 2033

Figure 76: South Asia and Pacific Market Value (US$ Million) by Solution Type, 2023 to 2033

Figure 77: South Asia and Pacific Market Value (US$ Million) by Application, 2023 to 2033

Figure 78: South Asia and Pacific Market Value (US$ Million) by Country, 2023 to 2033

Figure 79: South Asia and Pacific Market Value (US$ Million) Analysis by Country, 2018 to 2033

Figure 80: South Asia and Pacific Market Value Share (%) and BPS Analysis by Country, 2023 to 2033

Figure 81: South Asia and Pacific Market Y-o-Y Growth (%) Projections by Country, 2023 to 2033

Figure 82: South Asia and Pacific Market Value (US$ Million) Analysis by Solution Type, 2018 to 2033

Figure 83: South Asia and Pacific Market Value Share (%) and BPS Analysis by Solution Type, 2023 to 2033

Figure 84: South Asia and Pacific Market Y-o-Y Growth (%) Projections by Solution Type, 2023 to 2033

Figure 85: South Asia and Pacific Market Value (US$ Million) Analysis by Application, 2018 to 2033

Figure 86: South Asia and Pacific Market Value Share (%) and BPS Analysis by Application, 2023 to 2033

Figure 87: South Asia and Pacific Market Y-o-Y Growth (%) Projections by Application, 2023 to 2033

Figure 88: South Asia and Pacific Market Attractiveness by Solution Type, 2023 to 2033

Figure 89: South Asia and Pacific Market Attractiveness by Application, 2023 to 2033

Figure 90: South Asia and Pacific Market Attractiveness by Country, 2023 to 2033

Figure 91: East Asia Market Value (US$ Million) by Solution Type, 2023 to 2033

Figure 92: East Asia Market Value (US$ Million) by Application, 2023 to 2033

Figure 93: East Asia Market Value (US$ Million) by Country, 2023 to 2033

Figure 94: East Asia Market Value (US$ Million) Analysis by Country, 2018 to 2033

Figure 95: East Asia Market Value Share (%) and BPS Analysis by Country, 2023 to 2033

Figure 96: East Asia Market Y-o-Y Growth (%) Projections by Country, 2023 to 2033

Figure 97: East Asia Market Value (US$ Million) Analysis by Solution Type, 2018 to 2033

Figure 98: East Asia Market Value Share (%) and BPS Analysis by Solution Type, 2023 to 2033

Figure 99: East Asia Market Y-o-Y Growth (%) Projections by Solution Type, 2023 to 2033

Figure 100: East Asia Market Value (US$ Million) Analysis by Application, 2018 to 2033

Figure 101: East Asia Market Value Share (%) and BPS Analysis by Application, 2023 to 2033

Figure 102: East Asia Market Y-o-Y Growth (%) Projections by Application, 2023 to 2033

Figure 103: East Asia Market Attractiveness by Solution Type, 2023 to 2033

Figure 104: East Asia Market Attractiveness by Application, 2023 to 2033

Figure 105: East Asia Market Attractiveness by Country, 2023 to 2033

Figure 106: Middle East and Africa Market Value (US$ Million) by Solution Type, 2023 to 2033

Figure 107: Middle East and Africa Market Value (US$ Million) by Application, 2023 to 2033

Figure 108: Middle East and Africa Market Value (US$ Million) by Country, 2023 to 2033

Figure 109: Middle East and Africa Market Value (US$ Million) Analysis by Country, 2018 to 2033

Figure 110: Middle East and Africa Market Value Share (%) and BPS Analysis by Country, 2023 to 2033

Figure 111: Middle East and Africa Market Y-o-Y Growth (%) Projections by Country, 2023 to 2033

Figure 112: Middle East and Africa Market Value (US$ Million) Analysis by Solution Type, 2018 to 2033

Figure 113: Middle East and Africa Market Value Share (%) and BPS Analysis by Solution Type, 2023 to 2033

Figure 114: Middle East and Africa Market Y-o-Y Growth (%) Projections by Solution Type, 2023 to 2033

Figure 115: Middle East and Africa Market Value (US$ Million) Analysis by Application, 2018 to 2033

Figure 116: Middle East and Africa Market Value Share (%) and BPS Analysis by Application, 2023 to 2033

Figure 117: Middle East and Africa Market Y-o-Y Growth (%) Projections by Application, 2023 to 2033

Figure 118: Middle East and Africa Market Attractiveness by Solution Type, 2023 to 2033

Figure 119: Middle East and Africa Market Attractiveness by Application, 2023 to 2033

Figure 120: Middle East and Africa Market Attractiveness by Country, 2023 to 2033

Recommendations

Technology

Content Creation Market

Published : July 2023

Technology

Social Media Content Creation Market

Published : October 2022

Explore Technology Insights

View Reports

Content Creation Software Market