Digital Content Creator Market
Market Insights on Digital Content Creator covering sales outlook, demand forecast & up-to-date key trends
Digital Content Creator Market by Creator Type, Platform Type, End user & Region Forecast 2022 - 2032
Digital Content Creator Market Outlook (2022-2032)
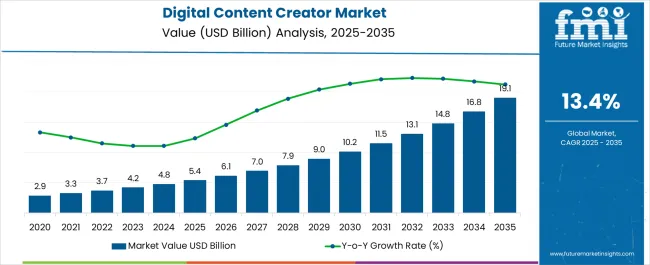
[306 Pages Report] The digital content creator market share is predicted to witness an impressive CAGR of 13.1% over the forecasted period of 2022 to 2032. The market share is estimated to reach a value of nearly US$ 12.9 Billion by 2032, increasing from US$ 3.37 Billion in 2021.
"Digital content can be delivered in a variety of ways, including text, audio, video, graphics, and photographs, making it a high-value addition service for every market, including the global digital content creator market."
Almost half of the planet's population has now become online, and worldwide use of social networking platforms has forged a well-timed gateway for digital content makers around the world.
They acquire information from several sources and develop concepts through various mediums and situations, which is commonly known as digital content creation. The overall consumption of digital content is accentuating each day with a very stiff rise in the digital content creator market statistics that were acquired during the analysis period.
In today's digitally-driven environment, the dissemination of information and entertainment has got revolutionized. Anybody with access to the internet through smart gadgets can be a potential consumer for the market out there.
The main reason for such an emerging trend in digital content creator market or digital content development is its number of advantages, including cheap operating costs, high return on investment (ROI), and ease of measurement and adjustment.
Brand extension, segmentation, goal targeting, and a focus on doing business are some of the specific mileages attracting the market trends towards the goods and product market.
Moreover, working on the content for any business enterprise is critical, which has given rise to a huge demand for digital content creator in the corporate world. Everything an internet user sees has the potential to entice them to visit the company page or website, or possibly become one of their most devoted customers resulting in higher popularity of digital content creators in the marketing team.
It's a well-known fact that for commercial entities, simply their online presence through any of this important social networking must be on point to attract visitors. The ingenuity of any material presented is for the customer's first impression, and the imperative to make that first impression positive and unique is what drives the digital content creator key trends and opportunities in the present times.
Attributes |
Details |
Digital Content Creator Market Size (2021) |
US$ 3.37 Billion |
Digital Content Creator Market Value (2022) |
US$ 3.77 Billion |
Digital Content Creator Market Value (2032) |
US$ 12.9 Billion |
Digital Content Creator Market Growth Rate (2022-2032) |
13.1% |
Let us know your requirement to get
100% FREE customization
What is the Future of Global Digital Content Creator Market?
“Now a days B2B organisations are increasingly depending on online marketing methods to leverage on the stream of internet traffic and acquire better exposure with individuals or potential customers.”
Presently, the digital economy has emerged as a significant contributor to national and international wealth. In line with this development, a lot of educational institutions have come forward to integrate it as a professional course that might encourage the popularity of digital content creators into mainstream academics.
What are the Major Challenges Experienced by the Digital Content Creator Market Players?
In reference to research done by the CEIR, content development strategists still spend millions of dollars on exhibits and business shows, which is about 5X more than is spent on online marketing.
However, as more and more people are becoming aware of the benefits of digital marketing, B2C, as well as B2B organizations, are turning towards it to rethink their marketing message, which might bring in some positive changes in the digital content creator market future trends in the coming decade.
Comparative View of Adjacent Digital Content Creator Market
Digital Content Creator Market:
Attributes |
Digital Content Creator Market |
CAGR (2022 to 2032) |
13.1% |
Market Value (2027) |
US$ 6.8 Billion |
Growth Factor |
Acceptance of online medium as an entertainment and education platform. |
Future Opportunities |
Development of new software for easier creation of audio, or video content. |
Market Trends |
Growing emphasis of business enterprises on marketing their products over digital platforms. |
Social Media Content Creator Market:
Attributes |
Social Media Content Creator Market |
CAGR (2022 to 2032) |
13.1% |
Market Value (2027) |
US$ 4.5 Billion |
Growth Factor |
Higher influx of smartphones among all the sections of society |
Future Opportunities |
Rising youth population with improved financial independence to boost the market. |
Market Trends |
Social media apps promoting short video clips are the most trending platforms out there. |
Digital Marketing Market:
Attributes |
Digital Marketing Market |
CAGR (2022 to 2032) |
12.5% |
Market Value (2027) |
US$ 500 Billion |
Growth Factor |
Growing investment in the online marketing operations is driving the market |
Future Opportunities |
Continuously growing online or internet users to boost the demand for digital marketing. |
Market Trends |
Integration of digital marketing within a broader set of marketing strategies. |
The goal of this market analysis is to determine the future possibilities of all types of digital content creators from a global perspective by collecting data from the worldwide digital content production sector.
Ever since the business revolution following the technological advancements in internet connectivity, there has been a substantial rise in the number of freelance digital content creators providing quality work for several end user verticals. In conformity with this fact, the total contribution of this freelancer segment stands at 19.3% as per the new market research report on digital content creators.
Find your sweet spots for generating winning opportunities in this market.
Talk to AnalystWhat is the Growth Outlook for the Digital Content Creator Market According to Different Segments?
Over the years, the digital content creator market has proliferated on a wide spectrum, with digital content makers manifesting themselves in different types of roles. On that note, bloggers hold the largest share of the market by putting up essentially 47.2%.
Making any marketing blog material lovely and useful at the same time is what assists bloggers in getting maximum leads and over which competent digital content creators cash.
On the other hand, digital writers focus on all types of literature published over online platforms making it the second-largest segment, as evident from the digital content creator market statistics. Currently, this segment claims a share of 28.4% of the total earnings generated by digital content creators in the global market.
According to the Social Media Platform Which Segment is the Top Performer for the Global Digital Content Creator Market?
In proportion to the higher influx of smartphones and breakthroughs in digital literacy, social media or networking sites have emerged as the favorite platform for digital content creators to achieve maximum touch points. This advancement has brought about social media platforms as the dominant segment of the digital content creator industry occupying 30.5% of the total volume of content published.
Blogs hold a share of 21.9%, making it the second most lucrative segment for market opportunities. At the same time, Video platforms are observed to be supplementing 15.2% by the market statistics.
Who are considered as the Major End-use Verticals of the Digital Content CreatorMarket?
Regardless of the fact that digital content being emanating to be useful in almost every sector of the economy, the marketing segment still holds the top position as the end-user of the global digital content creator market share. This segment is figured out to be subscribing for virtually 29.4% of the market size.
Media & entertainment industry is the second-largest contributing end-user segment with an overall 20.5% of the digital content creator market share. With the escalation of video streaming and over-the-top (OTT) platforms in the aftermath of the Covid-19 pandemic, this segment is expected to further boost the demand for digital content creator in the global market.
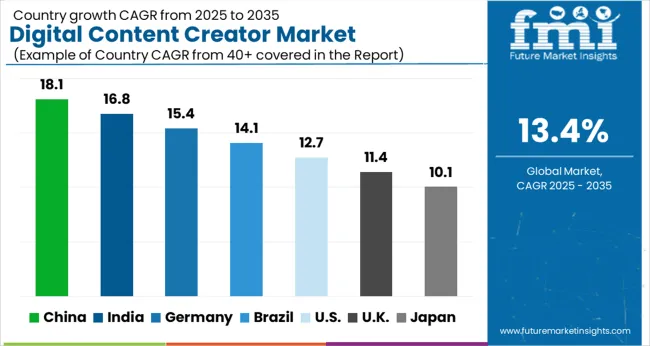
What is the Performance of Digital Content Creator Market in Different Geographical Regions?
Country |
Growth Rate (2022 to 2032) |
United States (US) |
12.5% |
Germany |
9.9% |
China |
15.7% |
Japan |
10.3% |
India |
14.7% |
Every other day, over 2 QB of data are produced, and it's just going to become bigger as estimated by the new market research report on digital content creators. It also mentions that by the year 2025, over 2 MB of digital content data will be produced every second.
According to the FMI, the presence of more than 65 large firms in North America is likely to lead the worldwide market. The USA beheld the top position by contributing almost 85% of the total volume generated in the region, and the US content creator market is predicted to be growing at a rate of 12.5% during the forecast time frame.
Europe is the second-largest digital content creator market in the world, with prospective players from all over the world and more than 15-20 major corporations operating in the region. Germany is recognized to be the top performer coming up with about 32% of the total revenue generated by the European market.
Asia Pacific region, by embodying some of the top-performing companies of the world, is predicted to outperform the others in the context of digital content creator market share in the upcoming years. Due to potential expertise, population, advertising demand, social media use, and data consumption over the projection period China, India, Japan, and South Korea are some of the leading markets for online advertisement creators and digital content creators.
A unified Market Research Subscription Platform, built for today's disparate research needs.
How Strong is the Competitive Landscape for the Digital Content Creator Market?
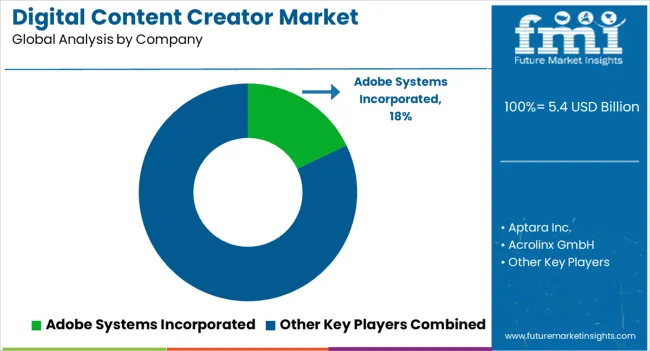
Swelling demand for digital content creator has increased competitiveness, particularly because a digital transformation entails moving to new technical models in which digital content maker is an important determinant of business growth and user strategy. Consequently, digital marketing and content creator have become critical components of campaigns aimed at attracting and retaining internet users.
Digital Content Creator Market Key Players
- Pepper Content Pvt. Ltd.
- GroCurvPvt. Ltd.
- Content-Whale
- BattleROYAL GmbH
- Bravr Ltd
- Oban International
- Seven Atoms Marketing Inc.
- Madison/Miles Media
- Vazoola
- Carney Technologies Services
- CloudMellow
- OuterBox
Key Segments
By Digital Content Creator Type:
- Freelancer
- Blogger
- Digital Writers
- Others
By Social Media Platform Type:
- Social Media
- Blogs
- Podcasts
- Video Platforms
- Case studies
- White Papers
- Infographics
- Others
By End Use:
- Marketing
- Public Relations
- Business
- Journalism
- Literature
- Media & Entertainment
- Others
By Region:
- North America
- Latin America
- Europe
- Asia Pacific
- Middle East and Africa (MEA)
Frequently Asked Questions
What is the Growth Outlook of the Digital Content Creator Market?
The global digital content creator market is estimated to record a CAGR of 13.1% during the forecast period of 2022 to 2032.
What is the projected Value of Digital Content Creator Market By 2032?
The global digital content creator market size is predicted to be valued at US$ 12.9 Billion by 2032.
What was the Historical Size of the Digital Content Creator Market?
The global digital content creator market share was valued at US$ 3.4 Billion in 2021.
Which Country Accounts for the largest Revenue Share in the Digital Content Creator Market?
US accounts for the largest revenue share in the global digital content creator market.
Which Country has the Highest Growth Potential in the Digital Content Creator Market?
China is predicted to witness the highest CAGR of 15.7% in the digital content creator market.
Table of Content
1. Executive Summary 1.1. Global Market Outlook 1.2. Demand Side Trends 1.3. Supply Side Trends 1.4. Analysis and Recommendations 2. Market Overview 2.1. Market Coverage / Taxonomy 2.2. Market Definition / Scope / Limitations 3. Key Market Trends 3.1. Key Trends Impacting the Market 3.2. Solution Innovation / Development Trends 4. Pricing Analysis 4.1. Types of Pricing Models 4.2. Regional Pricing Analysis 4.3. Global Average Pricing Analysis Benchmark 5. Global Market Demand (in Value or Size in US$ Mn) Analysis 2017-2021 and Forecast, 2022-2032 5.1. Historical Market Value (US$ Mn) Analysis, 2017-2021 5.2. Current and Future Market Value (US$ Mn) Projections, 2022-2032 5.2.1. Y-o-Y Growth Trend Analysis 5.2.2. Absolute $ Opportunity Analysis 6. Market Background 6.1. Macro-Economic Factors 6.2. Forecast Factors - Relevance & Impact 6.3. Value Chain 6.4. COVID-19 Crisis – Impact Assessment 6.4.1. Current Statistics 6.4.2. Short-Mid-Long Term Outlook 6.4.3. Likely Rebound 6.5. Market Dynamics 6.5.1. Drivers 6.5.2. Restraints 6.5.3. Opportunity Analysis 6.6. Global Supply Demand Analysis 7. Market Analysis 2017-2021 and Forecast 2022-2032, by Type 7.1. Introduction / Key Findings 7.2. Historical Market Size (US$ Mn) Analysis By Type, 2017-2021 7.3. Current and Future Market Size (US$ Mn) Analysis and Forecast By Type, 2022-2032 7.3.1. Freelancer 7.3.2. Blogger 7.3.3. Digital Writers 7.3.4. Others 7.4. Market Attractiveness Analysis By Type 8. Market Analysis 2017-2021 and Forecast 2022-2032, by Platform 8.1. Introduction / Key Findings 8.2. Historical Market Size (US$ Mn) Analysis By Platform, 2017-2021 8.3. Current and Future Market Size (US$ Mn) Analysis and Forecast By Platform, 2022-2032 8.3.1. Social Media 8.3.2. Blogs 8.3.3. Podcasts 8.3.4. Video Platforms 8.3.5. Case Studies 8.3.6. White Papers 8.3.7. Infographics 8.3.8. Others 8.4. Market Attractiveness Analysis By Platform 9. Market Analysis 2017-2021 and Forecast 2022-2032, by End Use 9.1. Introduction / Key Findings 9.2. Historical Market Size (US$ Mn) Analysis By End Use, 2017-2021 9.3. Current and Future Market Size (US$ Mn) Analysis and Forecast By End Use, 2022-2032 9.3.1. Marketing 9.3.2. Public Relations 9.3.3. Business 9.3.4. Journalism 9.3.5. Literature 9.3.6. Media & Entertainment 9.3.7. Others 9.4. Market Attractiveness Analysis By End Use 10. Market Analysis 2017-2021 and Forecast 2022-2032, by Region 10.1. Introduction 10.2. Historical Market Size (US$ Mn) Analysis By Region, 2017-2021 10.3. Current Market Size (US$ Mn) Analysis and Forecast By Region, 2022-2032 10.3.1. North America 10.3.2. Latin America 10.3.3. Europe 10.3.4. East Asia 10.3.5. South Asia & Pacific 10.3.6. Middle East and Africa (MEA) 10.4. Market Attractiveness Analysis By Region 11. North America Market Analysis 2017-2021 and Forecast 2022-2032 11.1. Introduction 11.2. Historical Market Size (US$ Mn) Trend Analysis By Market Taxonomy, 2017-2021 11.3. Market Size (US$ Mn) Forecast By Market Taxonomy, 2022-2032 11.3.1. By Country 11.3.1.1. U.S. 11.3.1.2. Canada 11.3.2. By Type 11.3.3. By Platform 11.3.4. By End Use 11.4. Market Attractiveness Analysis 11.4.1. By Country 11.4.2. By Type 11.4.3. By Platform 11.4.4. By End Use 11.5. Key Market Participants - Intensity Mapping 11.6. Drivers and Restraints - Impact Analysis 12. Latin America Market Analysis 2017-2021 and Forecast 2022-2032 12.1. Introduction 12.2. Historical Market Size (US$ Mn) Trend Analysis By Market Taxonomy, 2017-2021 12.3. Market Size (US$ Mn) Forecast By Market Taxonomy, 2022-2032 12.3.1. By Country 12.3.1.1. Brazil 12.3.1.2. Mexico 12.3.1.3. Rest of Latin America 12.3.2. By Type 12.3.3. By Platform 12.3.4. By End Use 12.4. Market Attractiveness Analysis 12.4.1. By Country 12.4.2. By Type 12.4.3. By Platform 12.4.4. By End Use 12.5. Key Market Participants - Intensity Mapping 12.6. Drivers and Restraints - Impact Analysis 13. Europe Market Analysis 2017-2021 and Forecast 2022-2032 13.1. Introduction 13.2. Historical Market Size (US$ Mn) Trend Analysis By Market Taxonomy, 2017-2021 13.3. Market Size (US$ Mn) Forecast By Market Taxonomy, 2022-2032 13.3.1. By Country 13.3.1.1. Germany 13.3.1.2. Italy 13.3.1.3. France 13.3.1.4. U.K. 13.3.1.5. Spain 13.3.1.6. BENELUX 13.3.1.7. Russia 13.3.1.8. Rest of Europe 13.3.2. By Type 13.3.3. By Platform 13.3.4. By End Use 13.4. Market Attractiveness Analysis 13.4.1. By Country 13.4.2. By Type 13.4.3. By Platform 13.4.4. By End Use 13.5. Key Market Participants - Intensity Mapping 13.6. Drivers and Restraints - Impact Analysis 14. South Asia & Pacific Market Analysis 2017-2021 and Forecast 2022-2032 14.1. Introduction 14.2. Historical Market Size (US$ Mn) Trend Analysis By Market Taxonomy, 2017-2021 14.3. Market Size (US$ Mn) Forecast By Market Taxonomy, 2022-2032 14.3.1. By Country 14.3.1.1. India 14.3.1.2. ASEAN 14.3.1.3. Oceania 14.3.1.4. Rest of South Asia & Pacific 14.3.2. By Type 14.3.3. By Platform 14.3.4. By End Use 14.4. Market Attractiveness Analysis 14.4.1. By Country 14.4.2. By Type 14.4.3. By Platform 14.4.4. By End Use 14.5. Key Market Participants - Intensity Mapping 14.6. Drivers and Restraints - Impact Analysis 15. East Asia Market Analysis 2017-2021 and Forecast 2022-2032 15.1. Introduction 15.2. Historical Market Size (US$ Mn) Trend Analysis By Market Taxonomy, 2017-2021 15.3. Market Size (US$ Mn) Forecast By Market Taxonomy, 2022-2032 15.3.1. By Country 15.3.1.1. China 15.3.1.2. Japan 15.3.1.3. South Korea 15.3.2. By Type 15.3.3. By Platform 15.3.4. By End Use 15.4. Market Attractiveness Analysis 15.4.1. By Country 15.4.2. By Type 15.4.3. By Platform 15.4.4. By End Use 15.5. Key Market Participants - Intensity Mapping 15.6. Drivers and Restraints - Impact Analysis 16. Middle East & Africa Market Analysis 2017-2021 and Forecast 2022-2032 16.1. Introduction 16.2. Historical Market Size (US$ Mn) Trend Analysis By Market Taxonomy, 2017-2021 16.3. Market Size (US$ Mn) Forecast By Market Taxonomy, 2022-2032 16.3.1. By Country 16.3.1.1. GCC Countries 16.3.1.2. Turkey 16.3.1.3. Northern Africa 16.3.1.4. South Africa 16.3.1.5. Rest of Middle East and Africa 16.3.2. By Type 16.3.3. By Platform 16.3.4. By End Use 16.4. Market Attractiveness Analysis 16.4.1. By Country 16.4.2. By Type 16.4.3. By Platform 16.4.4. By End Use 16.5. Key Market Participants - Intensity Mapping 16.6. Drivers and Restraints - Impact Analysis 17. Key Countries Analysis- Market 17.1. U.S. Market Analysis 17.1.1. By Type 17.1.2. By Platform 17.1.3. By End Use 17.2. Canada Market Analysis 17.2.1. By Type 17.2.2. By Platform 17.2.3. By End Use 17.3. Mexico Market Analysis 17.3.1. By Type 17.3.2. By Platform 17.3.3. By End Use 17.4. Brazil Market Analysis 17.4.1. By Type 17.4.2. By Platform 17.4.3. By End Use 17.5. Germany Market Analysis 17.5.1. By Type 17.5.2. By Platform 17.5.3. By End Use 17.6. Italy Market Analysis 17.6.1. By Type 17.6.2. By Platform 17.6.3. By End Use 17.7. France Market Analysis 17.7.1. By Type 17.7.2. By Platform 17.7.3. By End Use 17.8. U.K. Market Analysis 17.8.1. By Type 17.8.2. By Platform 17.8.3. By End Use 17.9. Spain Market Analysis 17.9.1. By Type 17.9.2. By Platform 17.9.3. By End Use 17.10. Russia Market Analysis 17.10.1. By Type 17.10.2. By Platform 17.10.3. By End Use 17.11. China Market Analysis 17.11.1. By Type 17.11.2. By Platform 17.11.3. By End Use 17.12. Japan Market Analysis 17.12.1. By Type 17.12.2. By Platform 17.12.3. By End Use 17.13. S. Korea Market Analysis 17.13.1. By Type 17.13.2. By Platform 17.13.3. By End Use 17.14. India Market Analysis 17.14.1. By Type 17.14.2. By Platform 17.14.3. By End Use 17.15. ASEAN Market Analysis 17.15.1. By Type 17.15.2. By Platform 17.15.3. By End Use 17.16. Australia and New Zealand Market Analysis 17.16.1. By Type 17.16.2. By Platform 17.16.3. By End Use 17.17. Turkey Market Analysis 17.17.1. By Type 17.17.2. By Platform 17.17.3. By End Use 17.18. South Africa Market Analysis 17.18.1. By Type 17.18.2. By Platform 17.18.3. By End Use 18. Market Structure Analysis 18.1. Market Analysis by Tier of Companies 18.2. Market Share Analysis of Top Players 18.3. Market Presence Analysis 19. Competition Analysis 19.1. Competition Dashboard 19.2. Competition Benchmarking 19.3. Competition Deep Dive 19.3.1. Pepper Content Pvt. Ltd. 19.3.1.1. Business Overview 19.3.1.2. Solution Portfolio 19.3.1.3. Profitability by Market Segments (Business Segment/Region) 19.3.1.4. SWOT Analysis 19.3.1.5. Key Strategies & Developments 19.3.2. GroCurv Pvt. Ltd. 19.3.2.1. Business Overview 19.3.2.2. Solution Portfolio 19.3.2.3. Profitability by Market Segments (Business Segment/Region) 19.3.2.4. SWOT Analysis 19.3.2.5. Key Strategies & Developments 19.3.3. Brafton 19.3.3.1. Business Overview 19.3.3.2. Solution Portfolio 19.3.3.3. Profitability by Market Segments (Business Segment/Region) 19.3.3.4. SWOT Analysis 19.3.3.5. Key Strategies & Developments 19.3.4. Content-Whale 19.3.4.1. Business Overview 19.3.4.2. Solution Portfolio 19.3.4.3. Profitability by Market Segments (Business Segment/Region) 19.3.4.4. SWOT Analysis 19.3.4.5. Key Strategies & Developments 19.3.5. battleROYAL GmbH 19.3.5.1. Business Overview 19.3.5.2. Solution Portfolio 19.3.5.3. Profitability by Market Segments (Business Segment/Region) 19.3.5.4. SWOT Analysis 19.3.5.5. Key Strategies & Developments 19.3.6. Bravr Ltd 19.3.6.1. Business Overview 19.3.6.2. Solution Portfolio 19.3.6.3. Profitability by Market Segments (Business Segment/Region) 19.3.6.4. SWOT Analysis 19.3.6.5. Key Strategies & Developments 19.3.7. Oban International 19.3.7.1. Business Overview 19.3.7.2. Solution Portfolio 19.3.7.3. Profitability by Market Segments (Business Segment/Region) 19.3.7.4. SWOT Analysis 19.3.7.5. Key Strategies & Developments 19.3.8. SevenAtoms Marketing Inc. 19.3.8.1. Business Overview 19.3.8.2. Solution Portfolio 19.3.8.3. Profitability by Market Segments (Business Segment/Region) 19.3.8.4. SWOT Analysis 19.3.8.5. Key Strategies & Developments 19.3.9. madison/miles media 19.3.9.1. Business Overview 19.3.9.2. Solution Portfolio 19.3.9.3. Profitability by Market Segments (Business Segment/Region) 19.3.9.4. SWOT Analysis 19.3.9.5. Key Strategies & Developments 19.3.10. Vazoola 19.3.10.1. Business Overview 19.3.10.2. Solution Portfolio 19.3.10.3. Profitability by Market Segments (Business Segment/Region) 19.3.10.4. SWOT Analysis 19.3.10.5. Key Strategies & Developments 19.3.11. Carney Technologies Services 19.3.11.1. Business Overview 19.3.11.2. Solution Portfolio 19.3.11.3. Profitability by Market Segments (Business Segment/Region) 19.3.11.4. SWOT Analysis 19.3.11.5. Key Strategies & Developments 19.3.12. CloudMellow 19.3.12.1. Business Overview 19.3.12.2. Solution Portfolio 19.3.12.3. Profitability by Market Segments (Business Segment/Region) 19.3.12.4. SWOT Analysis 19.3.12.5. Key Strategies & Developments 19.3.13. OuterBox 19.3.13.1. Business Overview 19.3.13.2. Solution Portfolio 19.3.13.3. Profitability by Market Segments (Business Segment/Region) 19.3.13.4. SWOT Analysis 19.3.13.5. Key Strategies & Developments 20. Assumptions and Acronyms Used 21. Research Methodology
Let us know your requirement to get
100% FREE customization
List of Tables
Table 01: Global Market Value (US$ Mn) Analysis (2017 – 2021) by Type Table 02: Global Market Value (US$ Mn) Forecast (2022 – 2032) by Type Table 03: Global Market Value (US$ Mn) Analysis (2017 – 2021) by Platform Table 04: Global Market Value (US$ Mn) Forecast (2022 – 2032) by Platform Table 05: Global Market Value (US$ Mn) Analysis (2017 – 2021) by End Use Table 06: Global Market Value (US$ Mn) Forecast (2022 – 2032) by End Use Table 07: Global Market Value (US$ Mn) Analysis (2017 – 2021) by Region Table 08: Global Market Value (US$ Mn) Forecast (2022 – 2032) by Region Table 09: North America Market Value (US$ Mn) Analysis (2017 – 2021) by Type Table 10: North America Market Value (US$ Mn) Forecast (2022 – 2032) by Type Table 11: North America Market Value (US$ Mn) Analysis (2017 – 2021) by Platform Table 12: North America Market Value (US$ Mn) Forecast (2022 – 2032) by Platform Table 13: North America Market Value (US$ Mn) Analysis (2017 – 2021) by End Use Table 14: North America Market Value (US$ Mn) Forecast (2022 – 2032) by End Use Table 15: North America Market Value (US$ Mn) Analysis (2017 – 2021) by Country Table 16: North America Market Value (US$ Mn) Forecast (2022 – 2032) by Country Table 17: Latin America Market Value (US$ Mn) Analysis (2017 – 2021) by Type Table 18: Latin America Market Value (US$ Mn) Forecast (2022 – 2032) by Type Table 19: Latin America Market Value (US$ Mn) Analysis (2017 – 2021) by Platform Table 20: Latin America Market Value (US$ Mn) Forecast (2022 – 2032) by Platform Table 21: Latin America Market Value (US$ Mn) Analysis (2017 – 2021) by End Use Table 22: Latin America Market Value (US$ Mn) Forecast (2022 – 2032) by End Use Table 23: Latin America Market Value (US$ Mn) Analysis (2017 – 2021) by Country Table 24: Latin America Market Value (US$ Mn) Forecast (2022 – 2032) by Country Table 25: Europe Market Value (US$ Mn) Analysis (2017 – 2021) by Type Table 26: Europe Market Value (US$ Mn) Forecast (2022 – 2032) by Type Table 27: Europe Market Value (US$ Mn) Analysis (2017 – 2021) by Platform Table 28: Europe Market Value (US$ Mn) Forecast (2022 – 2032) by Platform Table 29: Europe Market Value (US$ Mn) Analysis (2017 – 2021) by End Use Table 30: Europe Market Value (US$ Mn) Forecast (2022 – 2032) by End Use Table 31: Europe Market Value (US$ Mn) Analysis (2017 – 2021) by Country Table 32: Italy Market Value (US$ Mn) Analysis (2017 – 2021) by Platform Table 33: Europe Market Value (US$ Mn) Forecast (2022 – 2032) by Country Table 34: East Asia Market Value (US$ Mn) Analysis (2017 – 2021) by Type Table 35: East Asia Market Value (US$ Mn) Forecast (2022 – 2032) by Type Table 36: East Asia Market Value (US$ Mn) Analysis (2017 – 2021) by Platform Table 37: East Asia Market Value (US$ Mn) Forecast (2022 – 2032) by Platform Table 38: East Asia Market Value (US$ Mn) Analysis (2017 – 2021) by End Use Table 39: East Asia Market Value (US$ Mn) Forecast (2022 – 2032) by End Use Table 40: East Asia Market Value (US$ Mn) Analysis (2017 – 2021) by Country Table 41: East Asia Market Value (US$ Mn) Forecast (2022 – 2032) by Country Table 42: South Asia & Pacific Market Value (US$ Mn) Analysis (2017 – 2021) by Type Table 43: South Asia & Pacific Market Value (US$ Mn) Forecast (2022 – 2032) by Type Table 44: South Asia & Pacific Market Value (US$ Mn) Analysis (2017 – 2021) by Platform Table 45: South Asia & Pacific Market Value (US$ Mn) Forecast (2022 – 2032) by Platform Table 46: South Asia & Pacific Market Value (US$ Mn) Analysis (2017 – 2021) by End Use Table 47: South Asia & Pacific Market Value (US$ Mn) Forecast (2022 – 2032) by End Use Table 48: South Asia & Pacific Market Value (US$ Mn) Analysis (2017 – 2021) by Country Table 49: South Asia & Pacific Market Value (US$ Mn) Forecast (2022 – 2032) by Country Table 50: Middle East & Africa Market Value (US$ Mn) Analysis (2017 – 2021) by Type Table 51: Middle East & Africa Market Value (US$ Mn) Forecast (2022 – 2032) by Type Table 52: Middle East & Africa Market Value (US$ Mn) Analysis (2017 – 2021) by Platform Table 53: Middle East & Africa Market Value (US$ Mn) Forecast (2022 – 2032) by Platform Table 54: Mexico Market Value (US$ Mn) Forecast (2022 – 2032) by Type Table 55: Middle East & Africa Market Value (US$ Mn) Analysis (2017 – 2021) by End Use Table 56: Middle East & Africa Market Value (US$ Mn) Forecast (2022 – 2032) by End Use Table 57: Middle East & Africa Market Value (US$ Mn) Analysis (2017 – 2021) by Country Table 58: Middle East & Africa Market Value (US$ Mn) Forecast (2022 – 2032) by Country Table 59: U.S. Market Value (US$ Mn) Analysis (2017 – 2021) by Type Table 60: U.S. Market Value (US$ Mn) Forecast (2022 – 2032) by Type Table 61: U.S. Market Value (US$ Mn) Analysis (2017 – 2021) by Platform Table 62: U.S. Market Value (US$ Mn) Forecast (2022 – 2032) by Platform Table 63: U.S. Market Value (US$ Mn) Analysis (2017 – 2021) by End Use Table 64: U.S. Market Value (US$ Mn) Forecast (2022 – 2032) by End Use Table 65: Canada Market Value (US$ Mn) Analysis (2017 – 2021) by Type Table 66: Canada Market Value (US$ Mn) Forecast (2022 – 2032) by Type Table 67: Canada Market Value (US$ Mn) Analysis (2017 – 2021) by Platform Table 68: Canada Market Value (US$ Mn) Forecast (2022 – 2032) by Platform Table 69: Canada Market Value (US$ Mn) Analysis (2017 – 2021) by End Use Table 70: Canada Market Value (US$ Mn) Forecast (2022 – 2032) by End Use Table 71: Brazil Market Value (US$ Mn) Analysis (2017 – 2021) by Type Table 72: Brazil Market Value (US$ Mn) Forecast (2022 – 2032) by Type Table 73: Brazil Market Value (US$ Mn) Analysis (2017 – 2021) by Platform Table 74: Brazil Market Value (US$ Mn) Forecast (2022 – 2032) by Platform Table 75: Brazil Market Value (US$ Mn) Analysis (2017 – 2021) by End Use Table 76: Brazil Market Value (US$ Mn) Forecast (2022 – 2032) by End Use Table 77: Mexico Market Value (US$ Mn) Analysis (2017 – 2021) by Type Table 78: Mexico Market Value (US$ Mn) Analysis (2017 – 2021) by Platform Table 79: Mexico Market Value (US$ Mn) Forecast (2022 – 2032) by Platform Table 80: Mexico Market Value (US$ Mn) Analysis (2017 – 2021) by End Use Table 81: Mexico Market Value (US$ Mn) Forecast (2022 – 2032) by End Use Table 82: Rest of Latin America Market Value (US$ Mn) Analysis (2017 – 2021) by Type Table 83: Rest of Latin America Market Value (US$ Mn) Forecast (2022 – 2032) by Type Table 84: Rest of Latin America Market Value (US$ Mn) Analysis (2017 – 2021) by Platform Table 85: Rest of Latin America Market Value (US$ Mn) Forecast (2022 – 2032) by Platform Table 86: Rest of Latin America Market Value (US$ Mn) Analysis (2017 – 2021) by End Use Table 87: Rest of Latin America Market Value (US$ Mn) Forecast (2022 – 2032) by End Use Table 88: UK Market Value (US$ Mn) Analysis (2017 – 2021) by Type Table 89: UK Market Value (US$ Mn) Forecast (2022 – 2032) by Type Table 90: UK Market Value (US$ Mn) Analysis (2017 – 2021) by Platform Table 91: UK Market Value (US$ Mn) Forecast (2022 – 2032) by Platform Table 92: UK Market Value (US$ Mn) Analysis (2017 – 2021) by End Use Table 93: UK Market Value (US$ Mn) Forecast (2022 – 2032) by End Use Table 94: Germany Market Value (US$ Mn) Analysis (2017 – 2021) by Type Table 95: Germany Market Value (US$ Mn) Forecast (2022 – 2032) by Type Table 96: Germany Market Value (US$ Mn) Analysis (2017 – 2021) by Platform Table 97: Germany Market Value (US$ Mn) Forecast (2022 – 2032) by Platform Table 98: Germany Market Value (US$ Mn) Analysis (2017 – 2021) by End Use Table 99: Germany Market Value (US$ Mn) Forecast (2022 – 2032) by End Use Table 100: France Market Value (US$ Mn) Analysis (2017 – 2021) by Type Table 101: France Market Value (US$ Mn) Forecast (2022 – 2032) by Type Table 102: France Market Value (US$ Mn) Analysis (2017 – 2021) by Platform Table 103: France Market Value (US$ Mn) Forecast (2022 – 2032) by Platform Table 104: France Market Value (US$ Mn) Analysis (2017 – 2021) by End Use Table 105: France Market Value (US$ Mn) Forecast (2022 – 2032) by End Use Table 106: Italy Market Value (US$ Mn) Analysis (2017 – 2021) by Type Table 107: Italy Market Value (US$ Mn) Forecast (2022 – 2032) by Type Table 108: Italy Market Value (US$ Mn) Forecast (2022 – 2032) by Platform Table 109: Italy Market Value (US$ Mn) Analysis (2017 – 2021) by End Use Table 110: Italy Market Value (US$ Mn) Forecast (2022 – 2032) by End Use Table 111: Spain Market Value (US$ Mn) Analysis (2017 – 2021) by Type Table 112: Spain Market Value (US$ Mn) Forecast (2022 – 2032) by Type Table 113: Spain Market Value (US$ Mn) Analysis (2017 – 2021) by Platform Table 114: Spain Market Value (US$ Mn) Forecast (2022 – 2032) by Platform Table 115: Spain Market Value (US$ Mn) Analysis (2017 – 2021) by End Use Table 116: Spain Market Value (US$ Mn) Forecast (2022 – 2032) by End Use Table 117: Benelux Market Value (US$ Mn) Analysis (2017 – 2021) by Type Table 118: Benelux Market Value (US$ Mn) Forecast (2022 – 2032) by Type Table 119: Benelux Market Value (US$ Mn) Analysis (2017 – 2021) by Platform Table 120: Benelux Market Value (US$ Mn) Forecast (2022 – 2032) by Platform Table 121: Benelux U.S. Market Value (US$ Mn) Analysis (2017 – 2021) by End Use Table 122: Benelux Market Value (US$ Mn) Forecast (2022 – 2032) by End Use Table 123: Russia Market Value (US$ Mn) Analysis (2017 – 2021) by Type Table 124: Russia Market Value (US$ Mn) Forecast (2022 – 2032) by Type Table 125: Russia Market Value (US$ Mn) Analysis (2017 – 2021) by Platform Table 126: Russia Market Value (US$ Mn) Forecast (2022 – 2032) by Platform Table 127: Russia Market Value (US$ Mn) Analysis (2017 – 2021) by End Use Table 128: Russia Market Value (US$ Mn) Forecast (2022 – 2032) by End Use Table 129: Rest of Europe Market Value (US$ Mn) Analysis (2017 – 2021) by Type Table 130: Rest of Europe Market Value (US$ Mn) Forecast (2022 – 2032) by Type Table 131: Rest of Europe Market Value (US$ Mn) Analysis (2017 – 2021) by Platform Table 132: Rest of Europe Market Value (US$ Mn) Forecast (2022 – 2032) by Platform Table 133: Rest of Europe Market Value (US$ Mn) Analysis (2017 – 2021) by End Use Table 134: Rest of Europe Market Value (US$ Mn) Forecast (2022 – 2032) by End Use Table 135: China Market Value (US$ Mn) Analysis (2017 – 2021) by Type Table 136: China Market Value (US$ Mn) Forecast (2022 – 2032) by Type Table 137: China Market Value (US$ Mn) Analysis (2017 – 2021) by Platform Table 138: China Market Value (US$ Mn) Forecast (2022 – 2032) by Platform Table 139: China Market Value (US$ Mn) Analysis (2017 – 2021) by End Use Table 140: China Market Value (US$ Mn) Forecast (2022 – 2032) by End Use Table 141: Japan Market Value (US$ Mn) Analysis (2017 – 2021) by Type Table 142: Japan Market Value (US$ Mn) Forecast (2022 – 2032) by Type Table 143: Japan Market Value (US$ Mn) Analysis (2017 – 2021) by Platform Table 144: Japan Market Value (US$ Mn) Forecast (2022 – 2032) by Platform Table 145: Japan Market Value (US$ Mn) Analysis (2017 – 2021) by End Use Table 146: Japan Market Value (US$ Mn) Forecast (2022 – 2032) by End Use Table 147: South Korea Market Value (US$ Mn) Analysis (2017 – 2021) by Type Table 148: South Korea Market Value (US$ Mn) Forecast (2022 – 2032) by Type Table 149: South Korea Market Value (US$ Mn) Analysis (2017 – 2021) by Platform Table 150: South Korea Market Value (US$ Mn) Forecast (2022 – 2032) by Platform Table 151: South Korea Market Value (US$ Mn) Analysis (2017 – 2021) by End Use Table 152: South Korea Market Value (US$ Mn) Forecast (2022 – 2032) by End Use Table 153: India Market Value (US$ Mn) Analysis (2017 – 2021) by Type Table 154: India Market Value (US$ Mn) Forecast (2022 – 2032) by Type Table 155: India Market Value (US$ Mn) Analysis (2017 – 2021) by Platform Table 156: India Market Value (US$ Mn) Forecast (2022 – 2032) by Platform Table 157: India Market Value (US$ Mn) Analysis (2017 – 2021) by End Use Table 158: India Market Value (US$ Mn) Forecast (2022 – 2032) by End Use Table 159: Thailand Market Value (US$ Mn) Analysis (2017 – 2021) by Type Table 160: Thailand Market Value (US$ Mn) Forecast (2022 – 2032) by Type Table 161: Thailand Market Value (US$ Mn) Analysis (2017 – 2021) by Platform Table 162: Thailand Market Value (US$ Mn) Forecast (2022 – 2032) by Platform Table 163: Thailand Market Value (US$ Mn) Analysis (2017 – 2021) by End Use Table 164: Thailand Market Value (US$ Mn) Forecast (2022 – 2032) by End Use Table 165: Indonesia Market Value (US$ Mn) Analysis (2017 – 2021) by Type Table 166: Indonesia Market Value (US$ Mn) Forecast (2022 – 2032) by Type Table 167: Indonesia Market Value (US$ Mn) Analysis (2017 – 2021) by Platform Table 168: Indonesia Market Value (US$ Mn) Forecast (2022 – 2032) by Platform Table 169: Indonesia Market Value (US$ Mn) Analysis (2017 – 2021) by End Use Table 170: Indonesia Market Value (US$ Mn) Forecast (2022 – 2032) by End Use Table 171: Malaysia Market Value (US$ Mn) Analysis (2017 – 2021) by Type Table 172: Malaysia Market Value (US$ Mn) Forecast (2022 – 2032) by Type Table 173: Malaysia Market Value (US$ Mn) Analysis (2017 – 2021) by Platform Table 174: Malaysia Market Value (US$ Mn) Forecast (2022 – 2032) by Platform Table 175: Malaysia Market Value (US$ Mn) Analysis (2017 – 2021) by End Use Table 176: Malaysia Market Value (US$ Mn) Forecast (2022 – 2032) by End Use Table 177: Australia & New Zealand Market Value (US$ Mn) Analysis (2017 – 2021) by Type Table 178: Australia & New Zealand Market Value (US$ Mn) Forecast (2022 – 2032) by Type Table 179: Australia & New Zealand Market Value (US$ Mn) Analysis (2017 – 2021) by Platform Table 180: Australia & New Zealand Market Value (US$ Mn) Forecast (2022 – 2032) by Platform Table 181: Australia & New Zealand Market Value (US$ Mn) Analysis (2017 – 2021) by End Use Table 182: Australia & New Zealand Market Value (US$ Mn) Forecast (2022 – 2032) by End Use Table 183: Rest of SAP Market Value (US$ Mn) Analysis (2017 – 2021) by Type Table 184: Rest of SAP Market Value (US$ Mn) Forecast (2022 – 2032) by Type Table 185: Rest of SAP Market Value (US$ Mn) Analysis (2017 – 2021) by Platform Table 186: Rest of SAP Market Value (US$ Mn) Forecast (2022 – 2032) by Platform Table 187: Rest of SAP Market Value (US$ Mn) Analysis (2017 – 2021) by End Use Table 188: Rest of SAP Market Value (US$ Mn) Forecast (2022 – 2032) by End Use Table 189: GCC Countries Market Value (US$ Mn) Analysis (2017 – 2021) by Type Table 190: GCC Countries Market Value (US$ Mn) Forecast (2022 – 2032) by Type Table 191: GCC Countries Market Value (US$ Mn) Analysis (2017 – 2021) by Platform Table 192: GCC Countries Market Value (US$ Mn) Forecast (2022 – 2032) by Platform Table 193: GCC Countries Market Value (US$ Mn) Analysis (2017 – 2021) by End Use Table 194: GCC Countries Market Value (US$ Mn) Forecast (2022 – 2032) by End Use Table 195: Turkey Market Value (US$ Mn) Analysis (2017 – 2021) by Type Table 196: Turkey Market Value (US$ Mn) Forecast (2022 – 2032) by Type Table 197: Turkey Market Value (US$ Mn) Analysis (2017 – 2021) by Platform Table 198: Turkey Market Value (US$ Mn) Forecast (2022 – 2032) by Platform Table 199: Turkey Market Value (US$ Mn) Analysis (2017 – 2021) by End Use Table 200: Turkey Market Value (US$ Mn) Forecast (2022 – 2032) by End Use Table 201: South Africa Market Value (US$ Mn) Analysis (2017 – 2021) by Type Table 202: South Africa Market Value (US$ Mn) Forecast (2022 – 2032) by Type Table 203: South Africa Market Value (US$ Mn) Analysis (2017 – 2021) by Platform Table 204: South Africa Market Value (US$ Mn) Forecast (2022 – 2032) by Platform Table 205: South Africa Market Value (US$ Mn) Analysis (2017 – 2021) by End Use Table 206: South Africa Market Value (US$ Mn) Forecast (2022 – 2032) by End Use Table 207: Rest of Middle East & Africa Market Value (US$ Mn) Analysis (2017 – 2021) by Type Table 208: Rest of Middle East & Africa Market Value (US$ Mn) Forecast (2022 – 2032) by Type Table 209: Rest of Middle East & Africa Market Value (US$ Mn) Analysis (2017 – 2021) by Platform Table 210: Rest of Middle East & Africa Market Value (US$ Mn) Forecast (2022 – 2032) by Platform Table 211: Rest of Middle East & Africa Market Value (US$ Mn) Analysis (2017 – 2021) by End Use Table 212: Rest of Middle East & Africa Market Value (US$ Mn) Forecast (2022 – 2032) by End Use
Find your sweet spots for generating winning opportunities in this market.
Talk to AnalystList of Charts
Figure 01: Global Market Size (US$ Mn) and Y-o-Y Growth Rate from 2022 – 2032 Figure 02: Global Market Absolute $ Opportunity from 2022 – 2032 Figure 03: Global Market Value (US$ Mn), 2017-2021 Figure 04: Global Market Value (US$ Mn), 2022-2032 Figure 05: Global Market Value Share Analysis (2022 – 2032) by Type Figure 06: Global Market Value Y-o-Y Growth Trend Analysis (2019 – 2032) by Type Figure 07: Global Market Attractiveness by Type Figure 08: Global Market Value Share Analysis (2022 – 2032) by Platform Figure 09: Global Market Value Y-o-Y Growth Trend Analysis (2019 – 2032) by Platform Figure 10: Global Market Attractiveness by Platform Figure 11: Global Market Value Share Analysis (2022 – 2032) by End Use Figure 12: Global Market Value Y-o-Y Growth Trend Analysis (2019 – 2032) by End Use Figure 13: Global Market Attractiveness by End Use Figure 14: Global Market Value Share Analysis (2022 – 2032) by Region Figure 15: Global Market Value Y-o-Y Growth Trend Analysis (2019 – 2032) by Region Figure 16: North America Market Absolute $ Opportunity (US$ Mn), 2017 – 2032 Figure 17: Rest of Middle East & Africa Market Absolute $ Opportunity (US$ Mn), 2017 – 2032 Figure 18: Latin America Market Absolute $ Opportunity (US$ Mn), 2017 – 2032 Figure 19: Europe Market Absolute $ Opportunity (US$ Mn), 2017 – 2032 Figure 20: East Asia Market Absolute $ Opportunity (US$ Mn), 2017 – 2032 Figure 21: South Asia and Pacific Market Absolute $ Opportunity (US$ Mn), 2017 – 2032 Figure 22: Middle East and Africa Market Absolute $ Opportunity (US$ Mn), 2017 – 2032 Figure 23: Global Market Attractiveness by Region Figure 24: North America Market Value (US$ Mn), 2017-2021 Figure 25: North America Market Value (US$ Mn), 2022-2032 Figure 26: North America Market Value Share Analysis (2022 – 2032) by Type Figure 27: North America Market Value Y-o-Y Growth Trend Analysis (2019 – 2032) by Type Figure 28: North America Market Attractiveness by Type Figure 29: North America Market Value Share Analysis (2022 – 2032) by Platform Figure 30: North America Market Value Y-o-Y Growth Trend Analysis (2019 – 2032) by Platform Figure 31: North America Market Attractiveness by Platform Figure 32: North America Market Value Share Analysis (2022 – 2032) by End Use Figure 33: North America Market Value Y-o-Y Growth Trend Analysis (2019 – 2032) by End Use Figure 34: North America Market Attractiveness by End Use Figure 35: North America Market Value Share Analysis (2022 – 2032) by Country Figure 36: North America Market Value Y-o-Y Growth Trend Analysis (2019 – 2032) by Country Figure 37:U.S. Market Absolute $ Opportunity (US$ Mn), 2017 – 2032 Figure 38: Canada Market Absolute $ Opportunity (US$ Mn), 2017 – 2032 Figure 39: North America Market Attractiveness by Country Figure 40: Latin America Market Value (US$ Mn), 2017-2021 Figure 41: Latin America Market Value (US$ Mn), 2022-2032 Figure 42: Latin America Market Value Share Analysis (2022 – 2032) by Type Figure 43: Latin America Market Value Y-o-Y Growth Trend Analysis (2019 – 2032) by Type Figure 44: Latin America Market Attractiveness by Type Figure 45: Latin America Market Value Share Analysis (2022 – 2032) by Platform Figure 46: Latin America Market Value Y-o-Y Growth Trend Analysis (2019 – 2032) by Platform Figure 47: Latin America Market Attractiveness by Platform Figure 48: Latin America Market Value Share Analysis (2022 – 2032) by End Use Figure 49: Latin America Market Value Y-o-Y Growth Trend Analysis (2019 – 2032) by End Use Figure 50: Latin America Market Attractiveness by End Use Figure 51: Latin America Market Value Share Analysis (2022 – 2032) by Country Figure 52: Latin America Market Value Y-o-Y Growth Trend Analysis (2019 – 2032) by Country Figure 53: Brazil Market Absolute $ Opportunity (US$ Mn), 2017 – 2032 Figure 54: Mexico Market Absolute $ Opportunity (US$ Mn), 2017 – 2032 Figure 55: Rest of Latin America Market Absolute $ Opportunity (US$ Mn), 2017 – 2032 Figure 56: Latin America Market Attractiveness by Country Figure 57: Europe Market Value (US$ Mn), 2017-2021 Figure 58: Europe Market Value (US$ Mn), 2022-2032 Figure 59: Europe Market Value Share Analysis (2022 – 2032) by Type Figure 60: Europe Market Value Y-o-Y Growth Trend Analysis (2019 – 2032) by Type Figure 61: Europe Market Attractiveness by Type Figure 62: Europe Market Value Share Analysis (2022 – 2032) by Platform Figure 63: Europe Market Value Y-o-Y Growth Trend Analysis (2019 – 2032) by Platform Figure 64: Europe Market Attractiveness by Platform Figure 65: Europe Market Value Share Analysis (2022 – 2032) by End Use Figure 66: Europe Market Value Y-o-Y Growth Trend Analysis (2019 – 2032) by End Use Figure 67: Europe Market Attractiveness by End Use Figure 68: Europe Market Value Share Analysis (2022 – 2032) by Country Figure 69: Europe Market Value Y-o-Y Growth Trend Analysis (2019 – 2032) by Country Figure 70: U.K. Market Absolute $ Opportunity (US$ Mn), 2017 – 2032 Figure 71: Germany Market Absolute $ Opportunity (US$ Mn), 2017 – 2032 Figure 72: France Market Absolute $ Opportunity (US$ Mn), 2017 – 2032 Figure 73: Italy Market Absolute $ Opportunity (US$ Mn), 2017 – 2032 Figure 74: Spain Market Absolute $ Opportunity (US$ Mn), 2017 – 2032 Figure 75: BENELUX Market Absolute $ Opportunity (US$ Mn), 2017 – 2032 Figure 76: Russia Market Absolute $ Opportunity (US$ Mn), 2017 – 2032 Figure 77: Rest of Europe Market Absolute $ Opportunity (US$ Mn), 2017 – 2032 Figure 78: Europe Market Attractiveness by Country Figure 79: East Asia Market Value (US$ Mn), 2017-2021 Figure 80: East Asia Market Value (US$ Mn), 2022-2032 Figure 81: East Asia Market Value Share Analysis (2022 – 2032) by Type Figure 82: East Asia Market Value Y-o-Y Growth Trend Analysis (2019 – 2032) by Type Figure 83: East Asia Market Attractiveness by Type Figure 84: East Asia Market Value Share Analysis (2022 – 2032) by Platform Figure 85: East Asia Market Value Y-o-Y Growth Trend Analysis (2019 – 2032) by Platform Figure 86: East Asia Market Attractiveness by Platform Figure 87: East Asia Market Value Share Analysis (2022 – 2032) by End Use Figure 88: East Asia Market Value Y-o-Y Growth Trend Analysis (2019 – 2032) by End Use Figure 89: East Asia Market Attractiveness by End Use Figure 90: East Asia Market Value Share Analysis (2022 – 2032) by Country Figure 91: East Asia Market Value Y-o-Y Growth Trend Analysis (2019 – 2032) by Country Figure 92: China Market Absolute $ Opportunity (US$ Mn), 2017 – 2032 Figure 93: Japan Market Absolute $ Opportunity (US$ Mn), 2017 – 2032 Figure 94: Spain Market Absolute $ Opportunity (US$ Mn), 2017 – 2032 Figure 95: East Asia Market Attractiveness by Country Figure 96: South Asia & Pacific Market Value (US$ Mn), 2017-2021 Figure 97: South Asia & Pacific Market Value (US$ Mn), 2022-2032 Figure 98: South Asia & Pacific Market Value Share Analysis (2022 – 2032) by Type Figure 99: South Asia & Pacific Market Value Y-o-Y Growth Trend Analysis (2019 – 2032) by Type Figure 100: South Asia & Pacific Market Attractiveness by Type Figure 101: South Asia & Pacific Market Value Share Analysis (2022 – 2032) by Platform Figure 102: South Asia & Pacific Market Value Y-o-Y Growth Trend Analysis (2019 – 2032) by Platform Figure 103: South Asia & Pacific Market Attractiveness by Platform Figure 104: South Asia & Pacific Market Value Share Analysis (2022 – 2032) by End Use Figure 105: South Asia & Pacific Market Value Y-o-Y Growth Trend Analysis (2019 – 2032) by End Use Figure 106: South Asia & Pacific Market Attractiveness by End Use Figure 107: South Asia & Pacific Market Value Share Analysis (2022 – 2032) by Country Figure 108: South Asia & Pacific Market Value Y-o-Y Growth Trend Analysis (2019 – 2032) by Country Figure 109: India Market Absolute $ Opportunity (US$ Mn), 2017 – 2032 Figure 110: Thailand Market Absolute $ Opportunity (US$ Mn), 2017 – 2032 Figure 111: Indonesia Market Absolute $ Opportunity (US$ Mn), 2017 – 2032 Figure 112: Malaysia Market Absolute $ Opportunity (US$ Mn), 2017 – 2032 Figure 113: Australia & New Zealand Market Absolute $ Opportunity (US$ Mn), 2017 – 2032 Figure 114: Rest of South Asia & Pacific Market Absolute $ Opportunity (US$ Mn), 2017 – 2032 Figure 115: South Asia & Pacific Market Attractiveness by Country Figure 116: Middle East & Africa Market Value (US$ Mn), 2017-2021 Figure 117: Middle East & Africa Market Value (US$ Mn), 2022-2032 Figure 118: Middle East & Africa Market Value Share Analysis (2022 – 2032) by Type Figure 119: Middle East & Africa Market Value Y-o-Y Growth Trend Analysis (2019 – 2032) by Type Figure 120: Middle East & Africa Market Attractiveness by Type Figure 121: Middle East & Africa Market Value Share Analysis (2022 – 2032) by Platform Figure 122: Middle East & Africa Market Value Y-o-Y Growth Trend Analysis (2019 – 2032) by Platform Figure 123: Middle East & Africa Market Attractiveness by Platform Figure 124: Middle East & Africa Market Value Share Analysis (2022 – 2032) by End Use Figure 125: Middle East & Africa Market Value Y-o-Y Growth Trend Analysis (2019 – 2032) by End Use Figure 126: Middle East & Africa Market Attractiveness by End Use Figure 127: Middle East & Africa Market Value Share Analysis (2022 – 2032) by Country Figure 128: Middle East & Africa Market Value Y-o-Y Growth Trend Analysis (2019 – 2032) by Country Figure 129: GCC Countries Market Absolute $ Opportunity (US$ Mn), 2017 – 2032 Figure 130: Turkey Market Absolute $ Opportunity (US$ Mn), 2017 – 2032 Figure 131: South Africa Market Absolute $ Opportunity (US$ Mn), 2017 – 2032 Figure 132: Middle East & Africa Market Attractiveness by Country
Need specific information?
Request CustomizationExplore Technology Insights
View Reports