This site uses cookies, including third-party cookies, that help us to provide and improve our services.

Privacy Policy
- Global Locations -
Headquarters
Future Market Insights, Inc.
Christiana Corporate, 200 Continental Drive, Suite 401, Newark, Delaware - 19713, United States
T: +1-845-579-5705
MEA
Market Access DMCC

1602-6 Jumeirah Bay X2 Tower, Plot No: JLT-PH2-X2A,

Jumeirah Lakes Towers, Dubai,

United Arab Emirates

Americas
Future Market Insights
616 Corporate Way, Suite 2-9018,
Valley Cottage, NY 10989,
United States
T: +1-347-918-3531
Europe
Future Market Insights
3rd Floor, 207 Regent Street,
London W1B 3HH
United Kingdom
T: + 44 (0) 20 8123 9659
D: +44 (0) 20 3287 4268
APAC
Future Market Insights
Office No. 401-A, 4th Floor,
VANTAGE 9, S.No. 36/1/1,
Baner, Pune 411045 India

OTT Content Market

Get to Know the Adoption Scenario of OTT Content Services in Key Countries, including US, UK, Japan, Benelux, France, and more

OTT Content Market by Content Type, Access Type, Revenue Model & Region | Forecast 2022 to 2032

OTT Content Market Outlook

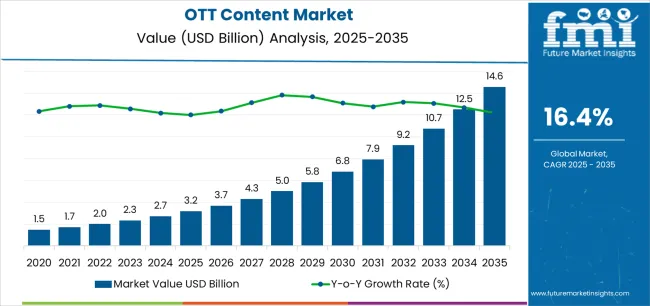
[333 Pages Report] A CAGR of 17.4% is expected of the global OTT content market, due to the growing demand during the forecast period. It is anticipated to be appraised at US$ 434.98 Bn by 2032, up from US$ 87.46 Bn in 2022. The growth in the market is ascribed to the following:

  • The OTT content market growth is predicted to be propelled owing to a rise in penetration and demand for subscription-based services in emerging markets.
  • Live streaming channels are surging in demand, along with an expansion of the variety of content available, which further increases the adoption of OTT services.
  • Social media platforms and applications have established their presence with widespread acceptance amongst consumers and their high-quality offerings, surging the demand for OTT content.
  • Freemium models' availability in price-sensitive markets will likely drive the demand for these services. Moreover, the SVOD services increase is expected to surge market growth.
  • Rising penetration of high-speed internet and smartphones at competitive prices are further expected to drive service demand, along with the gradual shift from conventional television to SVOD.
  • The adoption of OTT content is expected to rise owing to the increasing reservation of original content for own platforms by rights holder providers, such as Disney+, HBO, etc.

Report Attribute

Details

OTT Content Market Value (2022)

US$ 87.46 Bn

OTT Content Market Anticipated Value (2032)

US$ 434.98 Bn

OTT Content Projected Growth Rate (2032)

17.4%

Customize this Report

Let us know your requirement to get
100% FREE customization

Global Trends & Scopes Revolutionizing the OTT Content Market

‘Media Acceleration’ provides extensive market opportunities.

Key providers are announcing the availability of media acceleration, designed to improve viewing experiences for over-the-top (OTT) video consumers and accelerate video game and other software downloads. This marks a major milestone in most key providers’ content delivery capabilities in moving to a consumer-centric approach to online video and software distribution. Technology is integrated directly into consumer applications to optimize the experience for each end user.

To deliver video ideally suited for device capabilities, network type and conditions of specific end users, OTT operators can use this technology to take advantage of more efficient communication between consumer devices and the key companies’ networks.

Media Acceleration can help OTT operators provide a consistently high and predictable quality of experience to which consumers are accustomed to traditional broadcast by overcoming many fundamental challenges of online video delivery. Moreover, media acceleration can be leveraged to improve the performance of video game delivery and other software download use cases by video game publishers and software providers. These factors are expected to boost the demand for OTT content.

Cloud-based Solutions help improve API performance for content owners

Most key companies exhibit their complete range of cloud-based solutions designed to help content owners deliver their audiences the best possible online video viewing experiences. They strive to aid their end users in attracting customers with fast, engaging app and API performance enhanced by robust data and automation. Furthermore, they offer DataStream that helps to get an inside look at the CDN performance with a log data scale.

They also offer global traffic management, which helps to optimize app performances and avoid outages with intelligent load balancing. In addition, key players provide mPulse to capture user experience data, optimize website performance, and measure ROI. Hence, the adoption of OTT content is likely to rise.

Sudip Saha
Sudip Saha
Principal Consultant
LinkedIn
Talk to Analyst

Find your sweet spots for generating winning opportunities in this market.

Talk to Analyst

Engaging company-specific ads offered by subscription-streaming services

Certain major key players offer to produce commercials that allow advertisers to reach and connect to unique audiences at scale. With their facilities, advertisers can reach over 120MM unduplicated viewers of streaming TV content when they advertise with company-specific ads. They help end users connect with their audiences that are becoming harder to reach with linear TV.

Additionally, these ads can reach audiences with both in-stream and out-stream video ads on different key company-affiliated sites, for instance, IMDb.com and Discord. Likewise, it reaches audiences across the web on leading publishers’ sites through the key company’s publisher services and third-party exchanges. Campaigns organized by these key players use both online video and display ads. They are estimated to observe an average 320% increase in detail page views and a 150% increase in purchase rate compared to display-only efforts.

This is also because effective streaming TV advertising campaigns leverage audience insights and audience segments. For instance, ads provided by key players enable brands to engage audiences based on billions of first-party insights, which have been shown to help brands achieve a 44% increase in consideration compared to using demographic attributes alone. All these aspects provided by various key providers are anticipated to expand the global OTT content market size.

Owing to the proliferation in demand for streaming video services (offering diverse content), the OTT content market trends have witnessed the introduction of a few third-party mobile applications providing innovative OTT content (VoD) features. Furthermore, the adoption of SVOD services offered by OTT platforms is increasing owing to the availability of original premium content for access to users.

Mobile apps, such as Meerkat, offer OTT services, enabling users to broadcast live video streams via an iPhone through their Twitter accounts. Additionally, OTT apps also provide the functionalities that a broadcast channel provides to its customers and offer messaging services. These factors are likely to be the root causes of the high adoption rate of OTT content.

Presence of large creators for animation content in the U.S

North America is the largest OTT content market which is attributed to the U.S. being amongst the highest spenders on animated content creation across the globe. The presence of The Fox Broadcasting Company, one of the largest creators of animation content for prime-time television, also is one of the major factors encouraging animation content creation.

A lot of momentum in the United States is being obtained by new services such as AT&T, ESPN, Turner Sports, and Crown Family Media Networks, which is expected to fuel the global OTT content market growth. Furthermore, with the average home viewing value estimated at 86 hours of OTT content in a month, 64 Mn homes are accustomed to OTT in the United States.

Leading animation content providers are signing distribution deals with US-based OTT platforms to capitalize on the increasing popularity of animation content. Moreover, there have been increasing investments in content acquisition towards the ‘OTT for sports’ domain (owing to its growing popularity) which highlights how numerous companies are entering the OTT space.

Additionally, the demand for OTT content is likely to surge, with nearly 66% of these contents reaching homes with Wi-Fi, with OTT content genres primarily related to sports, education, and entertainment witnessing increasing advancements. In addition, the U.S. media industry has been on edge, diversifying more of its content offerings across its direct-to-consumer (DTC) channels, with a rapid mix of linear and OTT providers. For instance, ESPN+ and Hulu sought after Disney.

MarketNage
Become a MarketNgage Insider

A unified Market Research Subscription Platform, built for today's disparate research needs.

How Free TV shapes the TV viewing landscape of Germany

Europe is the second leading OTT content market with a notable revenue. This is attributed to international players bringing popular movies and TV shows to the European market. In this region, Germany is the toughest market to break into as the country has the largest and best-funded public broadcasting system in the world. This is expected to propel the adoption of OTT content in this region.

“Free TV” is still a dominant business model in this country. Moreover, the personal patterns of Germans are likely to remain static, and the market has been dominated by free-to-air TV viewing. In addition, over 100 German-generated channels are expected to occupy the viewers’ time budget for the next 3 to 5 years, according to industry insiders.

Germans further allegedly pay a per-household flat fee of €17.98 per month for all electronic devices, known as the Rundfunkbeitrag or “broadcast distribution,” which includes low-income families and students, as stated according to a Guardian report. This is estimated to bolster the demand for the service and the global OTT content market growth.

Germany is one of the largest public broadcasting budgets in the world, with annual revenue from license fees at approximately €7.6 Bn and an additional €500 Mn raised from commercials.

Exploring how animated content increasingly penetrates Japan more than any other country

The Asia Pacific is a growing OTT market and is expected to achieve exponential growth throughout the forecast period. This is owing to the high demand for subscription-video-on-demand (SVOD) platforms like Netflix and Amazon Prime Video.

In Japan, the major SVOD platforms compete for viewers with a host of local content providers, especially by having a regional focus on anime and manga. Moreover, with 202 Mn cellular connections shared by a population of just under 126 Mn, mobile phone penetration in the country is almost at the saturation point. This effectuates the viewing of SVOD content on multiple large and small screen devices, including smartphones. Hence, the proliferation of smart devices surges the adoption of OTT content.

Free-to-air broadcasting is the dominant form of distribution, whereas Cable & Satellite have less than 20% of uptake in the market. This is led by 4 dominant commercial channels (TBS, NTV, FujiTV, TV Asahi) akin to ITV/Channel 4, one smaller channel (TV Tokyo) like Channel 5 and a strong ad-free PSB (NHK) similar in model to BBC.

In 2019, the ensuing success of “Tver” to circa 10 Mn MAUs, accelerated confidence and better communication between broadcasters, with over 13 now having joined the platform to provide a wealth of premium catch-up content. Furthermore, the popularity of anime helps explain the success of animation more generally in Japan. However, animated comedy also ranks more highly in this country than in any other market, as the Japanese audience longs for animation beyond just the anime subgenre.

OTT content

YouTube is the most favored platform to watch videos and other streaming services owing to a government survey that showed that two out of every three Koreans had secured the adoption of OTT content.

With 32.1% of the respondents saying that their viewing time increased during the pandemic, stay-at-home practices are estimated to increase in broadcast and video streaming viewership. Moreover, Korean dramas, K-pop music and other Korean content have benefitted from growing popularity, not just in South Korea but also globally. This is owing to the second stage of the Korean wave or “Hallyu.”

The Korean film market was estimated to be US$ 2.2 Bn reporting over 226 Mn moviegoers, surpassing the 200 Mn mark for the 8th year in a row, as stated according to the Korea Film Council in 2019. Additionally, there are growing examples of films that are bypassing the cinema and being released directly through VOD/OTT platforms and making a profit as Korea welcomes more diverse filmmakers, importers, and distributors into the film market. These factors are likely to contribute to the expansion of the global OTT content market size.

A Contrast with the Historical Market Scenario

The statistics garnered by Future Market Insights unveil the global context of OTT content which has witnessed an outstanding boost over the past few years. The manufacturers in the market are in synchrony with the bolstering demand for OTT content. There has been a steady rise from a CAGR of 15.8% registered from 2015 to 2021, and it is likely to expand at a gradual 17.4% in the forecast period.

The substantial growth in the market size can be greatly attributed to easy access to a high-fidelity data network. Consistent speed enables a buffer-free user experience. Moreover, demand for high-speed broadband has increased over the years owing to the adoption of smartphones and other smart devices in the last decade across the globe, which is further expected to contribute to market growth.

Players are continuously upgrading their product portfolios to meet the increasing service demand in the competitive global OTT content market. For instance, they have considered the emergence of live streaming and Virtual Reality (VR) technology as great market opportunities. In addition, the impact of government regulations is moderate, and demand for regional content on OTT platforms is comparatively high. However, the main strategy of distributors has been to source content from different OTT players, while new players are partnering with telecom providers and outsourcing OTT content. These factors are anticipated to spark the creativity of key providers for the OTT content market trends.

Comparative Analysis of Adjacent Markets

OTT Content Market:

Attributes

OTT Content Market

CAGR

(2022-2032)

17.4%

Market Value

(2032)

US$ 434.98 Bn

Growth Factor

Proliferation of high-speed bandwidth, along with growing penetration of 5G infrastructure, original media content, and others.

Opportunity

The increasing popularity of video games and animation content on gaming platforms are to provide lucrative opportunities.

Restraints

The improbability of supplying high-speed broadband in remote areas of developing countries because of low penetration of internet.

Family/Indoor Entertainment Centres Market:

Attributes

Family/Indoor Entertainment Centres Market

CAGR

(2022-2032)

13.3%

Market Value

(2032)

US$ 113.89 Bn

Growth Factor

Loyalty programs, as well as new technologies such as the implementation augmented reality (AR), virtual reality (VR), and 3D technology.

Opportunity

New technologically advanced games with 3D projection mapping and interactive digital surfaces are anticipated to be produced by manufacturers who are working on mixing AR and VR technology.

Restraints

Establishing new setups for entertainment has a high capital expenditure. Moreover, attracting visitors on consistently is a problem as these centres cannot make changes in offerings immediately.

Video on Demand (VOD) Service Market:

Attributes

Video on Demand (VOD) Service Market

CAGR

(2022-2032)

17.6%

Market Value

(2032)

US$ 216.3 Bn

Growth Factor

Growing number of mobile data subscriptions, increased usage of high speed data networks, and emergence of advanced functional capabilities in smartphones and tablets.

Opportunity

The implementation of artificial intelligence (AI) and machine learning, along with other new and cutting-edge ways to provide high-quality entertainment to movie and TV viewers.

Restraints

Complicated government regulations, and lengthy licensing requirements. Moreover, increasing content piracy are major hindrances.

Category-wise Insights

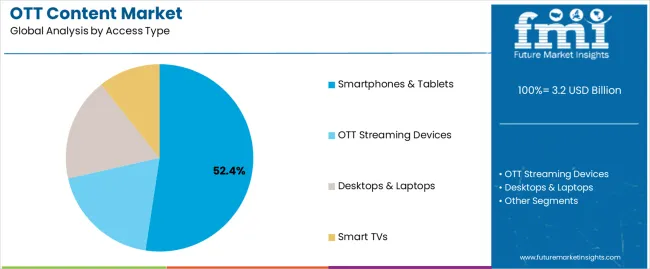
  • Smartphones & Tablets - By Access Type

By access type, the market is segmented into OTT streaming devices, desktops & laptops, smartphones & tablets and smart TVs. According to research conducted by the analysts at Future Market Insights, it was concluded that the smartphones & tablets segment is estimated to hold a major market share, recording a CAGR of 40% in 2022.

The vital aspects determining the momentum of this segment are:

  • Increasing smartphone penetration in various markets globally, owing to optimal pricing 4G and 5G-enabled phones, along with the First World shifting towards advanced telecommunications technologies.
  • Mobile subscriptions and use of mobile-connected devices are also increasing and is likely to drive market growth. Moreover, these smart devices are quickly becoming the preferred mode of communication and information consumption across the globe.
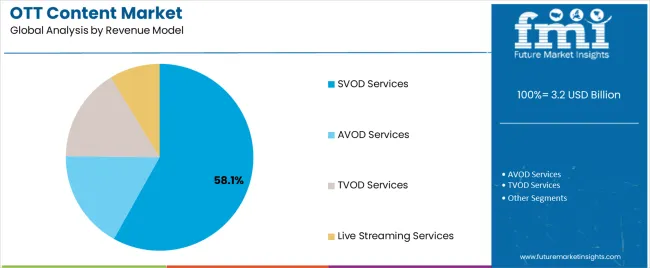
  • SVOD (Subscription-based Video on Demand) Services - By Revenue Model Type

There has been a rapid adoption of OTT content and related services as attractive and feasible, in lieu of traditional entertainment channels. The increasing preference for OTT channel contents can be attributed to their affordability compared to conventional TV subscriptions, along with an expansion of content libraries.

The pivotal elements determining the momentum of this segment are:

  • SVOD services are being provided by top subscription streaming services such as Netflix, Hulu, and Amazon, owing to their inexpensive pricing structure.
  • Subscribers stream and share interesting videos, audio, and worldwide news to a huge group of many other users with high increasing deployment.
  • In addition to providing messaging services, certain OTT applications further provide the same capabilities that a broadcast channel delivers to its subscribers.

New and Advanced Features of Smartphones & Other Aspects

There has been an increase in the demand for usage of applications such as Google Hangouts, FaceTime by Apple, WhatsApp, and other social media platforms in the past year. These platforms are providing user-friendly interface, attractive and innovative audio & video messaging services to the viewers. This is likely to bolster the adoption of OTT content.

New and advanced features in smartphones are becoming increasingly available. In order to cater to rising demand from consumers for a personalized experience, smartphone manufacturers are introducing novel and advanced features in smartphones. This factor is expected to foster the market growth.

Modern consumers are progressively consuming a vast volume of videos, audio files, and data due to changing lifestyle. Moreover, customized content is rising in demand as it offers users the flexibility to view varied content. This is estimated to a significant adoption of these services, and palpably lead to the global OTT content market growth.

Low Bandwidth & Other Obstructions

As engaging and absorbing OTT services are, the inability to supply high-speed internet is expected to obstruct the market growth in terms of value sales, as high-speed broadband is required to watch content on OTT platforms. The low penetration of internet in developing economies such as in Middle Eastern and African countries may make the option of OTT services impossible. Furthermore, the presence of stringent government regulations and policies, is predicted to hinder the market share.

Low bandwidth can result in a decline in download speeds and longer time for streaming videos. In addition, online piracy is one of the common issues faced by OTT content providers, especially in developing countries, since these OTT content providers generate large volumes of traffic through live streaming programs of TV channels. This is likely to act as major restraints for the global OTT content market growth. Furthermore, lack of original content and high prices demanded by certain subscription streaming services may further hamper the market.

Commoditization of Sporting Services & Other Revenue Opportunities

High growth of mobile messaging and value-added services (VAS) owing to mobile broadband, is expected to boost mobile data revenues in the near future. This is anticipated to create potential opportunities for OTT providers, especially in regional markets where mobile broadband penetration is low. Furthermore, more creative and flexible options for users to pay for and consume data usage may be profitable for the market.

Due to the rising complexity related to managing and maintaining content, several organizations are widely employing cloud-based solutions for implementing the central repository. Moreover, the increasing demand for smart TVs is estimated to offer immense opportunities for key players which is anticipated to generate market growth. The OTT content market share is also expected to garner growth owing to the ongoing shift towards commoditization of sporting and entertainment services.

Region-Wise Analysis

Presence of large creators for animation content in the U.S.

North America is the largest OTT content market which is attributed to the U.S. being amongst the highest spenders on animated content creation across the globe.

  • The presence of The Fox Broadcasting Company, one of the largest creators of animation content for prime time television, which also is one of the major factors encouraging animation content creation.
  • A lot of momentum in the United States are being obtained by new services such as AT&T, ESPN, Turner Sports, and Crown Family Media Networks, which is expected to fuel the global OTT content market growth.
  • With the average home viewing value estimated at 86 hours of OTT content in a month, 64 Mn homes are accustomed to OTT, in the United States.
  • Leading animation content providers are signing distribution deals with US-based OTT platforms, to capitalize on the increasing popularity of animation content.
  • There has been increasing investments in content acquisition towards the ‘OTT for sports’ domain (owing to its growing popularity) which highlights how numerous companies are entering the OTT space.
  • Additionally, nearly 66% reach homes with Wi-Fi, with OTT content genres primarily related to sports, education, and entertainment witnessing increasing advancements.
  • The U.S. media industry has been on the edge diversifying more of its content offerings across its direct-to-consumer (DTC) channels, with a rapid mix of linear and OTT providers. For instance, ESPN+ and Hulu were sought after Disney.

Rules pertaining to content on video streaming platforms in China

The Asia Pacific is a growing OTT content market and is expected to achieve exponential growth throughout the forecast period.

  • China is likely to dominate the region, due to the rapidly cannibalized pay-TV segment.
  • The Chinese government imposing rules governing content on video streaming platforms, as well as growing use of mobile devices, are facilitating the rapid uptake of OTT services.
  • The OTT market in China is anticipated to increase at a substantial rate as telecom providers integrate OTT services into their internet services.
  • Streaming services market in China is expected to experience growth owing to continuous advances in internet services.

Significant growth of OTT platforms in India

India is prepared to witness a phenomenal rise of OTT platforms and provide enormous potential for the Asia Pacific region.

  • The media and entertainment sector in India comprises of multiple segments such as television, print media, radio and movies and the elemental segment in the industry, in recent times, has evidently been the OTT content market share.
  • OTT services have been evolving at a much higher pace than previously estimated, driven by the rapid digital adoption.
  • Consumer eyeballs have further glued to their digital screens, leading to increased diversity in content, owing to the introduction of multiple players in the sector catering to different niche segments.
  • The OTT entertainment is not only opening several avenues for the Indian entertainment sector, but has also facilitated the Indian audience’s migration away from the conventional entertainment consumption formats.

New Entrants are Catching Up with Top Market Players with Innovative Solutions: Start-Up Economy

As the proliferation of high bandwidth increases across the globe, start-up companies of the OTT content market share, along with key players, are coming up with innovative strategies to make sporting, informational, entertaining, etc. content available for consumers across the globe, by adopting advanced technologies and studying the achievements of key subscription streaming service providers:

  • Pluto TV - It is an ad-supported virtual MVPD platform. It allows users to stream TV and movies. Provides live and on-demand VOD content under various categories including music videos, news reports, action sports, video game commentary, and more. Supports various devices such as Apple TV, Android TV, Amazon Fire TV, Chromecast, Roku, and PlayStation consoles. The mobile app is available for Android and iOS devices. Generates revenue through video advertisements between programming.
  • FuboTV - It is a provider of a subscription-based video platform for football fans. It offers a cloud-based video platform providing a TV streaming platform for soccer, live cable sports channels, live soccer games, documentaries, and club channels. The platform can be accessed through Internet-connected TVs, smartphones, game consoles, and set-top boxes. It also integrates fan view into its multi-view feature for iOS TV. It generates revenue through subscriptions.
  • Loco - It is an online platform for live streaming video games. The platform allows users to play and live stream games like Free Fire, CODM, PUBG, Valorant, GTA V, and more. The app is available for Android users. It monetizes through in-app ads and purchases.
  • Cheddar - It is an online video news platform focused on business news. It covers news on innovative product service offerings from media, technology, and consumer companies. It has partnered with VHX to distribute content. It generates revenue through product placements in fashion, food, and technology.
  • iflix - It is a Malaysian subscription-based video-on-demand platform. The company claims to focus on first-run local movies and original programming and offers content spanning multiple categories like movies, TV shows, drama, kids entertainment, among others.
  • M2AMedia - It is a UK-based start-up that simplifies live video streaming. The start-up’s product, M2A Connect, transitions live video workflows to public clouds. It enables the aggregation and distribution of live video streams in AWS. Besides, the startup’s other product, M2A Live, allows content providers to deliver low-latency, highly reliable live streams. These solutions enable broadcasters and OTT platforms to streamline their live streaming services across websites.
  • Conductor Technologies - It is a US-based start-up that optimizes content rendering. The startup’s platform uses cloud computing to replace the traditional render farm for media production. It integrates with visual effects (VFX), virtual reality (VR), augmented reality (AR), and animation pipelines to offload rendering workloads to the cloud. This facilitates studios and content creators to leverage time-based rendering costs and provide content access to unlimited customers.
  • TV2Z - It is a Dutch start-up that provides a content management platform. It leverages cloud computing to build a video management directory. The platform allows users to upload video data from local storage to the right channels. It also allows them to control the content based on regions, like geo-blocking and allows customers to add localized metadata. This enables digital TV providers and OTT platforms to streamline video inventory management.

Top 5 Key Companies Revolutionizing the OTT Content Market Space

To increase their market reach, key companies in the OTT content market share, are providing OTT content by strategically cooperating with telecom providers, streaming partners, content suppliers, and others. They are essentially growing their businesses by partnering and collaborating with local service providers. Key market players are further focused on product innovation, as well as investing in the creation of new streaming platforms and services, to garner consumer attention.

TOP MARKET PLAYERS OF THE OTT CONTENT MARKET:

  • Amazon Prime Video - Also simply called Prime Video, it is an American subscription video on-demand over-the-top streaming and rental service of Amazon offered as a standalone service or as part of Amazon's Prime subscription.
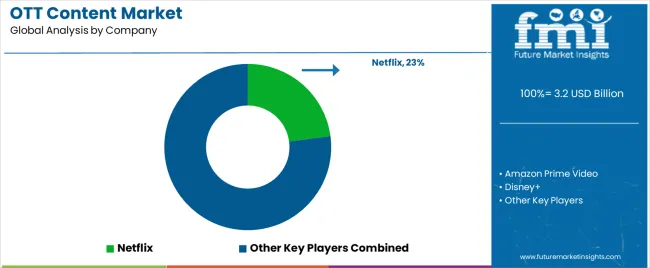
  • Netflix Inc. - It is an American subscription streaming service and production company based in Los Gatos, California. Founded in 1997 by Reed Hastings and Marc Randolph in Scotts Valley, California, it offers a film and television series library through distribution deals as well as its own productions, known as Netflix Originals.
  • Hulu LLC - It is an American subscription streaming service majority-owned by The Walt Disney Company, with Comcast’s NBCUniversal holding a minority stake. It was launched on October 2007, and it offers a library of films and television series like 20th Century Studios, Searchlight Pictures, Disney Television Studios, ABC, Freeform, and FX Networks among others, as well as Hulu original programming.
  • Twitch - It is an American video live streaming service that focuses on video game live streaming, including broadcasts of esports competitions, in addition to offering music broadcasts, creative content, and "in real life" streams. It is operated by Twitch Interactive, a subsidiary of Amazon.com, Inc.
  • Akamai Technologies Inc. - It is an American content delivery network, cybersecurity, and cloud service company, providing web and Internet security services. Akamai's Intelligent Edge Platform is one of the world's largest distributed computing platforms.

OTHER MARKET PARTICPANTS OF OTT CONTENT MARKET

  • Disney+ Hotstar
  • Apple Inc.
  • Brightcove Inc.
  • Google Inc.
  • Limelight Networks Inc.
  • Roku Inc.
  • Tencent Holdings Ltd.
  • Alphabet Inc.
  • Comcast Corp.
  • Sirius XM Holdings Inc.
  • Spotify Technology SA
  • The Walt Disney Co.

Recent advancements in the OTT content market are:

  • In May 2019, Airtel, a telecommunications services company based in India, announced to offer free subscription to Amazon Prime and Netflix for both mobile & broadband customers.
  • In September 2019, Apple Inc. launched Apple TV+, an original video subscription service.
  • In September 2019, Microsoft Corporation collaborated with Eros Now, where Eros Now will use Microsoft’s cloud platform Azure to build new features.
  • In March 2020, AT&T TV launched its OTT service with add-ons such as the on-demand library, live channels, and five hundred hours of cloud storage, among others, to expand its international reach.
  • In May 2021, Amazon, Inc. launched miniTV, which is a free video streaming application with an aim to move towards masscustomer acquisition, with numerous services reminiscent of e-commerce, food delivery, payment, and others.
  • In December 2021, Netflix slashed its SVOD subscription price by 60% in India. The mobile-only plan was reduced to USD 1.96 per month from USD2.62, 2 dollars decreased the standard plan to USD 6.58 per month, and the premium plan was reduced to USD 8.55 from USD 10.59 per month.
  • In May 2022, Sony Sports Network announced that Roland-Garros 2022, the second grand slam event of the year, will be aired in four regional languages for live broadcast in India. The tournament can be streamed on Sony Sports Network’s on-demand OTT platform SonyLIV.
  • In September 2022, Medianova and streaming platform Jet-Stream announced a partnership to provide Medianova’s CDN service within Jet-Stream’s service. Jet-Stream Airflow Multi CDN is integrated into Jet-Stream Cloud services with the partnership.

Key Segments Profiled in the OTT Content Market Survey

By Content Type:

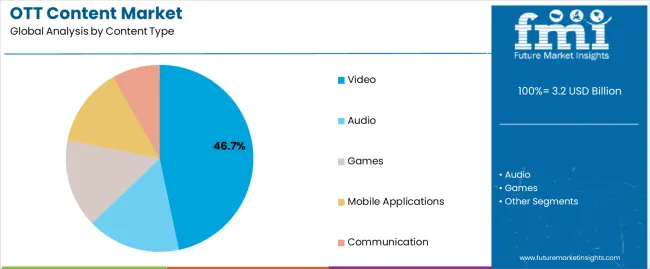
  • Video
  • Audio
  • Games
  • Mobile Applications
  • Communication

By Access Type:

  • OTT Streaming Devices
  • Desktops & Laptops
  • Smartphones & Tablets
  • Smart TVs

By Revenue Model:

  • SVOD Services
  • AVOD Services
  • TVOD Services
  • Live Streaming Services

By Region:

  • North America
  • Latin America
  • Asia Pacific
  • MEA
  • Europe

Frequently Asked Questions

The OTT content market is anticipated to accumulate a CAGR of 17.4% during the forecast period.

Low bandwidth can result in a decline in download speeds and longer time for streaming videos.

By 2032, the market is likely to grow to a revenue of US$ 434.98 Bn.

Table of Content

1. Executive Summary

    1.1. Global Market Outlook

    1.2. Demand-side Trends

    1.3. Supply-side Trends

    1.4. Technology Roadmap Analysis

    1.5. Analysis and Recommendations

2. Market Overview

    2.1. Market Coverage / Taxonomy

    2.2. Market Definition / Scope / Limitations

3. Market Background

    3.1. Market Dynamics

        3.1.1. Drivers

        3.1.2. Restraints

        3.1.3. Opportunity

        3.1.4. Trends

    3.2. Scenario Forecast

        3.2.1. Demand in Optimistic Scenario

        3.2.2. Demand in Likely Scenario

        3.2.3. Demand in Conservative Scenario

    3.3. Opportunity Map Analysis

    3.4. Investment Feasibility Matrix

    3.5. PESTLE and Porter’s Analysis

    3.6. Regulatory Landscape

        3.6.1. By Key Regions

        3.6.2. By Key Countries

    3.7. Regional Parent Market Outlook

4. Global Market Analysis 2017-2021 and Forecast, 2022-2032

    4.1. Historical Market Size Value (US$ Mn) Analysis, 2017-2021

    4.2. Current and Future Market Size Value (US$ Mn) Projections, 2022-2032

        4.2.1. Y-o-Y Growth Trend Analysis

        4.2.2. Absolute $ Opportunity Analysis

5. Global Market Analysis 2017-2021 and Forecast 2022-2032, By Content Type

    5.1. Introduction / Key Findings

    5.2. Historical Market Size Value (US$ Mn) Analysis By Content Type, 2017-2021

    5.3. Current and Future Market Size Value (US$ Mn) Analysis and Forecast By Content Type, 2022-2032

        5.3.1. OTT Video Content

            5.3.1.1. Entertainment & Infotainment

            5.3.1.2. Food, Travel & Fashion

            5.3.1.3. Gaming & Sports

        5.3.2. OTT Audio Content

        5.3.3. OTT Games Content

        5.3.4. OTT Mobile Applications Content

        5.3.5. OTT Communication Content

    5.4. Y-o-Y Growth Trend Analysis By Content Type, 2017-2021

    5.5. Absolute $ Opportunity Analysis By Content Type, 2022-2032

6. Global Market Analysis 2017-2021 and Forecast 2022-2032, By Access Type

    6.1. Introduction / Key Findings

    6.2. Historical Market Size Value (US$ Mn) Analysis By Access Type, 2017-2021

    6.3. Current and Future Market Size Value (US$ Mn) Analysis and Forecast By Access Type, 2022-2032

        6.3.1. Desktops & Laptops

        6.3.2. Smartphones & Tablets

        6.3.3. Smart TVs

        6.3.4. Others

    6.4. Y-o-Y Growth Trend Analysis By Access Type, 2017-2021

    6.5. Absolute $ Opportunity Analysis By Access Type, 2022-2032

7. Global Market Analysis 2017-2021 and Forecast 2022-2032, By Revenue Model

    7.1. Introduction / Key Findings

    7.2. Historical Market Size Value (US$ Mn) Analysis By Revenue Model , 2017-2021

    7.3. Current and Future Market Size Value (US$ Mn) Analysis and Forecast By Revenue Model , 2022-2032

        7.3.1. SVOD Services

        7.3.2. AVOD Services

        7.3.3. TVOD Services

        7.3.4. Live Streaming Services

        7.3.5. Others

    7.4. Y-o-Y Growth Trend Analysis By Revenue Model , 2017-2021

    7.5. Absolute $ Opportunity Analysis By Revenue Model , 2022-2032

8. Global Market Analysis 2017-2021 and Forecast 2022-2032, By Region

    8.1. Introduction

    8.2. Historical Market Size Value (US$ Mn) Analysis By Region, 2017-2021

    8.3. Current Market Size Value (US$ Mn) Analysis and Forecast By Region, 2022-2032

        8.3.1. North America

        8.3.2. Latin America

        8.3.3. Europe

        8.3.4. South Asia & Pacific

        8.3.5. East Asia

        8.3.6. MEA

    8.4. Market Attractiveness Analysis By Region

9. North America Market Analysis 2017-2021 and Forecast 2022-2032, By Country

    9.1. Historical Market Size Value (US$ Mn) Trend Analysis By Market Taxonomy, 2017-2021

    9.2. Market Size Value (US$ Mn) Forecast By Market Taxonomy, 2022-2032

        9.2.1. By Country

            9.2.1.1. U.S.

            9.2.1.2. Canada

        9.2.2. By Content Type

        9.2.3. By Access Type

        9.2.4. By Revenue Model

    9.3. Market Attractiveness Analysis

        9.3.1. By Country

        9.3.2. By Content Type

        9.3.3. By Access Type

        9.3.4. By Revenue Model

    9.4. Key Takeaways

10. Latin America Market Analysis 2017-2021 and Forecast 2022-2032, By Country

    10.1. Historical Market Size Value (US$ Mn) Trend Analysis By Market Taxonomy, 2017-2021

    10.2. Market Size Value (US$ Mn) Forecast By Market Taxonomy, 2022-2032

        10.2.1. By Country

            10.2.1.1. Brazil

            10.2.1.2. Mexico

            10.2.1.3. Rest of Latin America

        10.2.2. By Content Type

        10.2.3. By Access Type

        10.2.4. By Revenue Model

    10.3. Market Attractiveness Analysis

        10.3.1. By Country

        10.3.2. By Content Type

        10.3.3. By Access Type

        10.3.4. By Revenue Model

    10.4. Key Takeaways

11. Europe Market Analysis 2017-2021 and Forecast 2022-2032, By Country

    11.1. Historical Market Size Value (US$ Mn) Trend Analysis By Market Taxonomy, 2017-2021

    11.2. Market Size Value (US$ Mn) Forecast By Market Taxonomy, 2022-2032

        11.2.1. By Country

            11.2.1.1. Germany

            11.2.1.2. U.K.

            11.2.1.3. France

            11.2.1.4. Spain

            11.2.1.5. Italy

            11.2.1.6. Rest of Europe

        11.2.2. By Content Type

        11.2.3. By Access Type

        11.2.4. By Revenue Model

    11.3. Market Attractiveness Analysis

        11.3.1. By Country

        11.3.2. By Content Type

        11.3.3. By Access Type

        11.3.4. By Revenue Model

    11.4. Key Takeaways

12. South Asia & Pacific Market Analysis 2017-2021 and Forecast 2022-2032, By Country

    12.1. Historical Market Size Value (US$ Mn) Trend Analysis By Market Taxonomy, 2017-2021

    12.2. Market Size Value (US$ Mn) Forecast By Market Taxonomy, 2022-2032

        12.2.1. By Country

            12.2.1.1. India

            12.2.1.2. Malaysia

            12.2.1.3. Singapore

            12.2.1.4. Thailand

            12.2.1.5. Australia

            12.2.1.6. New Zealand

            12.2.1.7. Rest of South Asia & Pacific

        12.2.2. By Content Type

        12.2.3. By Access Type

        12.2.4. By Revenue Model

    12.3. Market Attractiveness Analysis

        12.3.1. By Country

        12.3.2. By Content Type

        12.3.3. By Access Type

        12.3.4. By Revenue Model

    12.4. Key Takeaways

13. East Asia Market Analysis 2017-2021 and Forecast 2022-2032, By Country

    13.1. Historical Market Size Value (US$ Mn) Trend Analysis By Market Taxonomy, 2017-2021

    13.2. Market Size Value (US$ Mn) Forecast By Market Taxonomy, 2022-2032

        13.2.1. By Country

            13.2.1.1. China

            13.2.1.2. Japan

            13.2.1.3. South Korea

        13.2.2. By Content Type

        13.2.3. By Access Type

        13.2.4. By Revenue Model

    13.3. Market Attractiveness Analysis

        13.3.1. By Country

        13.3.2. By Content Type

        13.3.3. By Access Type

        13.3.4. By Revenue Model

    13.4. Key Takeaways

14. MEA Market Analysis 2017-2021 and Forecast 2022-2032, By Country

    14.1. Historical Market Size Value (US$ Mn) Trend Analysis By Market Taxonomy, 2017-2021

    14.2. Market Size Value (US$ Mn) Forecast By Market Taxonomy, 2022-2032

        14.2.1. By Country

            14.2.1.1. GCC Countries

            14.2.1.2. South Africa

            14.2.1.3. Israel

            14.2.1.4. Rest of MEA

        14.2.2. By Content Type

        14.2.3. By Access Type

        14.2.4. By Revenue Model

    14.3. Market Attractiveness Analysis

        14.3.1. By Country

        14.3.2. By Content Type

        14.3.3. By Access Type

        14.3.4. By Revenue Model

    14.4. Key Takeaways

15. Key Countries Market Analysis

    15.1. U.S.

        15.1.1. Pricing Analysis

        15.1.2. Market Share Analysis, 2021

            15.1.2.1. By Content Type

            15.1.2.2. By Access Type

            15.1.2.3. By Revenue Model

    15.2. Canada

        15.2.1. Pricing Analysis

        15.2.2. Market Share Analysis, 2021

            15.2.2.1. By Content Type

            15.2.2.2. By Access Type

            15.2.2.3. By Revenue Model

    15.3. Brazil

        15.3.1. Pricing Analysis

        15.3.2. Market Share Analysis, 2021

            15.3.2.1. By Content Type

            15.3.2.2. By Access Type

            15.3.2.3. By Revenue Model

    15.4. Mexico

        15.4.1. Pricing Analysis

        15.4.2. Market Share Analysis, 2021

            15.4.2.1. By Content Type

            15.4.2.2. By Access Type

            15.4.2.3. By Revenue Model

    15.5. Germany

        15.5.1. Pricing Analysis

        15.5.2. Market Share Analysis, 2021

            15.5.2.1. By Content Type

            15.5.2.2. By Access Type

            15.5.2.3. By Revenue Model

    15.6. U.K.

        15.6.1. Pricing Analysis

        15.6.2. Market Share Analysis, 2021

            15.6.2.1. By Content Type

            15.6.2.2. By Access Type

            15.6.2.3. By Revenue Model

    15.7. France

        15.7.1. Pricing Analysis

        15.7.2. Market Share Analysis, 2021

            15.7.2.1. By Content Type

            15.7.2.2. By Access Type

            15.7.2.3. By Revenue Model

    15.8. Spain

        15.8.1. Pricing Analysis

        15.8.2. Market Share Analysis, 2021

            15.8.2.1. By Content Type

            15.8.2.2. By Access Type

            15.8.2.3. By Revenue Model

    15.9. Italy

        15.9.1. Pricing Analysis

        15.9.2. Market Share Analysis, 2021

            15.9.2.1. By Content Type

            15.9.2.2. By Access Type

            15.9.2.3. By Revenue Model

    15.10. India

        15.10.1. Pricing Analysis

        15.10.2. Market Share Analysis, 2021

            15.10.2.1. By Content Type

            15.10.2.2. By Access Type

            15.10.2.3. By Revenue Model

    15.11. Malaysia

        15.11.1. Pricing Analysis

        15.11.2. Market Share Analysis, 2021

            15.11.2.1. By Content Type

            15.11.2.2. By Access Type

            15.11.2.3. By Revenue Model

    15.12. Singapore

        15.12.1. Pricing Analysis

        15.12.2. Market Share Analysis, 2021

            15.12.2.1. By Content Type

            15.12.2.2. By Access Type

            15.12.2.3. By Revenue Model

    15.13. Thailand

        15.13.1. Pricing Analysis

        15.13.2. Market Share Analysis, 2021

            15.13.2.1. By Content Type

            15.13.2.2. By Access Type

            15.13.2.3. By Revenue Model

    15.14. China

        15.14.1. Pricing Analysis

        15.14.2. Market Share Analysis, 2021

            15.14.2.1. By Content Type

            15.14.2.2. By Access Type

            15.14.2.3. By Revenue Model

    15.15. Japan

        15.15.1. Pricing Analysis

        15.15.2. Market Share Analysis, 2021

            15.15.2.1. By Content Type

            15.15.2.2. By Access Type

            15.15.2.3. By Revenue Model

    15.16. South Korea

        15.16.1. Pricing Analysis

        15.16.2. Market Share Analysis, 2021

            15.16.2.1. By Content Type

            15.16.2.2. By Access Type

            15.16.2.3. By Revenue Model

    15.17. Australia

        15.17.1. Pricing Analysis

        15.17.2. Market Share Analysis, 2021

            15.17.2.1. By Content Type

            15.17.2.2. By Access Type

            15.17.2.3. By Revenue Model

    15.18. New Zealand

        15.18.1. Pricing Analysis

        15.18.2. Market Share Analysis, 2021

            15.18.2.1. By Content Type

            15.18.2.2. By Access Type

            15.18.2.3. By Revenue Model

    15.19. GCC Countries

        15.19.1. Pricing Analysis

        15.19.2. Market Share Analysis, 2021

            15.19.2.1. By Content Type

            15.19.2.2. By Access Type

            15.19.2.3. By Revenue Model

    15.20. South Africa

        15.20.1. Pricing Analysis

        15.20.2. Market Share Analysis, 2021

            15.20.2.1. By Content Type

            15.20.2.2. By Access Type

            15.20.2.3. By Revenue Model

    15.21. Israel

        15.21.1. Pricing Analysis

        15.21.2. Market Share Analysis, 2021

            15.21.2.1. By Content Type

            15.21.2.2. By Access Type

            15.21.2.3. By Revenue Model

16. Market Structure Analysis

    16.1. Competition Dashboard

    16.2. Competition Benchmarking

    16.3. Market Share Analysis of Top Players

        16.3.1. By Regional

        16.3.2. By Content Type

        16.3.3. By Access Type

        16.3.4. By Revenue Model

17. Competition Analysis

    17.1. Competition Deep Dive

        17.1.1. Akamai Technologies, Inc.

            17.1.1.1. Overview

            17.1.1.2. Product Portfolio

            17.1.1.3. Profitability by Market Segments

            17.1.1.4. Sales Footprint

            17.1.1.5. Strategy Overview

                17.1.1.5.1. Marketing Strategy

        17.1.2. Amazon.com, Inc.

            17.1.2.1. Overview

            17.1.2.2. Product Portfolio

            17.1.2.3. Profitability by Market Segments

            17.1.2.4. Sales Footprint

            17.1.2.5. Strategy Overview

                17.1.2.5.1. Marketing Strategy

        17.1.3. Apple, Inc.

            17.1.3.1. Overview

            17.1.3.2. Product Portfolio

            17.1.3.3. Profitability by Market Segments

            17.1.3.4. Sales Footprint

            17.1.3.5. Strategy Overview

                17.1.3.5.1. Marketing Strategy

        17.1.4. Brightcove, Inc.

            17.1.4.1. Overview

            17.1.4.2. Product Portfolio

            17.1.4.3. Profitability by Market Segments

            17.1.4.4. Sales Footprint

            17.1.4.5. Strategy Overview

                17.1.4.5.1. Marketing Strategy

        17.1.5. Google, Inc.

            17.1.5.1. Overview

            17.1.5.2. Product Portfolio

            17.1.5.3. Profitability by Market Segments

            17.1.5.4. Sales Footprint

            17.1.5.5. Strategy Overview

                17.1.5.5.1. Marketing Strategy

        17.1.6. Hulu LLC

            17.1.6.1. Overview

            17.1.6.2. Product Portfolio

            17.1.6.3. Profitability by Market Segments

            17.1.6.4. Sales Footprint

            17.1.6.5. Strategy Overview

                17.1.6.5.1. Marketing Strategy

        17.1.7. Limelight Networks, Inc.

            17.1.7.1. Overview

            17.1.7.2. Product Portfolio

            17.1.7.3. Profitability by Market Segments

            17.1.7.4. Sales Footprint

            17.1.7.5. Strategy Overview

                17.1.7.5.1. Marketing Strategy

        17.1.8. Netflix, Inc.

            17.1.8.1. Overview

            17.1.8.2. Product Portfolio

            17.1.8.3. Profitability by Market Segments

            17.1.8.4. Sales Footprint

            17.1.8.5. Strategy Overview

                17.1.8.5.1. Marketing Strategy

        17.1.9. Roku, Inc.

            17.1.9.1. Overview

            17.1.9.2. Product Portfolio

            17.1.9.3. Profitability by Market Segments

            17.1.9.4. Sales Footprint

            17.1.9.5. Strategy Overview

                17.1.9.5.1. Marketing Strategy

        17.1.10. Tencent Holdings Ltd.

            17.1.10.1. Overview

            17.1.10.2. Product Portfolio

            17.1.10.3. Profitability by Market Segments

            17.1.10.4. Sales Footprint

            17.1.10.5. Strategy Overview

                17.1.10.5.1. Marketing Strategy

        17.1.11. Alphabet Inc.

            17.1.11.1. Overview

            17.1.11.2. Product Portfolio

            17.1.11.3. Profitability by Market Segments

            17.1.11.4. Sales Footprint

            17.1.11.5. Strategy Overview

                17.1.11.5.1. Marketing Strategy

        17.1.12. Comcast Corp.

            17.1.12.1. Overview

            17.1.12.2. Product Portfolio

            17.1.12.3. Profitability by Market Segments

            17.1.12.4. Sales Footprint

            17.1.12.5. Strategy Overview

                17.1.12.5.1. Marketing Strategy

        17.1.13. Sirius XM Holdings Inc.

            17.1.13.1. Overview

            17.1.13.2. Product Portfolio

            17.1.13.3. Profitability by Market Segments

            17.1.13.4. Sales Footprint

            17.1.13.5. Strategy Overview

                17.1.13.5.1. Marketing Strategy

        17.1.14. Spotify Technology SA

            17.1.14.1. Overview

            17.1.14.2. Product Portfolio

            17.1.14.3. Profitability by Market Segments

            17.1.14.4. Sales Footprint

            17.1.14.5. Strategy Overview

                17.1.14.5.1. Marketing Strategy

        17.1.15. The Walt Disney Co.

            17.1.15.1. Overview

            17.1.15.2. Product Portfolio

            17.1.15.3. Profitability by Market Segments

            17.1.15.4. Sales Footprint

            17.1.15.5. Strategy Overview

                17.1.15.5.1. Marketing Strategy

18. Assumptions & Acronyms Used

19. Research Methodology
Customize this Report

Let us know your requirement to get
100% FREE customization

List of Tables

Table 1: Global Market Value (US$ Mn) Forecast by Region, 2017-2032

Table 2: Global Market Value (US$ Mn) Forecast by Content Type, 2017-2032

Table 3: Global Market Value (US$ Mn) Forecast by Access Type, 2017-2032

Table 4: Global Market Value (US$ Mn) Forecast by Revenue Model , 2017-2032

Table 5: North America Market Value (US$ Mn) Forecast by Country, 2017-2032

Table 6: North America Market Value (US$ Mn) Forecast by Content Type, 2017-2032

Table 7: North America Market Value (US$ Mn) Forecast by Access Type, 2017-2032

Table 8: North America Market Value (US$ Mn) Forecast by Revenue Model , 2017-2032

Table 9: Latin America Market Value (US$ Mn) Forecast by Country, 2017-2032

Table 10: Latin America Market Value (US$ Mn) Forecast by Content Type, 2017-2032

Table 11: Latin America Market Value (US$ Mn) Forecast by Access Type, 2017-2032

Table 12: Latin America Market Value (US$ Mn) Forecast by Revenue Model , 2017-2032

Table 13: Europe Market Value (US$ Mn) Forecast by Country, 2017-2032

Table 14: Europe Market Value (US$ Mn) Forecast by Content Type, 2017-2032

Table 15: Europe Market Value (US$ Mn) Forecast by Access Type, 2017-2032

Table 16: Europe Market Value (US$ Mn) Forecast by Revenue Model , 2017-2032

Table 17: South Asia & Pacific Market Value (US$ Mn) Forecast by Country, 2017-2032

Table 18: South Asia & Pacific Market Value (US$ Mn) Forecast by Content Type, 2017-2032

Table 19: South Asia & Pacific Market Value (US$ Mn) Forecast by Access Type, 2017-2032

Table 20: South Asia & Pacific Market Value (US$ Mn) Forecast by Revenue Model , 2017-2032

Table 21: East Asia Market Value (US$ Mn) Forecast by Country, 2017-2032

Table 22: East Asia Market Value (US$ Mn) Forecast by Content Type, 2017-2032

Table 23: East Asia Market Value (US$ Mn) Forecast by Access Type, 2017-2032

Table 24: East Asia Market Value (US$ Mn) Forecast by Revenue Model , 2017-2032

Table 25: MEA Market Value (US$ Mn) Forecast by Country, 2017-2032

Table 26: MEA Market Value (US$ Mn) Forecast by Content Type, 2017-2032

Table 27: MEA Market Value (US$ Mn) Forecast by Access Type, 2017-2032

Table 28: MEA Market Value (US$ Mn) Forecast by Revenue Model , 2017-2032
Sudip Saha
Principal Consultant
LinkedIn
Talk to Analyst

Find your sweet spots for generating winning opportunities in this market.

Talk to Analyst

List of Charts

Figure 1: Global Market Value (US$ Mn) by Content Type, 2022-2032

Figure 2: Global Market Value (US$ Mn) by Access Type, 2022-2032

Figure 3: Global Market Value (US$ Mn) by Revenue Model , 2022-2032

Figure 4: Global Market Value (US$ Mn) by Region, 2022-2032

Figure 5: Global Market Value (US$ Mn) Analysis by Region, 2017-2032

Figure 6: Global Market Value Share (%) and BPS Analysis by Region, 2022-2032

Figure 7: Global Market Y-o-Y Growth (%) Projections by Region, 2022-2032

Figure 8: Global Market Value (US$ Mn) Analysis by Content Type, 2017-2032

Figure 9: Global Market Value Share (%) and BPS Analysis by Content Type, 2022-2032

Figure 10: Global Market Y-o-Y Growth (%) Projections by Content Type, 2022-2032

Figure 11: Global Market Value (US$ Mn) Analysis by Access Type, 2017-2032

Figure 12: Global Market Value Share (%) and BPS Analysis by Access Type, 2022-2032

Figure 13: Global Market Y-o-Y Growth (%) Projections by Access Type, 2022-2032

Figure 14: Global Market Value (US$ Mn) Analysis by Revenue Model , 2017-2032

Figure 15: Global Market Value Share (%) and BPS Analysis by Revenue Model , 2022-2032

Figure 16: Global Market Y-o-Y Growth (%) Projections by Revenue Model , 2022-2032

Figure 17: Global Market Attractiveness by Content Type, 2022-2032

Figure 18: Global Market Attractiveness by Access Type, 2022-2032

Figure 19: Global Market Attractiveness by Revenue Model , 2022-2032

Figure 20: Global Market Attractiveness by Region, 2022-2032

Figure 21: North America Market Value (US$ Mn) by Content Type, 2022-2032

Figure 22: North America Market Value (US$ Mn) by Access Type, 2022-2032

Figure 23: North America Market Value (US$ Mn) by Revenue Model , 2022-2032

Figure 24: North America Market Value (US$ Mn) by Country, 2022-2032

Figure 25: North America Market Value (US$ Mn) Analysis by Country, 2017-2032

Figure 26: North America Market Value Share (%) and BPS Analysis by Country, 2022-2032

Figure 27: North America Market Y-o-Y Growth (%) Projections by Country, 2022-2032

Figure 28: North America Market Value (US$ Mn) Analysis by Content Type, 2017-2032

Figure 29: North America Market Value Share (%) and BPS Analysis by Content Type, 2022-2032

Figure 30: North America Market Y-o-Y Growth (%) Projections by Content Type, 2022-2032

Figure 31: North America Market Value (US$ Mn) Analysis by Access Type, 2017-2032

Figure 32: North America Market Value Share (%) and BPS Analysis by Access Type, 2022-2032

Figure 33: North America Market Y-o-Y Growth (%) Projections by Access Type, 2022-2032

Figure 34: North America Market Value (US$ Mn) Analysis by Revenue Model , 2017-2032

Figure 35: North America Market Value Share (%) and BPS Analysis by Revenue Model , 2022-2032

Figure 36: North America Market Y-o-Y Growth (%) Projections by Revenue Model , 2022-2032

Figure 37: North America Market Attractiveness by Content Type, 2022-2032

Figure 38: North America Market Attractiveness by Access Type, 2022-2032

Figure 39: North America Market Attractiveness by Revenue Model , 2022-2032

Figure 40: North America Market Attractiveness by Country, 2022-2032

Figure 41: Latin America Market Value (US$ Mn) by Content Type, 2022-2032

Figure 42: Latin America Market Value (US$ Mn) by Access Type, 2022-2032

Figure 43: Latin America Market Value (US$ Mn) by Revenue Model , 2022-2032

Figure 44: Latin America Market Value (US$ Mn) by Country, 2022-2032

Figure 45: Latin America Market Value (US$ Mn) Analysis by Country, 2017-2032

Figure 46: Latin America Market Value Share (%) and BPS Analysis by Country, 2022-2032

Figure 47: Latin America Market Y-o-Y Growth (%) Projections by Country, 2022-2032

Figure 48: Latin America Market Value (US$ Mn) Analysis by Content Type, 2017-2032

Figure 49: Latin America Market Value Share (%) and BPS Analysis by Content Type, 2022-2032

Figure 50: Latin America Market Y-o-Y Growth (%) Projections by Content Type, 2022-2032

Figure 51: Latin America Market Value (US$ Mn) Analysis by Access Type, 2017-2032

Figure 52: Latin America Market Value Share (%) and BPS Analysis by Access Type, 2022-2032

Figure 53: Latin America Market Y-o-Y Growth (%) Projections by Access Type, 2022-2032

Figure 54: Latin America Market Value (US$ Mn) Analysis by Revenue Model , 2017-2032

Figure 55: Latin America Market Value Share (%) and BPS Analysis by Revenue Model , 2022-2032

Figure 56: Latin America Market Y-o-Y Growth (%) Projections by Revenue Model , 2022-2032

Figure 57: Latin America Market Attractiveness by Content Type, 2022-2032

Figure 58: Latin America Market Attractiveness by Access Type, 2022-2032

Figure 59: Latin America Market Attractiveness by Revenue Model , 2022-2032

Figure 60: Latin America Market Attractiveness by Country, 2022-2032

Figure 61: Europe Market Value (US$ Mn) by Content Type, 2022-2032

Figure 62: Europe Market Value (US$ Mn) by Access Type, 2022-2032

Figure 63: Europe Market Value (US$ Mn) by Revenue Model , 2022-2032

Figure 64: Europe Market Value (US$ Mn) by Country, 2022-2032

Figure 65: Europe Market Value (US$ Mn) Analysis by Country, 2017-2032

Figure 66: Europe Market Value Share (%) and BPS Analysis by Country, 2022-2032

Figure 67: Europe Market Y-o-Y Growth (%) Projections by Country, 2022-2032

Figure 68: Europe Market Value (US$ Mn) Analysis by Content Type, 2017-2032

Figure 69: Europe Market Value Share (%) and BPS Analysis by Content Type, 2022-2032

Figure 70: Europe Market Y-o-Y Growth (%) Projections by Content Type, 2022-2032

Figure 71: Europe Market Value (US$ Mn) Analysis by Access Type, 2017-2032

Figure 72: Europe Market Value Share (%) and BPS Analysis by Access Type, 2022-2032

Figure 73: Europe Market Y-o-Y Growth (%) Projections by Access Type, 2022-2032

Figure 74: Europe Market Value (US$ Mn) Analysis by Revenue Model , 2017-2032

Figure 75: Europe Market Value Share (%) and BPS Analysis by Revenue Model , 2022-2032

Figure 76: Europe Market Y-o-Y Growth (%) Projections by Revenue Model , 2022-2032

Figure 77: Europe Market Attractiveness by Content Type, 2022-2032

Figure 78: Europe Market Attractiveness by Access Type, 2022-2032

Figure 79: Europe Market Attractiveness by Revenue Model , 2022-2032

Figure 80: Europe Market Attractiveness by Country, 2022-2032

Figure 81: South Asia & Pacific Market Value (US$ Mn) by Content Type, 2022-2032

Figure 82: South Asia & Pacific Market Value (US$ Mn) by Access Type, 2022-2032

Figure 83: South Asia & Pacific Market Value (US$ Mn) by Revenue Model , 2022-2032

Figure 84: South Asia & Pacific Market Value (US$ Mn) by Country, 2022-2032

Figure 85: South Asia & Pacific Market Value (US$ Mn) Analysis by Country, 2017-2032

Figure 86: South Asia & Pacific Market Value Share (%) and BPS Analysis by Country, 2022-2032

Figure 87: South Asia & Pacific Market Y-o-Y Growth (%) Projections by Country, 2022-2032

Figure 88: South Asia & Pacific Market Value (US$ Mn) Analysis by Content Type, 2017-2032

Figure 89: South Asia & Pacific Market Value Share (%) and BPS Analysis by Content Type, 2022-2032

Figure 90: South Asia & Pacific Market Y-o-Y Growth (%) Projections by Content Type, 2022-2032

Figure 91: South Asia & Pacific Market Value (US$ Mn) Analysis by Access Type, 2017-2032

Figure 92: South Asia & Pacific Market Value Share (%) and BPS Analysis by Access Type, 2022-2032

Figure 93: South Asia & Pacific Market Y-o-Y Growth (%) Projections by Access Type, 2022-2032

Figure 94: South Asia & Pacific Market Value (US$ Mn) Analysis by Revenue Model , 2017-2032

Figure 95: South Asia & Pacific Market Value Share (%) and BPS Analysis by Revenue Model , 2022-2032

Figure 96: South Asia & Pacific Market Y-o-Y Growth (%) Projections by Revenue Model , 2022-2032

Figure 97: South Asia & Pacific Market Attractiveness by Content Type, 2022-2032

Figure 98: South Asia & Pacific Market Attractiveness by Access Type, 2022-2032

Figure 99: South Asia & Pacific Market Attractiveness by Revenue Model , 2022-2032

Figure 100: South Asia & Pacific Market Attractiveness by Country, 2022-2032

Figure 101: East Asia Market Value (US$ Mn) by Content Type, 2022-2032

Figure 102: East Asia Market Value (US$ Mn) by Access Type, 2022-2032

Figure 103: East Asia Market Value (US$ Mn) by Revenue Model , 2022-2032

Figure 104: East Asia Market Value (US$ Mn) by Country, 2022-2032

Figure 105: East Asia Market Value (US$ Mn) Analysis by Country, 2017-2032

Figure 106: East Asia Market Value Share (%) and BPS Analysis by Country, 2022-2032

Figure 107: East Asia Market Y-o-Y Growth (%) Projections by Country, 2022-2032

Figure 108: East Asia Market Value (US$ Mn) Analysis by Content Type, 2017-2032

Figure 109: East Asia Market Value Share (%) and BPS Analysis by Content Type, 2022-2032

Figure 110: East Asia Market Y-o-Y Growth (%) Projections by Content Type, 2022-2032

Figure 111: East Asia Market Value (US$ Mn) Analysis by Access Type, 2017-2032

Figure 112: East Asia Market Value Share (%) and BPS Analysis by Access Type, 2022-2032

Figure 113: East Asia Market Y-o-Y Growth (%) Projections by Access Type, 2022-2032

Figure 114: East Asia Market Value (US$ Mn) Analysis by Revenue Model , 2017-2032

Figure 115: East Asia Market Value Share (%) and BPS Analysis by Revenue Model , 2022-2032

Figure 116: East Asia Market Y-o-Y Growth (%) Projections by Revenue Model , 2022-2032

Figure 117: East Asia Market Attractiveness by Content Type, 2022-2032

Figure 118: East Asia Market Attractiveness by Access Type, 2022-2032

Figure 119: East Asia Market Attractiveness by Revenue Model , 2022-2032

Figure 120: East Asia Market Attractiveness by Country, 2022-2032

Figure 121: MEA Market Value (US$ Mn) by Content Type, 2022-2032

Figure 122: MEA Market Value (US$ Mn) by Access Type, 2022-2032

Figure 123: MEA Market Value (US$ Mn) by Revenue Model , 2022-2032

Figure 124: MEA Market Value (US$ Mn) by Country, 2022-2032

Figure 125: MEA Market Value (US$ Mn) Analysis by Country, 2017-2032

Figure 126: MEA Market Value Share (%) and BPS Analysis by Country, 2022-2032

Figure 127: MEA Market Y-o-Y Growth (%) Projections by Country, 2022-2032

Figure 128: MEA Market Value (US$ Mn) Analysis by Content Type, 2017-2032

Figure 129: MEA Market Value Share (%) and BPS Analysis by Content Type, 2022-2032

Figure 130: MEA Market Y-o-Y Growth (%) Projections by Content Type, 2022-2032

Figure 131: MEA Market Value (US$ Mn) Analysis by Access Type, 2017-2032

Figure 132: MEA Market Value Share (%) and BPS Analysis by Access Type, 2022-2032

Figure 133: MEA Market Y-o-Y Growth (%) Projections by Access Type, 2022-2032

Figure 134: MEA Market Value (US$ Mn) Analysis by Revenue Model , 2017-2032

Figure 135: MEA Market Value Share (%) and BPS Analysis by Revenue Model , 2022-2032

Figure 136: MEA Market Y-o-Y Growth (%) Projections by Revenue Model , 2022-2032

Figure 137: MEA Market Attractiveness by Content Type, 2022-2032

Figure 138: MEA Market Attractiveness by Access Type, 2022-2032

Figure 139: MEA Market Attractiveness by Revenue Model , 2022-2032

Figure 140: MEA Market Attractiveness by Country, 2022-2032

Need specific information?

Request Customization

Explore Technology Insights

View Reports

Recommendations

Technology

Video Streaming Software Market

Published : February 2022

Technology

Video Management Software Market

Published : July 2017

Technology

Video on Demand (VOD) Service Market

Published : March 2021

Google translate