
- Market Size (2026)
- USD 4.8 Bn
- Forecast (2036)
- USD 7.0 Bn
- CAGR (2026 to 2036)
- 3.8%
How big is Cottonseed Oil Market in 2026?
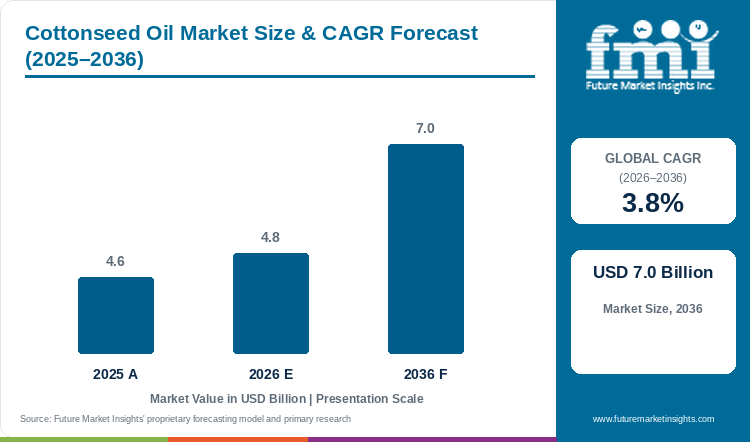
Sales in the cottonseed oil market are projected to grow at 3.8% CAGR, with the market size rising from USD 4.6 Billion in 2025 to USD 4.8 Billion in 2026 and reaching USD 7.0 Billion by 2036.
According to Future Market Insights analysis, the global cottonseed oil market stands at USD 4.6 Billion in 2025 and rises to USD 4.8 Billion in 2026. Industry valuation is projected to reach USD 7.0 Billion by 2036, expanding at a 3.8% CAGR and generating USD 2.2 Billion in added revenue over the forecast period. Steady commercial demand for high-stability deep-frying oil anchors baseline volumes across industrial snack fryers and commercial bakeries. In January 2025, USDA Economic Research Service oilseed reports documented that commercial cottonseed crushing volumes rose by 2.6% across domestic processing facilities [1].
Key Market Trends & Insights
- By form / physical state: Fine powder & micronized crystals led with 45.1% share in 2026, as crystallized stearin fractions structure shortening formulations.
- By source / nature: Conventional farm source held 56.8% in 2026, supported by established agricultural cotton acreage and cooperative crushing mills.
- By application sector: Dietary supplements & nutraceuticals captured 45.2% in 2026, driven by tocopherol carrier oils and softgel encapsulation bases.
- By sales channel: B2B direct industrial food manufacturers accounted for 53.6% in 2026, underpinned by bulk tanker rail and drum procurement.
Regional Highlights
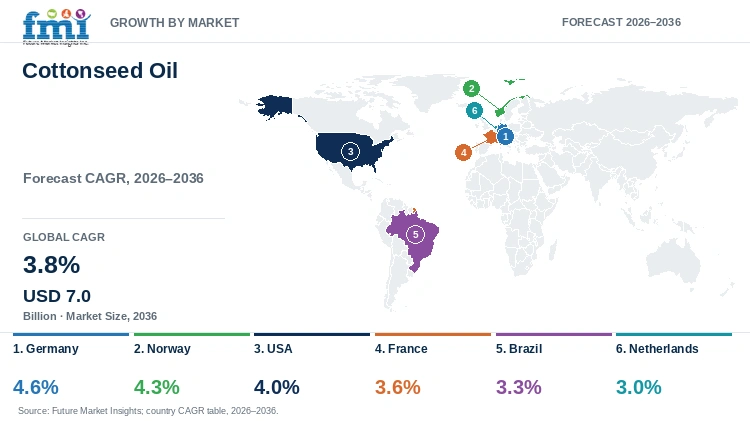
- Fastest-growing evaluated country: Germany, at 4.6% CAGR from 2026 to 2036.
- By country: Norway at 4.3%, the USA at 4.0%, France at 3.6%, and Brazil at 3.3% follow, while the Netherlands records the lowest evaluated CAGR at 3.0%.
Market Size & Forecast
Table 1: Market Size and Forecast for the Cottonseed Oil Market (USD Billion and CAGR percentage), 2025 to 2036
| Metric | Value |
|---|---|
| 2025 Market Size | USD 4.6 Billion |
| Estimated Market Size in 2026 | USD 4.8 Billion |
| Projected Market Size by 2036 | USD 7.0 Billion |
| CAGR, 2026 to 2036 | 3.8% |
| Added Revenue, 2026 to 2036 | USD 2.2 Billion |
Cottonseed Crushing and Refining Metrics
Table 2: Cottonseed Crushing and Refining Metrics for the Cottonseed Oil Market (USD Billion and operational ranges), mixed historical and forecast years from 2025 to 2036
| Metric | 2025 | 2026 | 2036 |
|---|---|---|---|
| Market size (USD Billion) | 4.6 | 4.8 | 7.0 |
| Global Cottonseed Crushing Volume (Million Metric Tons) | 38.5 to 42.0 | 39.8 to 43.5 | 54.0 to 60.5 |
| Alkali Bleaching and Deodorization Energy Efficiency (kWh per Ton) | 52.0 to 58.5 | 50.5 to 56.8 | 40.0 to 45.5 |
| Free Gossypol Removal Compliance Rate (Percent) | 99.8 to 99.9 | 99.8 to 100.0 | 99.9 to 100.0 |
Per Capita Intake & Food Processing Sizing
Refined cottonseed oil has maintained sustained popularity in commercial food processing due to its high smoke point and neutral flavor profile. Balancing frying oil stability requires high levels of natural gamma-tocopherol antioxidants. Surging restaurant foodservice turnover converts commercial cooking demand into recurring bulk cottonseed oil tanker purchases. Industrial food manufacturing facilities represent primary volume consumers for hydrogenated cottonseed fat fractions.
Table 3: Per Capita and Food Facility Spending Indicators for the Cottonseed Oil Market (USD), mixed historical and forecast years from 2025 to 2036
| Metric | 2025 | 2026 | 2036 |
|---|---|---|---|
| Global Population (Billion) | 8.23 | 8.30 | 8.95 |
| Annual Cottonseed Oil Spend per Capita (USD) | 0.56 | 0.58 | 0.78 |
| Annual Edible Oil Spend per Commercial Kitchen (USD) | 850.00 to 1,150.00 | 880.00 to 1,200.00 | 1,350.00 to 1,800.00 |
| Wholesale Procurement Spend per Snack Processing Plant (USD Thousand) | 120.0 to 165.0 | 128.0 to 175.0 | 210.0 to 285.0 |
Table 4: Facility & Operational Manufacturing Spending Indicators for the Cottonseed Oil Market (USD and percentages), mixed reporting years from 2023 to 2026
| Metric | Value | Basis |
|---|---|---|
| Market size, 2026 | USD 4.8 Billion | Report value |
| Licensed industrial bakeries and snack food plants worldwide | 14,200 | 2024 secondary estimate |
| Average commercial cottonseed oil spend per facility | USD 338.03 Thousand | Calculated |
| B2B industrial food manufacturers channel revenue, 2026 | USD 2.57 Billion | 53.6% share |
Analyst Perspective
"The cottonseed oil sector continues to defend essential market share across commercial baking and high-heat snack frying applications. Its natural ratio of palmitic acid provides superior crystal lattice structure in bakery shortenings without requiring aggressive trans-fat hydrogenation. Crushing groups that invest in enzymatic interesterification and automated bleaching technologies will capture durable long-term contracts across multinational snack processors and private-label food companies."
- Nandini Roy Choudhury, Principal Consultant, Future Market Insights.
How is the Cottonseed Oil Market segmented?
The cottonseed oil market is segmented by form / physical state, source / nature, application sector, sales channel, and region. In 2026, fine powder & micronized crystals is projected at 45.1%, conventional farm source at 56.8%, dietary supplements & nutraceuticals at 45.2%, and B2B industrial food manufacturers at 53.6%.
By form / physical state: Fine Powder & Micronized Crystals, Liquid Extract & Tincture, and Standardized Granules & Pellets.
By source / nature: Conventional Farm Source, Certified Organic & Non-GMO, and Fermentation / Bio-Synthesized.
By application sector: Dietary Supplements & Nutraceuticals, Functional Food & Beverages, Cosmetics & Topical Personal Care, and Animal Nutrition.
By sales channel: B2B Direct Industrial Food Manufacturers, Retail Packaged Health Stores, and Online DTC Brands.
By region: North America, Latin America, Western Europe, Eastern Europe, East Asia, South Asia and Pacific, Middle East and Africa.
Why do fine powder & micronized crystals lead the form / physical state category?
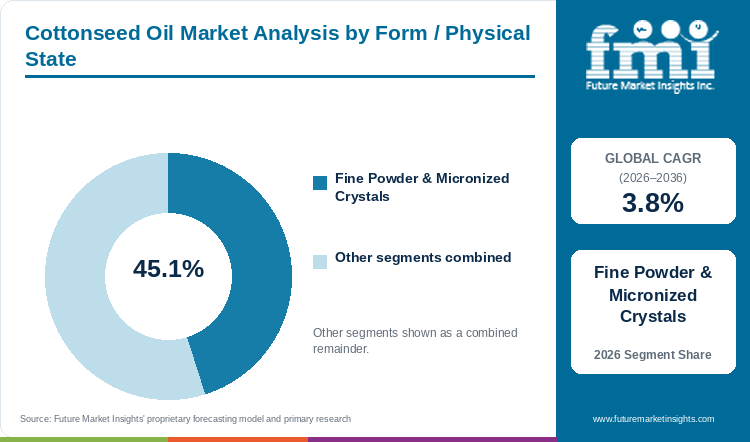
Fine powder & micronized crystals represents 45.1% of form / physical state in 2026, delivering high solid-fat stability in commercial bakery shortenings and pastry margarines.
Table 5: Form / Physical State Share for the Cottonseed Oil Market (percentage share), 2026
| Form / Physical State | Share (2026) |
|---|---|
| Fine Powder & Micronized Crystals | 45.1% |
| Other Segments Combined | 54.9%* |
| Total | 100.0% |
Table 6: Form / Physical State Leadership and Market Growth for the Cottonseed Oil Market (segment and CAGR percentage), 2026 to 2036
| Metric | Value |
|---|---|
| Global CAGR (2026 to 2036) | 3.8% |
| Leading Segment | Fine Powder & Micronized Crystals |
Commercial bakers and fat refiners heavily favor fine powder & micronized crystals because fully hydrogenated cottonseed flakes provide high melting points and firm crystal structures. Industrial bakeries blend cottonseed stearin powder into pie doughs to achieve flaky crusts without weeping oil during baking. In addition, food processors evaluate edible oil packaging solutions to protect bulk oil drums from moisture degradation. Refiners also formulate normal and specialty fats by interesterifying cottonseed oil with palm kernel fractions. Furthermore, chemical engineers deploy hydrotreated vegetable oil technologies to produce bio-lubricants from non-food oilseed residues. Quality managers negotiate volume contracts to secure steady cottonseed supplies for regional baking operations.
- Fine powder & micronized crystals represents 45.1% of physical state in 2026, as commercial biscuit makers require high-melting-point fat crystallization.
- In March 2025, commercial fat crystallization researchers published technical criteria on beta-prime crystal stabilization in vegetable shortening lines [3].
What drives conventional farm source to the forefront of the source / nature segment?
Conventional farm source accounts for 56.8% of source / nature in 2026, underpinned by extensive domestic cotton crop acreage and integrated cooperative ginning facilities.
Conventional farm cotton crops produce vast quantities of seed byproduct during annual mechanical harvesting. Cotton gins deliver raw seeds directly to adjacent crushing plants for oil extraction and meal pelletization. Crushing mills achieve high volume efficiency by processing conventional seeds through automated expeller presses. Health-conscious food brands also seek certified organic edible oil to serve specialty clean-label baking markets. In addition, ingredient manufacturers utilize premix for edible oils to fortify refined vegetable oils with vitamin A and D. Bulk buyers secure long-term procurement contracts with regional cooperative crushing elevators.
- Conventional farm source accounts for 56.8% of source / nature in 2026, supported by competitive volume pricing and established cotton agricultural supply chains.
- In May 2025, U.S. Food and Drug Administration food additive reviews affirmed refined edible oils and fats compositional standards across commercial frying lines [4].
Why does dietary supplements & nutraceuticals define the largest application sector?
Dietary supplements & nutraceuticals holds 45.2% of application sector in 2026, driven by high tocopherol carrier oil demand and stable softgel encapsulation properties.
Pharmaceutical and nutraceutical laboratories choose refined cottonseed oil as an inert carrier vehicle for fat-soluble vitamins and dietary herbal extracts. Softgel capsule manufacturers utilize cottonseed oil because its neutral acidity prevents gelatin shell cross-linking or capsule brittleness. Vitamin formulators also extract natural alpha and gamma-tocopherols from deodorizer distillates to produce natural antioxidant complexes. Food processors also procure specialized brominated vegetable oil substitutes to stabilize beverage citrus flavoring emulsions. Manufacturers package refined oil into durable edible oil cans to prevent light-induced lipid peroxidation during transit.
- Dietary supplements & nutraceuticals holds 45.2% of application sector in 2026, sustained by high encapsulation stability in softgel manufacturing.
- In June 2025, European Food Safety Authority dietary fat guidelines validated antioxidant retention standards for refined vegetable oils [5].
How do B2B industrial food manufacturers maintain 53.6% share across sales channels?
B2B direct industrial food manufacturers commands 53.6% of sales channels in 2026, driven by bulk railcar tanker shipments to commercial snack frying and baking plants.
Industrial food processing plants consume millions of gallons of refined vegetable oil annually to operate continuous potato chip fryers and commercial donut lines. Snack manufacturers receive dedicated rail tanker deliveries directly into temperature-monitored bulk holding silos. Purchasing directors negotiate annual fixed-price contracts with major agricultural commodity crushers to lock in predictable production costs. Chemical manufacturers also purchase non-edible industrial oil fractions to produce alkyd resins and bio-based lubricants. Commercial oil suppliers maintain dedicated logistics fleets to guarantee uninterrupted delivery schedules to major industrial food facilities.
- B2B direct industrial food manufacturers commands 53.6% of sales channels in 2026, driven by high volume purchasing in commercial snack processing.
- In August 2025, commercial edible oil logistics associations published updated bulk transit quality standards for refined vegetable oil tankers [6].
What are the drivers, restraints, and opportunities in the Cottonseed Oil Market?
High thermal frying stability sustains cottonseed oil demand, while cotton crop volatility limits supply and trans-fat-free shortening reformulation creates premium value.
- Driver: Exceptional high-temperature smoke points and natural crystal-forming properties propel steady industrial demand for commercial deep frying and baking shortenings.
- Restraint: Raw seed availability depends entirely on volatile textile fiber harvests, and rigorous gossypol chemical detoxification elevates refining costs.
- Opportunity: Enzymatic interesterification allows oil processors to manufacture zero-trans-fat bakery shortenings that match the functional performance of partially hydrogenated fats.
Growth Analysis and Future Potential: Qualitative Demand Catalysts
Commercial snack food manufacturers favor cottonseed oil because its neutral flavor allows natural potato, corn, and spice flavors to emerge without greasy aftertaste. High smoke points exceeding two hundred and twenty degrees Celsius prevent premature oil breakdown during prolonged commercial frying cycles. Future Market Insights research indicates that commercial snack fryers achieve longer kettle life and reduced oil turnover when blending cottonseed oil with sunflower oil. Oilseed refiners respond by scaling deodorization capacity to meet snack brand specifications.
Risk Assessment of the Cottonseed Oil Market: Operational and Formulation Friction
Weather disruptions in cotton agricultural basins and solvent residue limits represent persistent operational hurdles for cottonseed crushing plants. Unfavorable monsoon rains or boll weevil infestations sharply reduce annual seed harvests, causing severe raw material price spikes. Furthermore, unrefined seed contains toxic gossypol polyphenols that mandate strict multi-stage alkali neutralization to satisfy food safety limits. In October 2025, agricultural logistics reports documented that rail tank freight tariffs rose by 11.4% across southern transport corridors [8]. Crushing plants must operate automated spectrophotometric analyzers to verify total gossypol clearance in every refined batch.
Commercial Opportunity Analysis: Formulation Differentiation and Value-Add Formats
Oil processors capture substantial commercial value by formulating enzymatically interesterified bakery shortenings and natural tocopherol supplements. Refiners combine cottonseed stearin with liquid vegetable oils to create smooth, spreadable margarine bases without creating harmful trans fatty acids. In addition, specialty chemical producers formulate hydrotreated industrial lubricants for agricultural machinery. Food brands also formulate premium retail packaged blends to serve regional culinary traditions. In November 2025, bakery trade scanner data indicated that clean-label zero-trans-fat shortening sales expanded by 14.8% across commercial wholesale distributors [9].
Cottonseed Oil Market by Country (2026 to 2036)
As per Future Market Insights, Germany represents the fastest-growing cottonseed oil market among the six evaluated countries, at a 4.6% CAGR from 2026 to 2036, while the Netherlands records the slowest expansion at 3.0% CAGR. Across all six covered economies, commercial success is dictated by how effectively oil refiners achieve gossypol-free purity, produce trans-fat-free bakery fats, and maintain reliable industrial supply agreements.
Table 7: Country CAGR and Primary Growth Levers for the Cottonseed Oil Market (CAGR percentage and operational drivers), 2026 to 2036
| Country | CAGR (2026 to 2036) | Primary Growth Lever |
|---|---|---|
| Germany | 4.6% | Industrial bakery demand for non-hydrogenated pastry fats, specialty food processing, and advanced enzymatic fat interesterification |
| Norway | 4.3% | Aquaculture feed oil processing, industrial marine lubricant formulation, and specialized cold-water bio-oil applications |
| USA | 4.0% | Vast southern cotton agricultural belt, large commercial potato chip and snack frying industries, and major bakery shortening manufacturing |
| France | 3.6% | Gourmet commercial pastry production, industrial biscuit manufacturing, and specialty culinary cooking oil blending |
| Brazil | 3.3% | Expanding Mato Grosso cotton production acreage, domestic snack food processing growth, and competitive biofuel blending |
| Netherlands | 3.0% | Major Rotterdam vegetable oil port refining infrastructure, European edible oil trade distribution, and margarine manufacturing |
Source: Future Market Insights analysis
Germany Cottonseed Oil Market Outlook (2026 to 2036)
By 2036, Germany is projected to grow at 4.6% CAGR, driven by industrial bakery demand for trans-fat-free pastry shortenings and advanced fat modification technology. In January 2026, the German Association of the Oilseed Crushing Industry confirmed steady demand for specialized solid fats across commercial bakery ingredient suppliers [10]. German industrial bakers require fats with stable crystal structures that maintain lamination in automated puff pastry lines. Ingredient laboratories utilize enzymatic interesterification to create premium palm-free shortening alternatives. However, strict European Union pesticide residue import thresholds and high industrial electricity rates present operational hurdles. Refiners address these challenges by procuring certified sustainable seed imports and deploying energy-efficient deodorizing columns.
Key takeaway:In Germany, precision bakery fat formulation requirements and trans-fat-free shortening demand propel the fastest growth among evaluated countries.
Norway Cottonseed Oil Market Outlook (2026 to 2036)
Norway's cottonseed oil market is anticipated to advance at 4.3% CAGR over the assessment period, owing to specialty aquaculture feed blending and industrial marine lubricant manufacturing. In March 2025, the Norwegian Directorate of Fisheries documented expanding trials of specialized vegetable lipids in sustainable salmon feed pellets [11]. Feed manufacturers evaluate high-stability vegetable fats to supplement marine fish oil in fish feed diets. In addition, marine engineering firms utilize refined vegetable oil bases for environmentally acceptable deck lubricants. However, cold winter maritime temperatures necessitate winterized, dewaxed oil formulations to prevent crystallization in ship machinery. Norwegian blenders overcome this barrier by procuring winterized liquid fractions that remain fluid below freezing temperatures.
Key takeaway:In Norway, sustainable aquaculture feed development and marine bio-lubricant applications support steady category expansion.
USA Cottonseed Oil Market Outlook (2026 to 2036)
In the USA, cottonseed oil demand is predicted to advance at 4.0% CAGR through 2036, enabled by a massive southern cotton farming belt and heavy commercial snack frying demand. American potato chip and corn snack manufacturers prefer cottonseed oil for its high smoke point and neutral flavor that preserves chip crispness. Commercial bakeries consume substantial quantities of cottonseed shortening for pie crusts and cake icings. However, competition from canola and high-oleic soybean oils presents persistent volume pressure. Refiners mitigate this competition by marketing cottonseed oil's natural beta-prime crystal advantage to commercial bakers.
Key takeaway:In the USA, vast agricultural crop acreage and entrenched commercial snack frying demand sustain dependable category revenue.
France Cottonseed Oil Market Outlook (2026 to 2036)
Adoption of cottonseed oil in France is estimated to expand at 3.6% CAGR through 2036, supported by gourmet commercial pastry manufacturing and industrial biscuit production. In May 2025, the French National Federation of Oil Industries reported expanding industrial usage of specialty crystallized vegetable fats across northern biscuit bakeries [13]. French commercial bakers value the uniform plasticity that cottonseed stearin imparts to laminated doughs. In addition, food processors blend refined oil into creamy dressings and mayonnaise sauces. However, French consumer skepticism toward non-traditional culinary oils and strict labeling rules require clear ingredient declaration. Food processors overcome this hurdle by incorporating cottonseed fats as functional texturizers in finished packaged goods.
Key takeaway:In France, high commercial bakery fat demand and specialized pastry texturizing requirements provide steady category performance.
Brazil Cottonseed Oil Market Outlook (2026 to 2036)
The Brazil cottonseed oil sector is projected to record 3.3% CAGR during the assessment period, reinforced by expanding cotton acreage in Mato Grosso and growing domestic snack manufacturing. In June 2025, the Brazilian Association of Vegetable Oil Industries confirmed a 4.2% increase in domestic cottonseed crushing output [14]. Brazilian snack manufacturers consume refined oil for frying potato crisps and extruded corn snacks. Regional poultry and swine feed mills utilize residual cottonseed meal for animal protein nutrition. However, domestic transportation bottlenecks over long highway distances from the central-west farming belt elevate distribution expenses. Commodity producers mitigate this hurdle by modernizing dedicated grain and oil rail corridors to coastal ports.
Key takeaway:In Brazil, expanding domestic cotton cultivation and growing industrial snack food production support dependable long-term market growth.
Netherlands Cottonseed Oil Market Outlook (2026 to 2036)
Netherlands cottonseed oil demand is forecast to rise at 3.0% CAGR over the forecast period, supported by massive vegetable oil refining capacity at the Port of Rotterdam and European margarine exports. In July 2025, Statistics Netherlands confirmed substantial trade in refined vegetable oils through major Dutch port terminals [15]. Dutch refiners import crude cottonseed oil for advanced chemical refining, bleaching, and trans-European barge redistribution. Specialized fat blenders utilize cottonseed stearin to formulate spreadable margarine blocks for European supermarket distribution. However, intense competitive pressure from imported palm and sunflower oils limits category growth rates. Dutch refiners address this challenge by focusing on high-purity pharmaceutical carrier oils and technical bio-lubricants.
Key takeaway:In the Netherlands, world-class port refining infrastructure and European trade connectivity maintain steady baseline market performance.
Full report country CAGRs cover: North America; Latin America; Western Europe; Eastern Europe; East Asia; South Asia and Pacific; Middle East and Africa.
Who are the notable companies in the Cottonseed Oil Market?
Bunge Global SA, Archer Daniels Midland Company (ADM), Cargill, Incorporated, Kerry Group plc, Ingredion Incorporated, Tate & Lyle PLC, DSM-Firmenich, International Flavors & Fragrances (IFF), Givaudan SA, and Roquette Freres are the significant market players in this market.
Future Market Insights analysis indicates that the competitive environment divides between multinational agricultural commodity crushers, specialty ingredient refiners, and global flavor and lipid corporations. Agricultural commodity corporations operate massive integrated crushing elevators and continuous multi-stage chemical refineries. Specialty lipid processors utilize advanced enzymatic interesterification to create tailored solid fats for commercial baking. Flavor and nutrition corporations formulate customized lipid emulsions, carrier systems, and functional food bases. Industrial purchasing executives evaluate cottonseed oil suppliers on free fatty acid specifications, peroxide values, gossypol clearance, and competitive barge freight terms.
- Global Agribusiness & Commodity Crushers: Archer Daniels Midland Company (ADM), Bunge Global SA, and Cargill, Incorporated operate multi-facility crushing elevators and nationwide rail tanker fleets.
- Specialty Texture & Food Ingredient Refiners: Ingredion Incorporated, Roquette Freres, and Tate & Lyle PLC formulate functional fat texturizers and bakery shortening systems.
- Flavor, Lipid & Nutritional Innovators: Kerry Group plc, DSM-Firmenich, Givaudan SA, and International Flavors & Fragrances (IFF) develop specialized carrier lipids and stabilized encapsulation bases.
Competitive Benchmarking: Cottonseed Oil Market
Table 8: Competitive Benchmarking for the Cottonseed Oil Market (qualitative capability ratings), 2026
| Company | Seed Crushing & Refining Scale | Bakery Fat Modification Depth | Foodservice Frying Oil Reach | Global Tanker Logistics |
|---|---|---|---|---|
| Archer Daniels Midland Company (ADM) | High | High | High | High |
| Bunge Global SA | High | High | High | High |
| Cargill, Incorporated | High | High | High | High |
| Ingredion Incorporated | Medium | High | Medium | High |
| Roquette Freres | Medium | High | Medium | High |
| Tate & Lyle PLC | Medium | High | Low | High |
| Kerry Group plc | Medium | High | Medium | High |
| DSM-Firmenich | Medium | High | Low | High |
| Givaudan SA | Low | Medium | Low | High |
| International Flavors & Fragrances (IFF) | Low | Medium | Low | Hig |
Key Players in the Cottonseed Oil Market
Global Agribusiness & Commodity Crushers
- Archer Daniels Midland Company (ADM)
- Bunge Global SA
- Cargill, Incorporated
Specialty Texture & Food Ingredient Refiners
- Ingredion Incorporated
- Roquette Freres
- Tate & Lyle PLC
Flavor, Lipid & Nutritional Innovators
- Kerry Group plc
- DSM-Firmenich
- Givaudan SA
- International Flavors & Fragrances (IFF)
Cottonseed Oil Market - Report Scope
Table 9: Report Scope for the Cottonseed Oil Market (coverage fields and definitions), 2026 to 2036
| Coverage field | Report scope |
|---|---|
| Market breakdown | Form / Physical State; Source / Nature; Application Sector; Sales Channel |
| Quantitative Units | USD Billion |
| Market Definition | Encompasses global manufacturer and crusher revenue from crude, refined, bleached, and deodorized cottonseed oil, cottonseed stearin flakes, and modified cottonseed fats sold into food, nutraceutical, cosmetic, and industrial applications. Excludes untreated raw cotton seed sold strictly for livestock planting. |
| Regions Covered | North America; Latin America; Western Europe; Eastern Europe; East Asia; South Asia and Pacific; Middle East and Africa |
| Countries Covered | Germany, Norway, USA, France, Brazil, Netherlands, and additional countries in the full report |
| Key Companies Covered | Bunge Global SA, Archer Daniels Midland Company (ADM), Cargill, Incorporated, Kerry Group plc, Ingredion Incorporated, Tate & Lyle PLC, DSM-Firmenich, International Flavors & Fragrances (IFF), Givaudan SA, Roquette Freres |
| Forecast Period | 2026 to 2036 |
| Approach | Primary and secondary research with rigorous market triangulation. |
Cottonseed Oil Market - Research Methodology
Table 10: Research Methodology for the Cottonseed Oil Market (research methods and approach), 2026 edition
| Method | Approach |
|---|---|
| Primary Research | Primary interviews were conducted with oilseed crushing plant directors, edible oil refinery managers, commercial snack food processing engineers, industrial bakery buyers, and agricultural commodity traders to validate seed crush volumes, refining yields, freight tariffs, and bulk contract pricing. |
| Secondary Research | Secondary research included analysis of national agricultural ministry datasets, international oilseed trade statistics, corporate financial releases, oil chemistry scientific journals, and publicly available food regulatory standards. |
| Market Sizing and Forecasting | Market sizing and forecasting for the 2026 to 2036 forecast period were developed using top-down and bottom-up models evaluating annual cotton crop harvests, seed extraction yields, industrial frying consumption, and bulk refinery shipment volumes. |
| Data Triangulation and Validation | Data is validated against macroeconomic food production indices, global edible oil trade statistics, industrial frying oil replacement cycles, and historical industry benchmarks to ensure high precision without double counting raw cotton fiber. |
Cottonseed Oil Market by Segments
Cottonseed Oil Market segmented by Form / Physical State:
- Fine Powder & Micronized Crystals
- Liquid Extract & Tincture
- Standardized Granules & Pellets
Cottonseed Oil Market segmented by Source / Nature:
- Conventional Farm Source
- Certified Organic & Non-GMO
- Fermentation / Bio-Synthesized
Cottonseed Oil Market segmented by Application Sector:
- Dietary Supplements & Nutraceuticals
- Functional Food & Beverages
- Cosmetics & Topical Personal Care
- Animal Nutrition
Cottonseed Oil Market segmented by Sales Channel:
- B2B Direct Industrial Food Manufacturers
- Retail Packaged Health Stores
- Online DTC Brands
Cottonseed Oil Market by Region
- North America
- United States
- Canada
- Latin America
- Brazil
- Mexico
- Argentina
- Chile
- Western Europe
- Germany
- France
- United Kingdom
- Italy
- Spain
- Benelux
- Nordics
- Norway
- Netherlands
- Eastern Europe
- Poland
- Czech Republic
- Romania
- Hungary
- East Asia
- China
- Japan
- South Korea
- South Asia and Pacific
- India
- ASEAN
- Australia and New Zealand
- Middle East and Africa
- GCC Countries
- South Africa
- Türkiye
- Israel
Research Sources and Bibliography
- [1] U.S. Department of Agriculture Economic Research Service. (2025, January 16). Oil Crops Yearbook: Cottonseed Crushing, Oil Production, and Disappearance. USDA Publications.
- [2] U.S. Department of Agriculture Foreign Agricultural Service. (2025, February 18). Oilseeds: World Markets and Trade. USDA FAS Circulars. https://www.usda.gov
- [3] Food and Agriculture Organization. (2025, March 20). Codex Alimentarius: Standard for Named Vegetable Oils. FAO Publications. https://www.fao.org
- [4] U.S. Food and Drug Administration. (2025, May 22). Requirements for Specific Standardized Edible Oils and Shortenings. FDA CFR Title 21. https://www.fda.gov
- [5] European Food Safety Authority. (2025, June 16). Scientific Opinion on Refining Processes and Thermal Stability of Food-Grade Vegetable Oils. EFSA Journal. https://www.efsa.europa.eu
- [6] American Oil Chemists' Society. (2025, August 14). Official Methods and Recommended Practices for Cottonseed Oil Analysis. AOCS Technical Guidelines.
- [7] Kerry Group plc. (2026, January 14). Nutritional Lipid and Carrier System Commercialization Strategy. Kerry Media Center.
- [8] International Edible Oil and Fat Association. (2025, October 18). Global Vegetable Oil Transport and Bulk Tanker Quality Protocols. FOSFA Reports.
- [9] Institute of Shortening and Edible Oils. (2025, November 12). Commercial Trends in Zero-Trans-Fat Bakery Shortening Formulations. ISEO Publications.
- [10] German Association of the Oilseed Crushing Industry. (2026, January 16). Annual Report on Vegetable Oil Processing and Industrial Fat Utilization. OVID Economic Data.
- [11] Norwegian Directorate of Fisheries. (2025, March 25). Alternative Lipids in Commercial Salmon Feeds: Quality and Sustainability Review. Fiskeridirektoratet Reports.
- [12] National Cottonseed Products Association. (2025, April 22). U.S. Cottonseed Products Industry Review and Commercial Shipments. NCPA Publications.
- [13] French National Federation of Oil Industries. (2025, May 28). Vegetable Oil Refining Output and Industrial Bakery Fat Markets in France. FNCG Reports.
- [14] Brazilian Association of Vegetable Oil Industries. (2025, June 18). Monthly Crushing and Oil Production Statistics. ABIOVE Reports.
- [15] Statistics Netherlands. (2025, July 24). International Trade and Processing of Vegetable Oils and Fats in Dutch Ports. CBS Statistical Releases.
- [16] Bunge Global SA. (2026, September 10). Commercial Deployment of Enzymatic Interesterification Line for Trans-Fat-Free Shortenings. Bunge Corporate News.
- [17] Cargill, Incorporated. (2026, June 18). High-Stability Frying Oil Distribution Expansion Announcement. Cargill Newsroom.
- [18] Archer Daniels Midland Company (ADM). (2026, April 14). Sustainable Edible Oil Refining Skid Modernization and Gossypol Filtration Deployment. ADM Press Room.
- [19] Ingredion Incorporated. (2025, October 24). Functional Lipid and Texture Ingredient Innovation for Commercial Baking. Ingredion News.
This bibliography is provided for reader reference and is not exhaustive. The full report contains the complete reference list and detailed citations.
This Report Answers
- How large is the cottonseed oil market in 2026 and what is forecast for 2036?
- Which commercial baking and frying requirements support steady demand for cottonseed oil?
- Why do fine powder & micronized crystals lead the form / physical state category?
- Why does conventional farm source lead the source / nature category globally?
- How do growth rates prominently differ across Germany, Norway, the USA, and the Netherlands?
- Which leading agribusiness companies supply bulk refined cottonseed oil and shortenings today?
- What limits raw seed availability or chemical refining expansion in the cottonseed oil market?
- What should commercial food processors evaluate deeply before purchasing cottonseed oil?
Table of Content
Table of Content
- Key Takeaways
- Market Size and CAGR
- Top Growth Driver
- Fastest Growing Segment
- Leading Region
- Key Companies
- Emerging Opportunities
- Executive Summary
- Global Market Outlook
- Demand-side Trends
- Supply-side Trends
- Technology Roadmap Analysis
- Analysis and Recommendations
- Analyst Perspective (What is happening? Why now? What should investors know?)
- Key Questions Answered
- How large is the market?
- What is the CAGR?
- What are key trends?
- Which region dominates?
- Who are the leaders?
Read More...
- Market Overview
- Market Coverage / Taxonomy
- Market Definition / Scope / Limitations
- Research Methodology
- Chapter Orientation
- Analytical Lens and Working Hypotheses
- Market Structure, Signals, and Trend Drivers
- Benchmarking and Cross-market Comparability
- Market Sizing, Forecasting, and Opportunity Mapping
- Research Design and Evidence Framework
- Desk Research Programme (Secondary Evidence)
- Expert Input and Fieldwork (Primary Evidence)
- Tooling, Models, and Reference Databases
- Data Engineering and Model Build
- Quality Assurance and Audit Trail
- Market Background
- Market Dynamics (Drivers, Restraints, Opportunity, Trends)
- Scenario Forecast (Optimistic, Likely, Conservative)
- Impact Analysis
- AI Impact
- Sustainability Impact
- Regulatory Impact
- Technology Impact
- Consumer / Buyer Analysis
- Purchase Drivers
- Adoption Barriers
- Buyer Journey
- Opportunity Map Analysis
- Product Life Cycle Analysis
- Supply Chain Analysis
- Investment Feasibility Matrix
- Value Chain Analysis
- PESTLE and Porter's Analysis
- Regulatory Landscape
- Regional Parent Market Outlook
- Production and Consumption Statistics
- Import and Export Statistics
- Global Market Analysis and Forecast, 2021 to 2036
- Historical Market Size Value (USD Billion) Analysis, 2021 to 2025
- Current and Future Market Size Value (USD Billion) Projections, 2026 to 2036
- Y-o-Y Growth Trend Analysis
- Absolute $ Opportunity Analysis
- Global Market Pricing Analysis, 2021 to 2036
- Global Market Analysis and Forecast, By Form / Physical State, 2021 to 2036
- Introduction / Key Findings
- Historical Market Size Value (USD Billion) Analysis By Form / Physical State, 2021 to 2025
- Current and Future Market Size Value (USD Billion) Analysis and Forecast By Form / Physical State, 2026 to 2036
- Fine Powder & Micronized Crystals
- Liquid Extract & Tincture
- Standardized Granules & Pellets
- Y-o-Y Growth Trend Analysis By Form / Physical State, 2021 to 2025
- Absolute $ Opportunity Analysis By Form / Physical State, 2026 to 2036
- Global Market Analysis and Forecast, By Source / Nature, 2021 to 2036
- Introduction / Key Findings
- Historical Market Size Value (USD Billion) Analysis By Source / Nature, 2021 to 2025
- Current and Future Market Size Value (USD Billion) Analysis and Forecast By Source / Nature, 2026 to 2036
- Conventional Farm Source
- Certified Organic & Non-GMO
- Fermentation / Bio-Synthesized
- Y-o-Y Growth Trend Analysis By Source / Nature, 2021 to 2025
- Absolute $ Opportunity Analysis By Source / Nature, 2026 to 2036
- Global Market Analysis and Forecast, By Application Sector, 2021 to 2036
- Introduction / Key Findings
- Historical Market Size Value (USD Billion) Analysis By Application Sector, 2021 to 2025
- Current and Future Market Size Value (USD Billion) Analysis and Forecast By Application Sector, 2026 to 2036
- Dietary Supplements & Nutraceuticals
- Functional Food & Beverages
- Cosmetics & Topical Personal Care
- Animal Nutrition
- Y-o-Y Growth Trend Analysis By Application Sector, 2021 to 2025
- Absolute $ Opportunity Analysis By Application Sector, 2026 to 2036
- Global Market Analysis and Forecast, By Sales Channel, 2021 to 2036
- Introduction / Key Findings
- Historical Market Size Value (USD Billion) Analysis By Sales Channel, 2021 to 2025
- Current and Future Market Size Value (USD Billion) Analysis and Forecast By Sales Channel, 2026 to 2036
- B2B Direct Industrial Food Manufacturers
- Retail Packaged Health Stores
- Online DTC Brands
- Y-o-Y Growth Trend Analysis By Sales Channel, 2021 to 2025
- Absolute $ Opportunity Analysis By Sales Channel, 2026 to 2036
- Global Market Analysis and Forecast, By Region, 2021 to 2036
- Introduction
- Historical Market Size Value (USD Billion) Analysis By Region, 2021 to 2025
- Current Market Size Value (USD Billion) Analysis and Forecast By Region, 2026 to 2036
- North America
- Latin America
- Western Europe
- Eastern Europe
- East Asia
- South Asia and Pacific
- Middle East and Africa
- Market Attractiveness Analysis By Region
- North America Market Analysis and Forecast, By Country, 2021 to 2036
- Historical Market Size Value (USD Billion) Trend Analysis By Market Taxonomy, 2021 to 2025
- Market Size Value (USD Billion) Forecast By Market Taxonomy, 2026 to 2036
- By Country
- United States
- Canada
- By Form / Physical State
- By Source / Nature
- By Application Sector
- By Sales Channel
- By Country
- Market Attractiveness Analysis
- By Country
- By Form / Physical State
- By Source / Nature
- By Application Sector
- By Sales Channel
- Key Takeaways
- Latin America Market Analysis and Forecast, By Country
- Historical Market Size Value (USD Billion) Trend Analysis By Market Taxonomy, 2021 to 2025
- Market Size Value (USD Billion) Forecast By Market Taxonomy, 2026 to 2036
- By Country
- Brazil
- Mexico
- Argentina
- Chile
- By Form / Physical State
- By Source / Nature
- By Application Sector
- By Sales Channel
- By Country
- Market Attractiveness Analysis
- By Country
- By Form / Physical State
- By Source / Nature
- By Application Sector
- By Sales Channel
- Key Takeaways
- Western Europe Market Analysis and Forecast, By Country
- Historical Market Size Value (USD Billion) Trend Analysis By Market Taxonomy, 2021 to 2025
- Market Size Value (USD Billion) Forecast By Market Taxonomy, 2026 to 2036
- By Country
- Germany
- France
- United Kingdom
- Italy
- Spain
- Benelux
- Nordics
- Norway
- Netherlands
- By Form / Physical State
- By Source / Nature
- By Application Sector
- By Sales Channel
- By Country
- Market Attractiveness Analysis
- By Country
- By Form / Physical State
- By Source / Nature
- By Application Sector
- By Sales Channel
- Key Takeaways
- Eastern Europe Market Analysis and Forecast, By Country
- Historical Market Size Value (USD Billion) Trend Analysis By Market Taxonomy, 2021 to 2025
- Market Size Value (USD Billion) Forecast By Market Taxonomy, 2026 to 2036
- By Country
- Poland
- Czech Republic
- Romania
- Hungary
- By Form / Physical State
- By Source / Nature
- By Application Sector
- By Sales Channel
- By Country
- Market Attractiveness Analysis
- By Country
- By Form / Physical State
- By Source / Nature
- By Application Sector
- By Sales Channel
- Key Takeaways
- East Asia Market Analysis and Forecast, By Country
- Historical Market Size Value (USD Billion) Trend Analysis By Market Taxonomy, 2021 to 2025
- Market Size Value (USD Billion) Forecast By Market Taxonomy, 2026 to 2036
- By Country
- China
- Japan
- South Korea
- By Form / Physical State
- By Source / Nature
- By Application Sector
- By Sales Channel
- By Country
- Market Attractiveness Analysis
- By Country
- By Form / Physical State
- By Source / Nature
- By Application Sector
- By Sales Channel
- Key Takeaways
- South Asia and Pacific Market Analysis and Forecast, By Country
- Historical Market Size Value (USD Billion) Trend Analysis By Market Taxonomy, 2021 to 2025
- Market Size Value (USD Billion) Forecast By Market Taxonomy, 2026 to 2036
- By Country
- India
- ASEAN
- Australia and New Zealand
- By Form / Physical State
- By Source / Nature
- By Application Sector
- By Sales Channel
- By Country
- Market Attractiveness Analysis
- By Country
- By Form / Physical State
- By Source / Nature
- By Application Sector
- By Sales Channel
- Key Takeaways
- Middle East and Africa Market Analysis and Forecast, By Country
- Historical Market Size Value (USD Billion) Trend Analysis By Market Taxonomy, 2021 to 2025
- Market Size Value (USD Billion) Forecast By Market Taxonomy, 2026 to 2036
- By Country
- GCC Countries
- South Africa
- Türkiye
- Israel
- By Form / Physical State
- By Source / Nature
- By Application Sector
- By Sales Channel
- By Country
- Market Attractiveness Analysis
- By Country
- By Form / Physical State
- By Source / Nature
- By Application Sector
- By Sales Channel
- Key Takeaways
- Key Countries Market Analysis
- United States
- Pricing Analysis
- Market Share Analysis, 2025
- By Form / Physical State
- By Source / Nature
- By Application Sector
- By Sales Channel
- Canada
- Pricing Analysis
- Market Share Analysis, 2025
- By Form / Physical State
- By Source / Nature
- By Application Sector
- By Sales Channel
- Mexico
- Pricing Analysis
- Market Share Analysis, 2025
- By Form / Physical State
- By Source / Nature
- By Application Sector
- By Sales Channel
- Brazil
- Pricing Analysis
- Market Share Analysis, 2025
- By Form / Physical State
- By Source / Nature
- By Application Sector
- By Sales Channel
- Chile
- Pricing Analysis
- Market Share Analysis, 2025
- By Form / Physical State
- By Source / Nature
- By Application Sector
- By Sales Channel
- Germany
- Pricing Analysis
- Market Share Analysis, 2025
- By Form / Physical State
- By Source / Nature
- By Application Sector
- By Sales Channel
- United Kingdom
- Pricing Analysis
- Market Share Analysis, 2025
- By Form / Physical State
- By Source / Nature
- By Application Sector
- By Sales Channel
- Italy
- Pricing Analysis
- Market Share Analysis, 2025
- By Form / Physical State
- By Source / Nature
- By Application Sector
- By Sales Channel
- Spain
- Pricing Analysis
- Market Share Analysis, 2025
- By Form / Physical State
- By Source / Nature
- By Application Sector
- By Sales Channel
- France
- Pricing Analysis
- Market Share Analysis, 2025
- By Form / Physical State
- By Source / Nature
- By Application Sector
- By Sales Channel
- India
- Pricing Analysis
- Market Share Analysis, 2025
- By Form / Physical State
- By Source / Nature
- By Application Sector
- By Sales Channel
- ASEAN
- Pricing Analysis
- Market Share Analysis, 2025
- By Form / Physical State
- By Source / Nature
- By Application Sector
- By Sales Channel
- Australia and New Zealand
- Pricing Analysis
- Market Share Analysis, 2025
- By Form / Physical State
- By Source / Nature
- By Application Sector
- By Sales Channel
- China
- Pricing Analysis
- Market Share Analysis, 2025
- By Form / Physical State
- By Source / Nature
- By Application Sector
- By Sales Channel
- Japan
- Pricing Analysis
- Market Share Analysis, 2025
- By Form / Physical State
- By Source / Nature
- By Application Sector
- By Sales Channel
- South Korea
- Pricing Analysis
- Market Share Analysis, 2025
- By Form / Physical State
- By Source / Nature
- By Application Sector
- By Sales Channel
- Poland
- Pricing Analysis
- Market Share Analysis, 2025
- By Form / Physical State
- By Source / Nature
- By Application Sector
- By Sales Channel
- Hungary
- Pricing Analysis
- Market Share Analysis, 2025
- By Form / Physical State
- By Source / Nature
- By Application Sector
- By Sales Channel
- Türkiye
- Pricing Analysis
- Market Share Analysis, 2025
- By Form / Physical State
- By Source / Nature
- By Application Sector
- By Sales Channel
- South Africa
- Pricing Analysis
- Market Share Analysis, 2025
- By Form / Physical State
- By Source / Nature
- By Application Sector
- By Sales Channel
- Norway
- Pricing Analysis
- Market Share Analysis, 2025
- By Form / Physical State
- By Source / Nature
- By Application Sector
- By Sales Channel
- Netherlands
- Pricing Analysis
- Market Share Analysis, 2025
- By Form / Physical State
- By Source / Nature
- By Application Sector
- By Sales Channel
- United States
- Market Structure Analysis
- Competition Dashboard
- Competition Benchmarking
- Market Share Analysis of Top Players
- By Regional
- By Form / Physical State
- By Source / Nature
- By Application Sector
- By Sales Channel
- Emerging Startups
- Innovation Benchmarking
- Competition Analysis
- Competition Deep Dive
- Archer Daniels Midland Company (ADM)
- Overview
- Product Portfolio
- Profitability by Market Segments
- Sales Footprint
- Strategy Overview
- Marketing Strategy
- Product Strategy
- Channel Strategy
- Bunge Global SA
- Cargill, Incorporated
- Ingredion Incorporated
- Roquette Freres
- Tate & Lyle PLC
- Kerry Group plc
- DSM-Firmenich
- Givaudan SA
- International Flavors & Fragrances (IFF)
- Archer Daniels Midland Company (ADM)
- Case Studies
- Success Stories
- Recent Developments
- Competition Deep Dive
- Assumptions & Acronyms Used
List of Tables
- Table 1: Global Market Value (USD Billion) Forecast by Region, 2021 to 2036
- Table 2: Global Market Value (USD Billion) Forecast by Form / Physical State, 2021 to 2036
- Table 3: Global Market Value (USD Billion) Forecast by Source / Nature, 2021 to 2036
- Table 4: Global Market Value (USD Billion) Forecast by Application Sector, 2021 to 2036
- Table 5: Global Market Value (USD Billion) Forecast by Sales Channel, 2021 to 2036
- Table 6: North America Market Value (USD Billion) Forecast by Country, 2021 to 2036
- Table 7: North America Market Value (USD Billion) Forecast by Form / Physical State, 2021 to 2036
- Table 8: North America Market Value (USD Billion) Forecast by Source / Nature, 2021 to 2036
- Table 9: North America Market Value (USD Billion) Forecast by Application Sector, 2021 to 2036
- Table 10: North America Market Value (USD Billion) Forecast by Sales Channel, 2021 to 2036
- Table 11: Latin America Market Value (USD Billion) Forecast by Country, 2021 to 2036
- Table 12: Latin America Market Value (USD Billion) Forecast by Form / Physical State, 2021 to 2036
- Table 13: Latin America Market Value (USD Billion) Forecast by Source / Nature, 2021 to 2036
- Table 14: Latin America Market Value (USD Billion) Forecast by Application Sector, 2021 to 2036
- Table 15: Latin America Market Value (USD Billion) Forecast by Sales Channel, 2021 to 2036
- Table 16: Western Europe Market Value (USD Billion) Forecast by Country, 2021 to 2036
- Table 17: Western Europe Market Value (USD Billion) Forecast by Form / Physical State, 2021 to 2036
- Table 18: Western Europe Market Value (USD Billion) Forecast by Source / Nature, 2021 to 2036
- Table 19: Western Europe Market Value (USD Billion) Forecast by Application Sector, 2021 to 2036
- Table 20: Western Europe Market Value (USD Billion) Forecast by Sales Channel, 2021 to 2036
- Table 21: Eastern Europe Market Value (USD Billion) Forecast by Country, 2021 to 2036
- Table 22: Eastern Europe Market Value (USD Billion) Forecast by Form / Physical State, 2021 to 2036
- Table 23: Eastern Europe Market Value (USD Billion) Forecast by Source / Nature, 2021 to 2036
- Table 24: Eastern Europe Market Value (USD Billion) Forecast by Application Sector, 2021 to 2036
- Table 25: Eastern Europe Market Value (USD Billion) Forecast by Sales Channel, 2021 to 2036
- Table 26: East Asia Market Value (USD Billion) Forecast by Country, 2021 to 2036
- Table 27: East Asia Market Value (USD Billion) Forecast by Form / Physical State, 2021 to 2036
- Table 28: East Asia Market Value (USD Billion) Forecast by Source / Nature, 2021 to 2036
- Table 29: East Asia Market Value (USD Billion) Forecast by Application Sector, 2021 to 2036
- Table 30: East Asia Market Value (USD Billion) Forecast by Sales Channel, 2021 to 2036
- Table 31: South Asia and Pacific Market Value (USD Billion) Forecast by Country, 2021 to 2036
- Table 32: South Asia and Pacific Market Value (USD Billion) Forecast by Form / Physical State, 2021 to 2036
- Table 33: South Asia and Pacific Market Value (USD Billion) Forecast by Source / Nature, 2021 to 2036
- Table 34: South Asia and Pacific Market Value (USD Billion) Forecast by Application Sector, 2021 to 2036
- Table 35: South Asia and Pacific Market Value (USD Billion) Forecast by Sales Channel, 2021 to 2036
- Table 36: Middle East and Africa Market Value (USD Billion) Forecast by Country, 2021 to 2036
- Table 37: Middle East and Africa Market Value (USD Billion) Forecast by Form / Physical State, 2021 to 2036
- Table 38: Middle East and Africa Market Value (USD Billion) Forecast by Source / Nature, 2021 to 2036
- Table 39: Middle East and Africa Market Value (USD Billion) Forecast by Application Sector, 2021 to 2036
- Table 40: Middle East and Africa Market Value (USD Billion) Forecast by Sales Channel, 2021 to 2036
List of Figures
- Figure 1: Global Market Pricing Analysis
- Figure 2: Global Market Value (USD Billion) Forecast 2021-2036
- Figure 3: Global Market Value Share and BPS Analysis by Form / Physical State, 2026 and 2036
- Figure 4: Global Market Y-o-Y Growth Comparison by Form / Physical State, 2026-2036
- Figure 5: Global Market Attractiveness Analysis by Form / Physical State
- Figure 6: Global Market Value Share and BPS Analysis by Source / Nature, 2026 and 2036
- Figure 7: Global Market Y-o-Y Growth Comparison by Source / Nature, 2026-2036
- Figure 8: Global Market Attractiveness Analysis by Source / Nature
- Figure 9: Global Market Value Share and BPS Analysis by Application Sector, 2026 and 2036
- Figure 10: Global Market Y-o-Y Growth Comparison by Application Sector, 2026-2036
- Figure 11: Global Market Attractiveness Analysis by Application Sector
- Figure 12: Global Market Value Share and BPS Analysis by Sales Channel, 2026 and 2036
- Figure 13: Global Market Y-o-Y Growth Comparison by Sales Channel, 2026-2036
- Figure 14: Global Market Attractiveness Analysis by Sales Channel
- Figure 15: Global Market Value (USD Billion) Share and BPS Analysis by Region, 2026 and 2036
- Figure 16: Global Market Y-o-Y Growth Comparison by Region, 2026-2036
- Figure 17: Global Market Attractiveness Analysis by Region
- Figure 18: North America Market Incremental Dollar Opportunity, 2026-2036
- Figure 19: Latin America Market Incremental Dollar Opportunity, 2026-2036
- Figure 20: Western Europe Market Incremental Dollar Opportunity, 2026-2036
- Figure 21: Eastern Europe Market Incremental Dollar Opportunity, 2026-2036
- Figure 22: East Asia Market Incremental Dollar Opportunity, 2026-2036
- Figure 23: South Asia and Pacific Market Incremental Dollar Opportunity, 2026-2036
- Figure 24: Middle East and Africa Market Incremental Dollar Opportunity, 2026-2036
- Figure 25: North America Market Value Share and BPS Analysis by Country, 2026 and 2036
- Figure 26: North America Market Value Share and BPS Analysis by Form / Physical State, 2026 and 2036
- Figure 27: North America Market Y-o-Y Growth Comparison by Form / Physical State, 2026-2036
- Figure 28: North America Market Attractiveness Analysis by Form / Physical State
- Figure 29: North America Market Value Share and BPS Analysis by Source / Nature, 2026 and 2036
- Figure 30: North America Market Y-o-Y Growth Comparison by Source / Nature, 2026-2036
- Figure 31: North America Market Attractiveness Analysis by Source / Nature
- Figure 32: North America Market Value Share and BPS Analysis by Application Sector, 2026 and 2036
- Figure 33: North America Market Y-o-Y Growth Comparison by Application Sector, 2026-2036
- Figure 34: North America Market Attractiveness Analysis by Application Sector
- Figure 35: North America Market Value Share and BPS Analysis by Sales Channel, 2026 and 2036
- Figure 36: North America Market Y-o-Y Growth Comparison by Sales Channel, 2026-2036
- Figure 37: North America Market Attractiveness Analysis by Sales Channel
- Figure 38: Latin America Market Value Share and BPS Analysis by Country, 2026 and 2036
- Figure 39: Latin America Market Value Share and BPS Analysis by Form / Physical State, 2026 and 2036
- Figure 40: Latin America Market Y-o-Y Growth Comparison by Form / Physical State, 2026-2036
- Figure 41: Latin America Market Attractiveness Analysis by Form / Physical State
- Figure 42: Latin America Market Value Share and BPS Analysis by Source / Nature, 2026 and 2036
- Figure 43: Latin America Market Y-o-Y Growth Comparison by Source / Nature, 2026-2036
- Figure 44: Latin America Market Attractiveness Analysis by Source / Nature
- Figure 45: Latin America Market Value Share and BPS Analysis by Application Sector, 2026 and 2036
- Figure 46: Latin America Market Y-o-Y Growth Comparison by Application Sector, 2026-2036
- Figure 47: Latin America Market Attractiveness Analysis by Application Sector
- Figure 48: Latin America Market Value Share and BPS Analysis by Sales Channel, 2026 and 2036
- Figure 49: Latin America Market Y-o-Y Growth Comparison by Sales Channel, 2026-2036
- Figure 50: Latin America Market Attractiveness Analysis by Sales Channel
- Figure 51: Western Europe Market Value Share and BPS Analysis by Country, 2026 and 2036
- Figure 52: Western Europe Market Value Share and BPS Analysis by Form / Physical State, 2026 and 2036
- Figure 53: Western Europe Market Y-o-Y Growth Comparison by Form / Physical State, 2026-2036
- Figure 54: Western Europe Market Attractiveness Analysis by Form / Physical State
- Figure 55: Western Europe Market Value Share and BPS Analysis by Source / Nature, 2026 and 2036
- Figure 56: Western Europe Market Y-o-Y Growth Comparison by Source / Nature, 2026-2036
- Figure 57: Western Europe Market Attractiveness Analysis by Source / Nature
- Figure 58: Western Europe Market Value Share and BPS Analysis by Application Sector, 2026 and 2036
- Figure 59: Western Europe Market Y-o-Y Growth Comparison by Application Sector, 2026-2036
- Figure 60: Western Europe Market Attractiveness Analysis by Application Sector
- Figure 61: Western Europe Market Value Share and BPS Analysis by Sales Channel, 2026 and 2036
- Figure 62: Western Europe Market Y-o-Y Growth Comparison by Sales Channel, 2026-2036
- Figure 63: Western Europe Market Attractiveness Analysis by Sales Channel
- Figure 64: Eastern Europe Market Value Share and BPS Analysis by Country, 2026 and 2036
- Figure 65: Eastern Europe Market Value Share and BPS Analysis by Form / Physical State, 2026 and 2036
- Figure 66: Eastern Europe Market Y-o-Y Growth Comparison by Form / Physical State, 2026-2036
- Figure 67: Eastern Europe Market Attractiveness Analysis by Form / Physical State
- Figure 68: Eastern Europe Market Value Share and BPS Analysis by Source / Nature, 2026 and 2036
- Figure 69: Eastern Europe Market Y-o-Y Growth Comparison by Source / Nature, 2026-2036
- Figure 70: Eastern Europe Market Attractiveness Analysis by Source / Nature
- Figure 71: Eastern Europe Market Value Share and BPS Analysis by Application Sector, 2026 and 2036
- Figure 72: Eastern Europe Market Y-o-Y Growth Comparison by Application Sector, 2026-2036
- Figure 73: Eastern Europe Market Attractiveness Analysis by Application Sector
- Figure 74: Eastern Europe Market Value Share and BPS Analysis by Sales Channel, 2026 and 2036
- Figure 75: Eastern Europe Market Y-o-Y Growth Comparison by Sales Channel, 2026-2036
- Figure 76: Eastern Europe Market Attractiveness Analysis by Sales Channel
- Figure 77: East Asia Market Value Share and BPS Analysis by Country, 2026 and 2036
- Figure 78: East Asia Market Value Share and BPS Analysis by Form / Physical State, 2026 and 2036
- Figure 79: East Asia Market Y-o-Y Growth Comparison by Form / Physical State, 2026-2036
- Figure 80: East Asia Market Attractiveness Analysis by Form / Physical State
- Figure 81: East Asia Market Value Share and BPS Analysis by Source / Nature, 2026 and 2036
- Figure 82: East Asia Market Y-o-Y Growth Comparison by Source / Nature, 2026-2036
- Figure 83: East Asia Market Attractiveness Analysis by Source / Nature
- Figure 84: East Asia Market Value Share and BPS Analysis by Application Sector, 2026 and 2036
- Figure 85: East Asia Market Y-o-Y Growth Comparison by Application Sector, 2026-2036
- Figure 86: East Asia Market Attractiveness Analysis by Application Sector
- Figure 87: East Asia Market Value Share and BPS Analysis by Sales Channel, 2026 and 2036
- Figure 88: East Asia Market Y-o-Y Growth Comparison by Sales Channel, 2026-2036
- Figure 89: East Asia Market Attractiveness Analysis by Sales Channel
- Figure 90: South Asia and Pacific Market Value Share and BPS Analysis by Country, 2026 and 2036
- Figure 91: South Asia and Pacific Market Value Share and BPS Analysis by Form / Physical State, 2026 and 2036
- Figure 92: South Asia and Pacific Market Y-o-Y Growth Comparison by Form / Physical State, 2026-2036
- Figure 93: South Asia and Pacific Market Attractiveness Analysis by Form / Physical State
- Figure 94: South Asia and Pacific Market Value Share and BPS Analysis by Source / Nature, 2026 and 2036
- Figure 95: South Asia and Pacific Market Y-o-Y Growth Comparison by Source / Nature, 2026-2036
- Figure 96: South Asia and Pacific Market Attractiveness Analysis by Source / Nature
- Figure 97: South Asia and Pacific Market Value Share and BPS Analysis by Application Sector, 2026 and 2036
- Figure 98: South Asia and Pacific Market Y-o-Y Growth Comparison by Application Sector, 2026-2036
- Figure 99: South Asia and Pacific Market Attractiveness Analysis by Application Sector
- Figure 100: South Asia and Pacific Market Value Share and BPS Analysis by Sales Channel, 2026 and 2036
- Figure 101: South Asia and Pacific Market Y-o-Y Growth Comparison by Sales Channel, 2026-2036
- Figure 102: South Asia and Pacific Market Attractiveness Analysis by Sales Channel
- Figure 103: Middle East and Africa Market Value Share and BPS Analysis by Country, 2026 and 2036
- Figure 104: Middle East and Africa Market Value Share and BPS Analysis by Form / Physical State, 2026 and 2036
- Figure 105: Middle East and Africa Market Y-o-Y Growth Comparison by Form / Physical State, 2026-2036
- Figure 106: Middle East and Africa Market Attractiveness Analysis by Form / Physical State
- Figure 107: Middle East and Africa Market Value Share and BPS Analysis by Source / Nature, 2026 and 2036
- Figure 108: Middle East and Africa Market Y-o-Y Growth Comparison by Source / Nature, 2026-2036
- Figure 109: Middle East and Africa Market Attractiveness Analysis by Source / Nature
- Figure 110: Middle East and Africa Market Value Share and BPS Analysis by Application Sector, 2026 and 2036
- Figure 111: Middle East and Africa Market Y-o-Y Growth Comparison by Application Sector, 2026-2036
- Figure 112: Middle East and Africa Market Attractiveness Analysis by Application Sector
- Figure 113: Middle East and Africa Market Value Share and BPS Analysis by Sales Channel, 2026 and 2036
- Figure 114: Middle East and Africa Market Y-o-Y Growth Comparison by Sales Channel, 2026-2036
- Figure 115: Middle East and Africa Market Attractiveness Analysis by Sales Channel
- Figure 116: Global Market - Tier Structure Analysis
- Figure 117: Global Market - Company Share Analysis
Frequently Asked Questions
How big is the cottonseed oil market in 2026, and what is forecast for 2036?
Future Market Insights estimates that the global cottonseed oil market will reach USD 4.8 Billion in 2026. The market is projected to reach USD 7.0 Billion by 2036, driven by consistent commercial demand for high-temperature frying oil and structured bakery shortenings.
What is the CAGR for the cottonseed oil market from 2026 to 2036?
As per FMI, the market is projected to expand at a 3.8% CAGR over the assessment period. Growth is supported by ongoing product formulation into trans-fat-free bakery shortenings and natural tocopherol carrier lipids.
Which form / physical state segment leads the cottonseed oil market?
Future Market Insights projects that fine powder & micronized crystals will hold 45.1% share in 2026. The segment benefits from solid-fat beta-prime crystal stabilization in commercial pastry doughs, high melting points, and reliable structural firmness.
Which source / nature segment leads the cottonseed oil market?
Oilseed industry research indicates that conventional farm source will account for 56.8% share in 2026. Demand is supported by established mechanical harvesting infrastructure, integrated ginning mills, and competitive bulk pricing.
Which country has a notable growth outlook during the assessment period?
FMI finds that Germany is projected to register a 4.6% CAGR from 2026 to 2036. High market growth is supported by industrial bakery demand for non-hydrogenated pastry fats, specialty food processing, and advanced enzymatic fat interesterification.
Who are the key players in the market?
Key participants include Bunge Global SA, Archer Daniels Midland Company (ADM), Cargill, Incorporated, Kerry Group plc, Ingredion Incorporated, Tate & Lyle PLC, DSM-Firmenich, International Flavors & Fragrances (IFF), Givaudan SA, and Roquette Freres. Leading market participants focus on automated chemical refining, enzymatic interesterification, and dedicated bulk railcar logistics.
Preview the report firsthand - request a free sample
Get SampleGet the brochure for pricing and purchase details.
Get PDF
