Service Delivery Automation Market Size and Share Forecast Outlook 2025 to 2035

The Service Delivery Automation Market is estimated to be valued at USD 39.0 billion in 2025 and is projected to reach USD 434.2 billion by 2035, registering a compound annual growth rate (CAGR) of 27.3% over the forecast period.
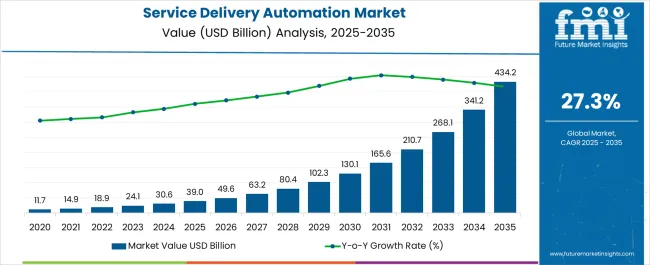
Quick Stats for Service Delivery Automation Market

  • Service Delivery Automation Market Value (2025): USD 39.0 billion
  • Service Delivery Automation Market Forecast Value (2035): USD 434.2 billion
  • Service Delivery Automation Market Forecast CAGR: 27.3%
  • Leading Segment in Service Delivery Automation Market in 2025: Software (58.3%)
  • Key Growth Regions in Service Delivery Automation Market: North America, Asia-Pacific, Europe
  • Top Key Players in Service Delivery Automation Market: UiPath SRL, Automation Anywhere Inc., IBM Corporation, Blue Prism Ltd, NICE Ltd, IPsoft Inc., Xerox Holdings Corporation, Celaton Limited, Arago GmbH, Accenture plc, AutomationEdge Technologies, Pegasystems Inc., Microsoft Corporation, SAP SE, ServiceNow Inc., WorkFusion Inc., Kofax Inc.

Service Delivery Automation Market Market Value Analysis

Service Delivery Automation Market Key Takeaways

Metric Value
Service Delivery Automation Market Estimated Value in (2025 E) USD 39.0 billion
Service Delivery Automation Market Forecast Value in (2035 F) USD 434.2 billion
Forecast CAGR (2025 to 2035) 27.3%

Why is the Service Delivery Automation Market Growing?

The Service Delivery Automation market is expanding rapidly as enterprises prioritize efficiency, accuracy, and scalability in operations. Businesses are adopting automation technologies to reduce human error, minimize costs, and accelerate service delivery cycles. The growing shift toward digital transformation, coupled with heightened demand for enhanced customer experience, is fueling adoption across industries.

Advancements in artificial intelligence, robotic process automation, and machine learning are enabling organizations to handle repetitive and rule-based tasks more efficiently while freeing employees to focus on strategic responsibilities. Integration with cloud platforms and analytics solutions is further strengthening automation’s role in enterprise workflows. The rising focus on compliance, risk management, and data security is also encouraging companies to deploy structured automation systems that ensure transparency and accountability.

In addition, heightened competition across industries is prompting enterprises to optimize resource utilization and streamline processes to maintain agility As enterprises worldwide increasingly invest in next-generation technologies, the Service Delivery Automation market is expected to witness sustained growth, establishing itself as a critical enabler of operational excellence and digital innovation.

Segmental Analysis

The service delivery automation market is segmented by component, end-user, vertical, and geographic regions. By component, service delivery automation market is divided into Software and Services. In terms of end-user, service delivery automation market is classified into Large Scale Enterprises and SMEs. Based on vertical, service delivery automation market is segmented into BFSI, IT And Telecommunications, Healthcare, Retail, Energy And Utilities, Transportation, Manufacturing, and Others. Regionally, the service delivery automation industry is classified into North America, Latin America, Western Europe, Eastern Europe, Balkan & Baltic Countries, Russia & Belarus, Central Asia, East Asia, South Asia & Pacific, and the Middle East & Africa.
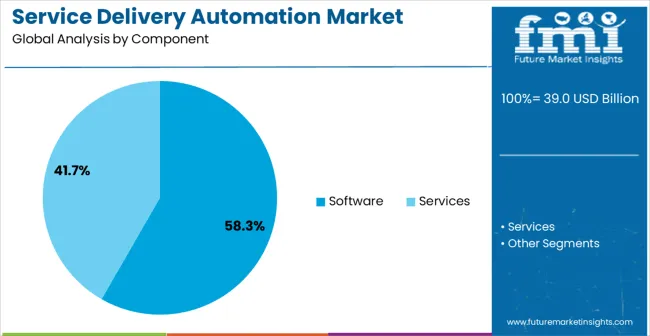
Insights into the Software Component Segment

Service Delivery Automation Market Analysis By Component

The software component segment is projected to account for 58.3% of the Service Delivery Automation market revenue in 2025, positioning it as the dominant component category. This leadership is being driven by the increasing deployment of automation platforms that streamline repetitive tasks, reduce costs, and enhance consistency in service delivery. Software solutions enable real-time process monitoring, analytics, and integration with enterprise systems such as CRM, ERP, and HRM platforms.

The adoption of artificial intelligence and robotic process automation within these solutions is allowing businesses to manage complex workflows with greater efficiency and flexibility. Enterprises are also leveraging automation software to ensure compliance with industry standards and regulatory requirements, minimizing the risk of operational errors.

The ability of software-based platforms to scale according to organizational needs while providing measurable returns on investment is a significant contributor to their growth As businesses increasingly demand comprehensive and adaptable automation tools, the software segment is expected to maintain its dominance, supported by continuous innovation and integration with advanced digital ecosystems.
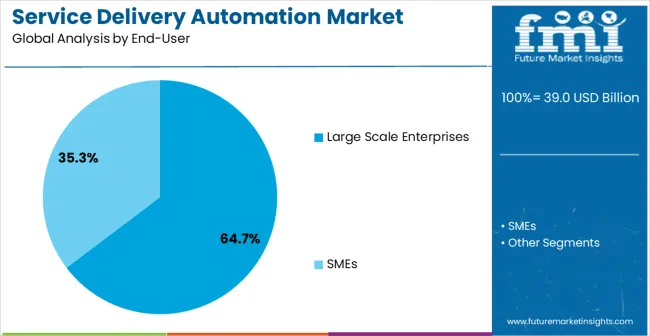
Insights into the Large Scale Enterprises End-User Segment

Service Delivery Automation Market Analysis By End User

The large scale enterprises segment is expected to hold 64.7% of the Service Delivery Automation market revenue in 2025, making it the leading end-user category. This dominance is being driven by the complex operational structures and high transaction volumes of large enterprises, which require advanced automation for efficiency and scalability. By adopting automation, large enterprises are reducing manual intervention in routine tasks, thereby cutting costs and improving accuracy.

Automation platforms also enable large enterprises to enhance compliance, improve service delivery times, and strengthen customer engagement by streamlining back-office and front-office operations. The increasing use of robotic process automation and AI-powered solutions is enabling large organizations to handle large datasets and complex processes seamlessly. Furthermore, global enterprises are using automation to drive digital transformation initiatives, ensure operational resilience, and remain competitive in dynamic markets.

The scale of resources and the capacity to invest in cutting-edge solutions position large enterprises as the primary adopters of automation technologies Consequently, the large scale enterprises segment is set to maintain its leadership role, supported by sustained investment and a growing emphasis on enterprise-wide automation strategies.
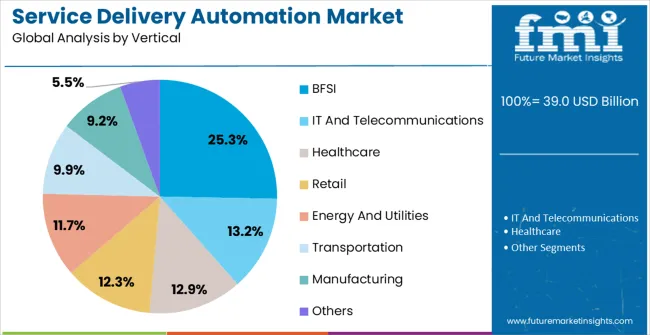
Insights into the BFSI Vertical Segment

Service Delivery Automation Market Analysis By Vertical

The BFSI vertical segment is projected to capture 25.3% of the Service Delivery Automation market revenue in 2025, establishing itself as the leading vertical. This dominance is being reinforced by the sector’s reliance on high-volume, rule-based transactions such as loan processing, claims handling, customer onboarding, and fraud detection. Automation technologies enable BFSI organizations to improve accuracy, reduce operational costs, and comply with stringent regulatory requirements while managing large data flows.

The integration of artificial intelligence and robotic process automation into BFSI workflows allows for faster decision-making and improved customer experience, particularly in areas such as digital banking and insurance services. The sector is also leveraging automation to enhance risk management, ensure data security, and achieve higher transparency in reporting and compliance. As customer expectations shift toward instant and personalized services, automation is enabling BFSI firms to remain competitive and agile.

Continuous advancements in analytics, fraud detection algorithms, and cloud-based automation platforms are further strengthening adoption As a result, the BFSI segment is anticipated to sustain its leadership in driving revenue growth within the Service Delivery Automation market.

Market Overview

Service Delivery Automation Market Overview

Companies across different verticals are constantly trying to find out new areas through which they can reduce their total operational costs. Service delivery automation is one such area via which this objective can be achieved. Service delivery automation basically refers to replacement of manpower with technology in order to reduce operational costs and eliminate human error and thus achieve additional benefits.

Gradually service delivery automation vendors will either form strategic partnerships with technology leaders in order to combine their products with latest technologies or some service delivery automation vendors will develop technologies on their own and automate their products accordingly to compete with technology vendors.
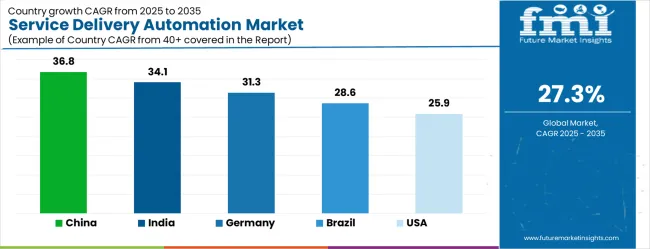
Analysis of Service Delivery Automation Market By Key Countries

Service Delivery Automation Market Cagr Analysis By Country

Country CAGR
China 36.8%
India 34.1%
Germany 31.3%
Brazil 28.6%
USA 25.9%
UK 23.2%
Japan 20.4%

Country-wise Analysis

The Service Delivery Automation Market is expected to register a CAGR of 27.3% during the forecast period, exhibiting varied country level momentum. China leads with the highest CAGR of 36.8%, followed by India at 34.1%. Developed markets such as Germany, France, and the UK continue to expand steadily, while the USA is likely to grow at consistent rates. Japan posts the lowest CAGR at 20.4%, yet still underscores a broadly positive trajectory for the global Service Delivery Automation Market. In 2024, Germany held a dominant revenue in the Western Europe market and is expected to grow with a CAGR of 31.3%. The USA Service Delivery Automation Market is estimated to be valued at USD 14.0 billion in 2025 and is anticipated to reach a valuation of USD 14.0 billion by 2035. Sales are projected to rise at a CAGR of 0.0% over the forecast period between 2025 and 2035. While Japan and South Korea markets are estimated to be valued at USD 2.0 billion and USD 1.1 billion respectively in 2025.
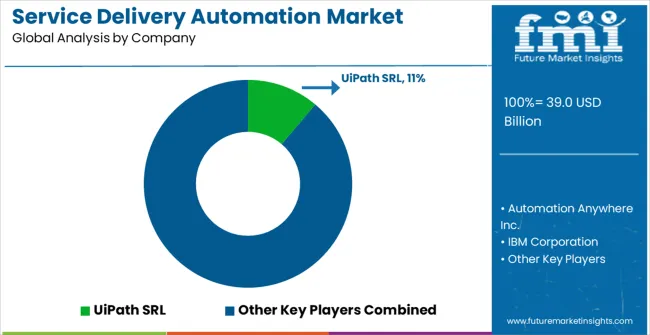
Key Players in the Service Delivery Automation Market

Service Delivery Automation Market Analysis By Company

  • UiPath SRL
  • Automation Anywhere Inc.
  • IBM Corporation
  • Blue Prism Ltd
  • NICE Ltd
  • IPsoft Inc.
  • Xerox Holdings Corporation
  • Celaton Limited
  • Arago GmbH
  • Accenture plc
  • AutomationEdge Technologies
  • Pegasystems Inc.
  • Microsoft Corporation
  • SAP SE
  • ServiceNow Inc.
  • WorkFusion Inc.
  • Kofax Inc.

Scope of the Report

Item Value
Quantitative Units USD 39.0 Billion
Component Software and Services
End-User Large Scale Enterprises and SMEs
Vertical BFSI, IT And Telecommunications, Healthcare, Retail, Energy And Utilities, Transportation, Manufacturing, and Others
Regions Covered North America, Europe, Asia-Pacific, Latin America, Middle East & Africa
Country Covered United States, Canada, Germany, France, United Kingdom, China, Japan, India, Brazil, South Africa
Key Companies Profiled UiPath SRL, Automation Anywhere Inc., IBM Corporation, Blue Prism Ltd, NICE Ltd, IPsoft Inc., Xerox Holdings Corporation, Celaton Limited, Arago GmbH, Accenture plc, AutomationEdge Technologies, Pegasystems Inc., Microsoft Corporation, SAP SE, ServiceNow Inc., WorkFusion Inc., and Kofax Inc.

Service Delivery Automation Market by Segments

Component:

  • Software
  • Services

End-User:

  • Large Scale Enterprises
  • SMEs

Vertical:

  • BFSI
  • IT And Telecommunications
  • Healthcare
  • Retail
  • Energy And Utilities
  • Transportation
  • Manufacturing
  • Others

Region:

  • North America
    • USA
    • Canada
    • Mexico
  • Latin America
    • Brazil
    • Chile
    • Rest of Latin America
  • Western Europe
    • Germany
    • UK
    • Italy
    • Spain
    • France
    • Nordic
    • BENELUX
    • Rest of Western Europe
  • Eastern Europe
    • Russia
    • Poland
    • Hungary
    • Balkan & Baltic
    • Rest of Eastern Europe
  • East Asia
    • China
    • Japan
    • South Korea
  • South Asia and Pacific
    • India
    • ASEAN
    • Australia & New Zealand
    • Rest of South Asia and Pacific
  • Middle East & Africa
    • Kingdom of Saudi Arabia
    • Other GCC Countries
    • Turkiye
    • South Africa
    • Other African Union
    • Rest of Middle East & Africa

Frequently Asked Questions

How big is the service delivery automation market in 2025?

The global service delivery automation market is estimated to be valued at USD 39.0 billion in 2025.

What will be the size of service delivery automation market in 2035?

The market size for the service delivery automation market is projected to reach USD 434.2 billion by 2035.

How much will be the service delivery automation market growth between 2025 and 2035?

The service delivery automation market is expected to grow at a 27.3% CAGR between 2025 and 2035.

What are the key product types in the service delivery automation market?

The key product types in service delivery automation market are software and services.

Which end-user segment to contribute significant share in the service delivery automation market in 2025?

In terms of end-user, large scale enterprises segment to command 64.7% share in the service delivery automation market in 2025.

Table of Content

  1. Executive Summary
    • Global Market Outlook
    • Demand-side Trends
    • Supply-side Trends
    • Technology Roadmap Analysis
    • Analysis and Recommendations
  2. Market Overview
    • Market Coverage / Taxonomy
    • Market Definition / Scope / Limitations
  3. Market Background
    • Market Dynamics
      • Drivers
      • Restraints
      • Opportunity
      • Trends
    • Scenario Forecast
      • Demand in Optimistic Scenario
      • Demand in Likely Scenario
      • Demand in Conservative Scenario
    • Opportunity Map Analysis
    • Product Life Cycle Analysis
    • Supply Chain Analysis
    • Investment Feasibility Matrix
    • Value Chain Analysis
    • PESTLE and Porter’s Analysis
    • Regulatory Landscape
    • Regional Parent Market Outlook
    • Production and Consumption Statistics
    • Import and Export Statistics
  4. Global Market Analysis 2020 to 2024 and Forecast, 2025 to 2035
    • Historical Market Size Value (USD Million) Analysis, 2020 to 2024
    • Current and Future Market Size Value (USD Million) Projections, 2025 to 2035
      • Y-o-Y Growth Trend Analysis
      • Absolute $ Opportunity Analysis
  5. Global Market Pricing Analysis 2020 to 2024 and Forecast 2025 to 2035
  6. Global Market Analysis 2020 to 2024 and Forecast 2025 to 2035, By Component
    • Introduction / Key Findings
    • Historical Market Size Value (USD Million) Analysis By Component , 2020 to 2024
    • Current and Future Market Size Value (USD Million) Analysis and Forecast By Component , 2025 to 2035
      • Software
      • Services
    • Y-o-Y Growth Trend Analysis By Component , 2020 to 2024
    • Absolute $ Opportunity Analysis By Component , 2025 to 2035
  7. Global Market Analysis 2020 to 2024 and Forecast 2025 to 2035, By End-User
    • Introduction / Key Findings
    • Historical Market Size Value (USD Million) Analysis By End-User, 2020 to 2024
    • Current and Future Market Size Value (USD Million) Analysis and Forecast By End-User, 2025 to 2035
      • Large Scale Enterprises
      • SMEs
    • Y-o-Y Growth Trend Analysis By End-User, 2020 to 2024
    • Absolute $ Opportunity Analysis By End-User, 2025 to 2035
  8. Global Market Analysis 2020 to 2024 and Forecast 2025 to 2035, By Vertical
    • Introduction / Key Findings
    • Historical Market Size Value (USD Million) Analysis By Vertical, 2020 to 2024
    • Current and Future Market Size Value (USD Million) Analysis and Forecast By Vertical, 2025 to 2035
      • BFSI
      • IT And Telecommunications
      • Healthcare
      • Retail
      • Energy And Utilities
      • Transportation
      • Manufacturing
      • Others
    • Y-o-Y Growth Trend Analysis By Vertical, 2020 to 2024
    • Absolute $ Opportunity Analysis By Vertical, 2025 to 2035
  9. Global Market Analysis 2020 to 2024 and Forecast 2025 to 2035, By Region
    • Introduction
    • Historical Market Size Value (USD Million) Analysis By Region, 2020 to 2024
    • Current Market Size Value (USD Million) Analysis and Forecast By Region, 2025 to 2035
      • North America
      • Latin America
      • Western Europe
      • Eastern Europe
      • East Asia
      • South Asia and Pacific
      • Middle East & Africa
    • Market Attractiveness Analysis By Region
  10. North America Market Analysis 2020 to 2024 and Forecast 2025 to 2035, By Country
    • Historical Market Size Value (USD Million) Trend Analysis By Market Taxonomy, 2020 to 2024
    • Market Size Value (USD Million) Forecast By Market Taxonomy, 2025 to 2035
      • By Country
        • USA
        • Canada
        • Mexico
      • By Component
      • By End-User
      • By Vertical
    • Market Attractiveness Analysis
      • By Country
      • By Component
      • By End-User
      • By Vertical
    • Key Takeaways
  11. Latin America Market Analysis 2020 to 2024 and Forecast 2025 to 2035, By Country
    • Historical Market Size Value (USD Million) Trend Analysis By Market Taxonomy, 2020 to 2024
    • Market Size Value (USD Million) Forecast By Market Taxonomy, 2025 to 2035
      • By Country
        • Brazil
        • Chile
        • Rest of Latin America
      • By Component
      • By End-User
      • By Vertical
    • Market Attractiveness Analysis
      • By Country
      • By Component
      • By End-User
      • By Vertical
    • Key Takeaways
  12. Western Europe Market Analysis 2020 to 2024 and Forecast 2025 to 2035, By Country
    • Historical Market Size Value (USD Million) Trend Analysis By Market Taxonomy, 2020 to 2024
    • Market Size Value (USD Million) Forecast By Market Taxonomy, 2025 to 2035
      • By Country
        • Germany
        • UK
        • Italy
        • Spain
        • France
        • Nordic
        • BENELUX
        • Rest of Western Europe
      • By Component
      • By End-User
      • By Vertical
    • Market Attractiveness Analysis
      • By Country
      • By Component
      • By End-User
      • By Vertical
    • Key Takeaways
  13. Eastern Europe Market Analysis 2020 to 2024 and Forecast 2025 to 2035, By Country
    • Historical Market Size Value (USD Million) Trend Analysis By Market Taxonomy, 2020 to 2024
    • Market Size Value (USD Million) Forecast By Market Taxonomy, 2025 to 2035
      • By Country
        • Russia
        • Poland
        • Hungary
        • Balkan & Baltic
        • Rest of Eastern Europe
      • By Component
      • By End-User
      • By Vertical
    • Market Attractiveness Analysis
      • By Country
      • By Component
      • By End-User
      • By Vertical
    • Key Takeaways
  14. East Asia Market Analysis 2020 to 2024 and Forecast 2025 to 2035, By Country
    • Historical Market Size Value (USD Million) Trend Analysis By Market Taxonomy, 2020 to 2024
    • Market Size Value (USD Million) Forecast By Market Taxonomy, 2025 to 2035
      • By Country
        • China
        • Japan
        • South Korea
      • By Component
      • By End-User
      • By Vertical
    • Market Attractiveness Analysis
      • By Country
      • By Component
      • By End-User
      • By Vertical
    • Key Takeaways
  15. South Asia and Pacific Market Analysis 2020 to 2024 and Forecast 2025 to 2035, By Country
    • Historical Market Size Value (USD Million) Trend Analysis By Market Taxonomy, 2020 to 2024
    • Market Size Value (USD Million) Forecast By Market Taxonomy, 2025 to 2035
      • By Country
        • India
        • ASEAN
        • Australia & New Zealand
        • Rest of South Asia and Pacific
      • By Component
      • By End-User
      • By Vertical
    • Market Attractiveness Analysis
      • By Country
      • By Component
      • By End-User
      • By Vertical
    • Key Takeaways
  16. Middle East & Africa Market Analysis 2020 to 2024 and Forecast 2025 to 2035, By Country
    • Historical Market Size Value (USD Million) Trend Analysis By Market Taxonomy, 2020 to 2024
    • Market Size Value (USD Million) Forecast By Market Taxonomy, 2025 to 2035
      • By Country
        • Kingdom of Saudi Arabia
        • Other GCC Countries
        • Turkiye
        • South Africa
        • Other African Union
        • Rest of Middle East & Africa
      • By Component
      • By End-User
      • By Vertical
    • Market Attractiveness Analysis
      • By Country
      • By Component
      • By End-User
      • By Vertical
    • Key Takeaways
  17. Key Countries Market Analysis
    • USA
      • Pricing Analysis
      • Market Share Analysis, 2024
        • By Component
        • By End-User
        • By Vertical
    • Canada
      • Pricing Analysis
      • Market Share Analysis, 2024
        • By Component
        • By End-User
        • By Vertical
    • Mexico
      • Pricing Analysis
      • Market Share Analysis, 2024
        • By Component
        • By End-User
        • By Vertical
    • Brazil
      • Pricing Analysis
      • Market Share Analysis, 2024
        • By Component
        • By End-User
        • By Vertical
    • Chile
      • Pricing Analysis
      • Market Share Analysis, 2024
        • By Component
        • By End-User
        • By Vertical
    • Germany
      • Pricing Analysis
      • Market Share Analysis, 2024
        • By Component
        • By End-User
        • By Vertical
    • UK
      • Pricing Analysis
      • Market Share Analysis, 2024
        • By Component
        • By End-User
        • By Vertical
    • Italy
      • Pricing Analysis
      • Market Share Analysis, 2024
        • By Component
        • By End-User
        • By Vertical
    • Spain
      • Pricing Analysis
      • Market Share Analysis, 2024
        • By Component
        • By End-User
        • By Vertical
    • France
      • Pricing Analysis
      • Market Share Analysis, 2024
        • By Component
        • By End-User
        • By Vertical
    • India
      • Pricing Analysis
      • Market Share Analysis, 2024
        • By Component
        • By End-User
        • By Vertical
    • ASEAN
      • Pricing Analysis
      • Market Share Analysis, 2024
        • By Component
        • By End-User
        • By Vertical
    • Australia & New Zealand
      • Pricing Analysis
      • Market Share Analysis, 2024
        • By Component
        • By End-User
        • By Vertical
    • China
      • Pricing Analysis
      • Market Share Analysis, 2024
        • By Component
        • By End-User
        • By Vertical
    • Japan
      • Pricing Analysis
      • Market Share Analysis, 2024
        • By Component
        • By End-User
        • By Vertical
    • South Korea
      • Pricing Analysis
      • Market Share Analysis, 2024
        • By Component
        • By End-User
        • By Vertical
    • Russia
      • Pricing Analysis
      • Market Share Analysis, 2024
        • By Component
        • By End-User
        • By Vertical
    • Poland
      • Pricing Analysis
      • Market Share Analysis, 2024
        • By Component
        • By End-User
        • By Vertical
    • Hungary
      • Pricing Analysis
      • Market Share Analysis, 2024
        • By Component
        • By End-User
        • By Vertical
    • Kingdom of Saudi Arabia
      • Pricing Analysis
      • Market Share Analysis, 2024
        • By Component
        • By End-User
        • By Vertical
    • Turkiye
      • Pricing Analysis
      • Market Share Analysis, 2024
        • By Component
        • By End-User
        • By Vertical
    • South Africa
      • Pricing Analysis
      • Market Share Analysis, 2024
        • By Component
        • By End-User
        • By Vertical
  18. Market Structure Analysis
    • Competition Dashboard
    • Competition Benchmarking
    • Market Share Analysis of Top Players
      • By Regional
      • By Component
      • By End-User
      • By Vertical
  19. Competition Analysis
    • Competition Deep Dive
      • UiPath SRL
        • Overview
        • Product Portfolio
        • Profitability by Market Segments (Product/Age /Sales Channel/Region)
        • Sales Footprint
        • Strategy Overview
          • Marketing Strategy
          • Product Strategy
          • Channel Strategy
      • Automation Anywhere Inc.
      • IBM Corporation
      • Blue Prism Ltd
      • NICE Ltd
      • IPsoft Inc.
      • Xerox Holdings Corporation
      • Celaton Limited
      • Arago GmbH
      • Accenture plc
      • AutomationEdge Technologies
      • Pegasystems Inc.
      • Microsoft Corporation
      • SAP SE
      • ServiceNow Inc.
      • WorkFusion Inc.
      • Kofax Inc.
  20. Assumptions & Acronyms Used
  21. Research Methodology

List of Tables

  • Table 1: Global Market Value (USD Million) Forecast by Region, 2020 to 2035
  • Table 2: Global Market Value (USD Million) Forecast by Component , 2020 to 2035
  • Table 3: Global Market Value (USD Million) Forecast by End-User, 2020 to 2035
  • Table 4: Global Market Value (USD Million) Forecast by Vertical, 2020 to 2035
  • Table 5: North America Market Value (USD Million) Forecast by Country, 2020 to 2035
  • Table 6: North America Market Value (USD Million) Forecast by Component , 2020 to 2035
  • Table 7: North America Market Value (USD Million) Forecast by End-User, 2020 to 2035
  • Table 8: North America Market Value (USD Million) Forecast by Vertical, 2020 to 2035
  • Table 9: Latin America Market Value (USD Million) Forecast by Country, 2020 to 2035
  • Table 10: Latin America Market Value (USD Million) Forecast by Component , 2020 to 2035
  • Table 11: Latin America Market Value (USD Million) Forecast by End-User, 2020 to 2035
  • Table 12: Latin America Market Value (USD Million) Forecast by Vertical, 2020 to 2035
  • Table 13: Western Europe Market Value (USD Million) Forecast by Country, 2020 to 2035
  • Table 14: Western Europe Market Value (USD Million) Forecast by Component , 2020 to 2035
  • Table 15: Western Europe Market Value (USD Million) Forecast by End-User, 2020 to 2035
  • Table 16: Western Europe Market Value (USD Million) Forecast by Vertical, 2020 to 2035
  • Table 17: Eastern Europe Market Value (USD Million) Forecast by Country, 2020 to 2035
  • Table 18: Eastern Europe Market Value (USD Million) Forecast by Component , 2020 to 2035
  • Table 19: Eastern Europe Market Value (USD Million) Forecast by End-User, 2020 to 2035
  • Table 20: Eastern Europe Market Value (USD Million) Forecast by Vertical, 2020 to 2035
  • Table 21: East Asia Market Value (USD Million) Forecast by Country, 2020 to 2035
  • Table 22: East Asia Market Value (USD Million) Forecast by Component , 2020 to 2035
  • Table 23: East Asia Market Value (USD Million) Forecast by End-User, 2020 to 2035
  • Table 24: East Asia Market Value (USD Million) Forecast by Vertical, 2020 to 2035
  • Table 25: South Asia and Pacific Market Value (USD Million) Forecast by Country, 2020 to 2035
  • Table 26: South Asia and Pacific Market Value (USD Million) Forecast by Component , 2020 to 2035
  • Table 27: South Asia and Pacific Market Value (USD Million) Forecast by End-User, 2020 to 2035
  • Table 28: South Asia and Pacific Market Value (USD Million) Forecast by Vertical, 2020 to 2035
  • Table 29: Middle East & Africa Market Value (USD Million) Forecast by Country, 2020 to 2035
  • Table 30: Middle East & Africa Market Value (USD Million) Forecast by Component , 2020 to 2035
  • Table 31: Middle East & Africa Market Value (USD Million) Forecast by End-User, 2020 to 2035
  • Table 32: Middle East & Africa Market Value (USD Million) Forecast by Vertical, 2020 to 2035

List of Figures

  • Figure 1: Global Market Pricing Analysis
  • Figure 2: Global Market Value (USD Million) Forecast 2020 to 2035
  • Figure 3: Global Market Value Share and BPS Analysis by Component , 2025 and 2035
  • Figure 4: Global Market Y-o-Y Growth Comparison by Component , 2025 to 2035
  • Figure 5: Global Market Attractiveness Analysis by Component
  • Figure 6: Global Market Value Share and BPS Analysis by End-User, 2025 and 2035
  • Figure 7: Global Market Y-o-Y Growth Comparison by End-User, 2025 to 2035
  • Figure 8: Global Market Attractiveness Analysis by End-User
  • Figure 9: Global Market Value Share and BPS Analysis by Vertical, 2025 and 2035
  • Figure 10: Global Market Y-o-Y Growth Comparison by Vertical, 2025 to 2035
  • Figure 11: Global Market Attractiveness Analysis by Vertical
  • Figure 12: Global Market Value (USD Million) Share and BPS Analysis by Region, 2025 and 2035
  • Figure 13: Global Market Y-o-Y Growth Comparison by Region, 2025 to 2035
  • Figure 14: Global Market Attractiveness Analysis by Region
  • Figure 15: North America Market Incremental Dollar Opportunity, 2025 to 2035
  • Figure 16: Latin America Market Incremental Dollar Opportunity, 2025 to 2035
  • Figure 17: Western Europe Market Incremental Dollar Opportunity, 2025 to 2035
  • Figure 18: Eastern Europe Market Incremental Dollar Opportunity, 2025 to 2035
  • Figure 19: East Asia Market Incremental Dollar Opportunity, 2025 to 2035
  • Figure 20: South Asia and Pacific Market Incremental Dollar Opportunity, 2025 to 2035
  • Figure 21: Middle East & Africa Market Incremental Dollar Opportunity, 2025 to 2035
  • Figure 22: North America Market Value Share and BPS Analysis by Country, 2025 and 2035
  • Figure 23: North America Market Value Share and BPS Analysis by Component , 2025 and 2035
  • Figure 24: North America Market Y-o-Y Growth Comparison by Component , 2025 to 2035
  • Figure 25: North America Market Attractiveness Analysis by Component
  • Figure 26: North America Market Value Share and BPS Analysis by End-User, 2025 and 2035
  • Figure 27: North America Market Y-o-Y Growth Comparison by End-User, 2025 to 2035
  • Figure 28: North America Market Attractiveness Analysis by End-User
  • Figure 29: North America Market Value Share and BPS Analysis by Vertical, 2025 and 2035
  • Figure 30: North America Market Y-o-Y Growth Comparison by Vertical, 2025 to 2035
  • Figure 31: North America Market Attractiveness Analysis by Vertical
  • Figure 32: Latin America Market Value Share and BPS Analysis by Country, 2025 and 2035
  • Figure 33: Latin America Market Value Share and BPS Analysis by Component , 2025 and 2035
  • Figure 34: Latin America Market Y-o-Y Growth Comparison by Component , 2025 to 2035
  • Figure 35: Latin America Market Attractiveness Analysis by Component
  • Figure 36: Latin America Market Value Share and BPS Analysis by End-User, 2025 and 2035
  • Figure 37: Latin America Market Y-o-Y Growth Comparison by End-User, 2025 to 2035
  • Figure 38: Latin America Market Attractiveness Analysis by End-User
  • Figure 39: Latin America Market Value Share and BPS Analysis by Vertical, 2025 and 2035
  • Figure 40: Latin America Market Y-o-Y Growth Comparison by Vertical, 2025 to 2035
  • Figure 41: Latin America Market Attractiveness Analysis by Vertical
  • Figure 42: Western Europe Market Value Share and BPS Analysis by Country, 2025 and 2035
  • Figure 43: Western Europe Market Value Share and BPS Analysis by Component , 2025 and 2035
  • Figure 44: Western Europe Market Y-o-Y Growth Comparison by Component , 2025 to 2035
  • Figure 45: Western Europe Market Attractiveness Analysis by Component
  • Figure 46: Western Europe Market Value Share and BPS Analysis by End-User, 2025 and 2035
  • Figure 47: Western Europe Market Y-o-Y Growth Comparison by End-User, 2025 to 2035
  • Figure 48: Western Europe Market Attractiveness Analysis by End-User
  • Figure 49: Western Europe Market Value Share and BPS Analysis by Vertical, 2025 and 2035
  • Figure 50: Western Europe Market Y-o-Y Growth Comparison by Vertical, 2025 to 2035
  • Figure 51: Western Europe Market Attractiveness Analysis by Vertical
  • Figure 52: Eastern Europe Market Value Share and BPS Analysis by Country, 2025 and 2035
  • Figure 53: Eastern Europe Market Value Share and BPS Analysis by Component , 2025 and 2035
  • Figure 54: Eastern Europe Market Y-o-Y Growth Comparison by Component , 2025 to 2035
  • Figure 55: Eastern Europe Market Attractiveness Analysis by Component
  • Figure 56: Eastern Europe Market Value Share and BPS Analysis by End-User, 2025 and 2035
  • Figure 57: Eastern Europe Market Y-o-Y Growth Comparison by End-User, 2025 to 2035
  • Figure 58: Eastern Europe Market Attractiveness Analysis by End-User
  • Figure 59: Eastern Europe Market Value Share and BPS Analysis by Vertical, 2025 and 2035
  • Figure 60: Eastern Europe Market Y-o-Y Growth Comparison by Vertical, 2025 to 2035
  • Figure 61: Eastern Europe Market Attractiveness Analysis by Vertical
  • Figure 62: East Asia Market Value Share and BPS Analysis by Country, 2025 and 2035
  • Figure 63: East Asia Market Value Share and BPS Analysis by Component , 2025 and 2035
  • Figure 64: East Asia Market Y-o-Y Growth Comparison by Component , 2025 to 2035
  • Figure 65: East Asia Market Attractiveness Analysis by Component
  • Figure 66: East Asia Market Value Share and BPS Analysis by End-User, 2025 and 2035
  • Figure 67: East Asia Market Y-o-Y Growth Comparison by End-User, 2025 to 2035
  • Figure 68: East Asia Market Attractiveness Analysis by End-User
  • Figure 69: East Asia Market Value Share and BPS Analysis by Vertical, 2025 and 2035
  • Figure 70: East Asia Market Y-o-Y Growth Comparison by Vertical, 2025 to 2035
  • Figure 71: East Asia Market Attractiveness Analysis by Vertical
  • Figure 72: South Asia and Pacific Market Value Share and BPS Analysis by Country, 2025 and 2035
  • Figure 73: South Asia and Pacific Market Value Share and BPS Analysis by Component , 2025 and 2035
  • Figure 74: South Asia and Pacific Market Y-o-Y Growth Comparison by Component , 2025 to 2035
  • Figure 75: South Asia and Pacific Market Attractiveness Analysis by Component
  • Figure 76: South Asia and Pacific Market Value Share and BPS Analysis by End-User, 2025 and 2035
  • Figure 77: South Asia and Pacific Market Y-o-Y Growth Comparison by End-User, 2025 to 2035
  • Figure 78: South Asia and Pacific Market Attractiveness Analysis by End-User
  • Figure 79: South Asia and Pacific Market Value Share and BPS Analysis by Vertical, 2025 and 2035
  • Figure 80: South Asia and Pacific Market Y-o-Y Growth Comparison by Vertical, 2025 to 2035
  • Figure 81: South Asia and Pacific Market Attractiveness Analysis by Vertical
  • Figure 82: Middle East & Africa Market Value Share and BPS Analysis by Country, 2025 and 2035
  • Figure 83: Middle East & Africa Market Value Share and BPS Analysis by Component , 2025 and 2035
  • Figure 84: Middle East & Africa Market Y-o-Y Growth Comparison by Component , 2025 to 2035
  • Figure 85: Middle East & Africa Market Attractiveness Analysis by Component
  • Figure 86: Middle East & Africa Market Value Share and BPS Analysis by End-User, 2025 and 2035
  • Figure 87: Middle East & Africa Market Y-o-Y Growth Comparison by End-User, 2025 to 2035
  • Figure 88: Middle East & Africa Market Attractiveness Analysis by End-User
  • Figure 89: Middle East & Africa Market Value Share and BPS Analysis by Vertical, 2025 and 2035
  • Figure 90: Middle East & Africa Market Y-o-Y Growth Comparison by Vertical, 2025 to 2035
  • Figure 91: Middle East & Africa Market Attractiveness Analysis by Vertical
  • Figure 92: Global Market – Tier Structure Analysis
  • Figure 93: Global Market – Company Share Analysis
Dashboard
Dashboard
Dashboard
Dashboard
Dashboard
Dashboard

Full Research Suite comprises of:

Market outlook & trends analysis

Market outlook & trends analysis

Interviews & case studies

Interviews & case studies

Strategic recommendations

Strategic recommendations

Vendor profiles & capabilities analysis

Vendor profiles & capabilities analysis

5-year forecasts

5-year forecasts

8 regions and 60+ country-level data splits

8 regions and 60+ country-level data splits

Market segment data splits

Market segment data splits

12 months of continuous data updates

12 months of continuous data updates

DELIVERED AS:

PDF EXCEL ONLINE

Full Research Suite


$5000

$7500

$10000

Buy Report Now
Similar Industry Reports

Similar Industry Reports

Service Lifecycle Management Application Market

Service Lifecycle Management Application Market Size and Share Forecast Outlook 2025 to 2035

ServiceNow Tech Service Market

ServiceNow Tech Service Market Size and Share Forecast Outlook 2025 to 2035

Service Orchestration Market

Service Orchestration Market Size and Share Forecast Outlook 2025 to 2035

Service Robotics Market

Service Robotics Market Size and Share Forecast Outlook 2025 to 2035

Service Trucks Market

Service Trucks Market Size and Share Forecast Outlook 2025 to 2035

Service Resource Planning (SRP) SaaS Solutions Market

Service Resource Planning (SRP) SaaS Solutions Market Size and Share Forecast Outlook 2025 to 2035

Service Bureau Market

Service Bureau Market Analysis - Size, Growth, and Forecast 2025 to 2035

Service Laboratory Market

Service Laboratory Market Analysis by Service Type, Deployment, Channel, End-user, and Region Through 2035

Service Integration and Management Market

Service Integration & Management Market Report – Forecast 2017-2027

IT Service Management Tools Market

IT Service Management Tools Market Growth – Trends & Forecast through 2034

Foodservice Equipment Market

Foodservice Equipment Market Analysis - Size, Share, and Forecast Outlook 2025 to 2035

Foodservice Paper Bag Market

Foodservice Paper Bag Market Size and Share Forecast Outlook 2025 to 2035

B2B Services Review Platforms Market

B2B Services Review Platforms Market Size and Share Forecast Outlook 2025 to 2035

Bot Services Market
Bot Services Market

Bot Services Market Size and Share Forecast Outlook 2025 to 2035

Spa Services Market
Spa Services Market

Spa Services Market Size and Share Forecast Outlook 2025 to 2035

Foodservice paper bag Market Share Analysis

Competitive Overview of Foodservice Paper Bag Companies

Foodservice Disposables Industry Analysis in Europe

Europe Foodservice Disposables Market Insights – Growth & Trends 2024-2034

M2M Services Market
M2M Services Market

M2M Services Market – Trends & Forecast through 2034

Foodservice Disposable Market

Foodservice Disposable Market Growth & Trends Forecast 2024-2034

Self-service Analytics Market

Self-service Analytics Market Size and Share Forecast Outlook 2025 to 2035

Future Market Insights

Service Delivery Automation Market

Chat With MaRIA

Chat With

MaRIA

Hi There, I am MaRIA, Your Market Research Intelligence Assistant. How may I help you?