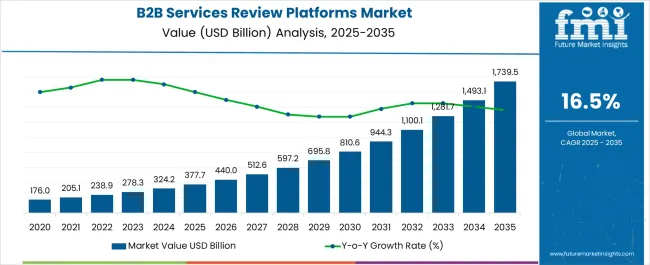
The B2B Services Review Platforms Market is estimated to be valued at USD 377.7 billion in 2025 and is projected to reach USD 1739.5 billion by 2035, registering a compound annual growth rate (CAGR) of 16.5% over the forecast period.

| Metric | Value |
|---|---|
| B2B Services Review Platforms Market Estimated Value in (2025 E) | USD 377.7 billion |
| B2B Services Review Platforms Market Forecast Value in (2035 F) | USD 1739.5 billion |
| Forecast CAGR (2025 to 2035) | 16.5% |
The B2B services review platforms market is expanding steadily as enterprises increasingly depend on verified digital platforms to evaluate service providers, enhance vendor transparency, and strengthen decision making. Growing adoption of digital transformation strategies has heightened the demand for platforms that provide authentic peer reviews and industry insights.
Regulatory focus on data accuracy and the rising importance of trust in B2B partnerships are also accelerating adoption. Continuous advancements in AI driven analytics, content moderation, and user verification processes are further enhancing platform credibility.
Additionally, the increasing complexity of enterprise service procurement, combined with heightened competition among service providers, has reinforced the role of review platforms as critical tools for reputation management. The outlook remains positive as organizations prioritize data driven purchasing decisions, accountability, and value optimization in vendor selection processes.

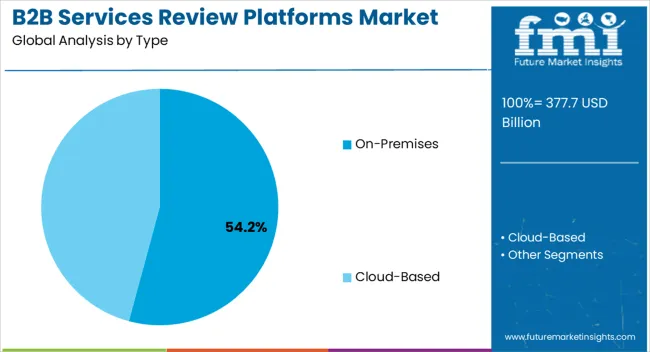
The on premises segment is projected to hold 54.20% of total revenue by 2025 within the type category, making it the leading segment. This dominance is attributed to heightened concerns over data security, compliance requirements, and the need for enterprises to maintain direct control over sensitive review data.
On premises platforms enable organizations to safeguard proprietary information, meet industry specific regulatory mandates, and tailor systems to align with internal IT infrastructure. Large enterprises in particular value the scalability, reliability, and integration flexibility offered by this model.
As cybersecurity threats intensify and data governance frameworks become more stringent, the preference for on premises deployment has been reinforced, sustaining its leadership position in the type segment.

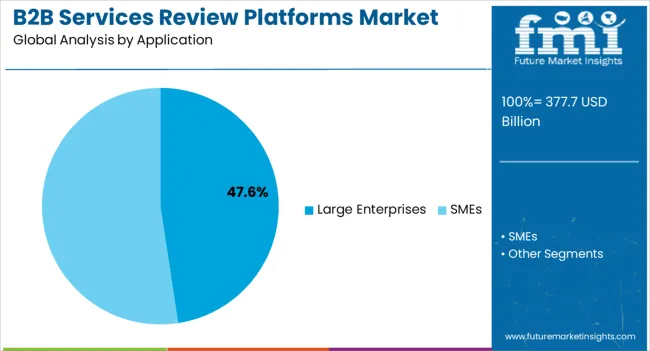
The large enterprises segment is expected to capture 47.60% of overall market revenue by 2025, positioning it as the dominant application area. This growth is driven by the scale and complexity of vendor management processes in large organizations, where informed purchasing decisions are crucial to operational efficiency and cost optimization.
Large enterprises allocate significant budgets toward third party services, creating a pressing need for transparent and credible review mechanisms. The ability of review platforms to streamline procurement, reduce risk, and enhance accountability has made them indispensable in this segment.
Furthermore, integration with enterprise resource planning systems and customer relationship management tools has enhanced adoption levels. As large organizations continue to prioritize structured vendor evaluation and reputation management, their reliance on B2B services review platforms is expected to strengthen further, ensuring sustained leadership of this application segment.
The global market for B2B services review platforms marked a CAGR of 13.8% over the last seven years. In 2025, the global market size of B2B services review platforms was valued at USD 377.7 million and is estimated to reach a valuation of USD 278.3 million in 2025. B2B services review platforms provide an authentic and valid review for business-to-business operations.
The number of users of smartphones and the internet has increased intrinsically over the years, which helped the users to review any kind of product or service easily, which is fueling the growth of the B2B services review platforms market.
Customers nowadays largely rely on reviews and comments to buy a product or avail of a solution from previous users who already have availed of the product or the services. Thus, the B2B services review platform plays a crucial role in deciding consumer behavior toward any type of product or service, which is expected to fuel market expansion in the coming years.
The global B2B services review platforms market is predicted to mark a CAGR of 13.8% and sales worth USD 1,016.6 million by the end of 2035. The United States is projected to continue to be the leading procurer of B2B services review platforms throughout the analysis period accounting for over USD 222.8 million absolute dollar opportunity in the coming 10-year-epoch.
The need for service providers to expand their business and presence in the market is driving the demand for B2B service review platforms. A trusted and verified review of their services and solutions is going to help the enterprises to choose the right service and solution that is projected to fit perfectly in their business model.
Businesses of any size including small, medium, and large enterprises are using B2B services review platforms for branding and spreading their services and solutions. These factors are expected to drive the B2B services review platforms market over the forecasted years.
| Region | North America |
|---|---|
| Market Share % (2025) | 28.8% |
The B2B services review platform market in North America was valued at around USD 377.7 million in 2025 and is estimated to reach a valuation of USD 377.7 million in 2025. The significant technological advancement and adoption of new technology is the key factor that is driving the market in North America. The B2B services review platform has anticipated reaching a valuation of USD 360.7 million over the forecast period.
| Countries | Market CAGR % (2025 to 2035) |
|---|---|
| China | 15.5% |
| India | 16.5% |
The market in Asia Pacific has anticipated to grow at a notable rate over the forecast period. The B2B services review platforms market in Asia Pacific was valued at around USD 47.7 million in 2025 and is estimated to reach a valuation of more than USD 60.1 million in 2025.
Technological developments in design-related technologies, internet marketing, and promotion, and technology-based solutions are the key factors driving the market in the region.
China holds a significant proportion of the market in the Asia Pacific region. The B2B services review platforms market in China was valued at above USD 16.1 million in 2025 and is estimated to reach a valuation of more than USD 19.8 million in 2025.
According to the China Network Information Centre (CNNIC), there are about 900 million internet users in China with 30.8 hours of average internet usage. The B2B services review platforms market in China is anticipated to reach a valuation of more than USD 67.8 million by the end of the forecast period. Additionally, the market in China is expected to create an absolute dollar opportunity of more than USD 48 million over the 2025 to 2035 period.
| Region | CAGR |
|---|---|
| Europe’s Market Share % (2025) | 21.3% |
| Germany’s Market Share % (2025) | 7.6% |
| The United Kingdom’s Forecast CAGR % | 12.3% |
The B2B services review platforms market in Europe is anticipated to expand at a modest rate over the forecast period. The market in Europe was valued at more than USD 49.5 million in 2025 and is anticipated to be valued at more than USD 1739.5 million by the end of 2035.
The B2B services review platforms market in the United Kingdom was valued at around USD 9.3 million in 2025. According to research, every one in three SMEs in Britain showed sales increase due to customer reviews.
Some of the SMEs state that they have been using software solutions to collect reviews. This has been the key driver for market expansion in the United Kingdom. The B2B service review platforms market in the United Kingdom is forecasted to reach a valuation of more than USD 37.2 million by the end of 2035.
The United Kingdom market for B2B services review platforms is expected to create an absolute dollar opportunity of more than USD 25.9 million over the 2025 to 2035 period.
| Country | The United States |
|---|---|
| Market Share % (2025) | 16.5% |
The market in the United States was valued at more than USD 377.7 million in 2025 and is estimated to reach a valuation of USD 377.7 million in 2025. The market in the United States is likely to reach a valuation of more than USD 310.9 million by the end of the forecast period. Moreover, the significant advancement in technology and its fast adoption is the key factor driving the market in the country.
| Segment | Large Enterprises |
|---|---|
| Market Share % (2025) | 61.2% |
The B2B services review platforms make it simple for businesses and customers to gather useful information about the solutions and services through verified trusted reviews on the platform. Enterprises need to adopt the latest technology-based solutions and implement them in their business process.
The B2B services review platforms assist companies to find, acquire and manage technological solutions, which help the enterprises to achieve their financial objectives and improve their client and business relationship. The B2B services review platforms offer real-time user reviews, which encourage enterprises to make better choices. Moreover, the large enterprise segment accounted for a CAGR of 26.6% from 2020 to 2025.
The SMEs segment is anticipated to expand at a notable rate over the forecast period. The rising number of SMEs around the world is the key factor driving revenue growth through SMEs. Also, the B2B services review helps the SMEs to bring technological advances and upgrades in their existing solutions and offerings, which is driving the demand for B2B services, and review platforms among the SMEs.

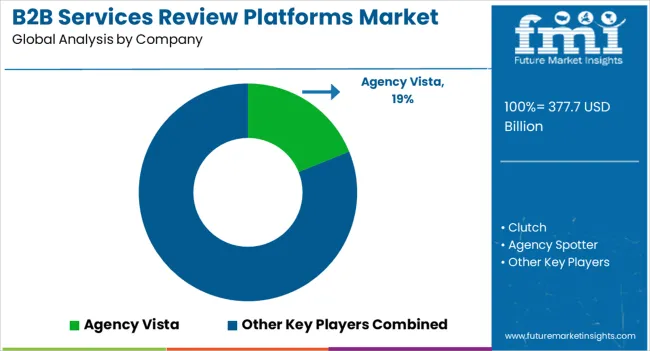
The key companies operating in the B2B services review platforms market include Agency Vista, Clutch, Agency Spotter, UpCity, HubSpot Agency Directory, G2.com, GoodFirms, Sortlist, CrowdReviews, Procurated, Serv B2B Marketplace, Techreviewer, TheManifest, Reputedfirms, and Capterra.
Recent Developments by Key Providers of B2B Services Review Platforms:
The global B2B services review platforms market is estimated to be valued at USD 377.7 billion in 2025.
The market size for the B2B services review platforms market is projected to reach USD 1,739.5 billion by 2035.
The B2B services review platforms market is expected to grow at a 16.5% CAGR between 2025 and 2035.
The key product types in B2B services review platforms market are on-premises and cloud-based.
In terms of application, large enterprises segment to command 47.6% share in the B2B services review platforms market in 2025.


Full Research Suite comprises of:
Market outlook & trends analysis
Interviews & case studies
Strategic recommendations
Vendor profiles & capabilities analysis
5-year forecasts
8 regions and 60+ country-level data splits
Market segment data splits
12 months of continuous data updates
DELIVERED AS:
PDF EXCEL ONLINE
B2B Middleware Market Size and Share Forecast Outlook 2025 to 2035
B2B Hygienic Paper Market Size and Share Forecast Outlook 2025 to 2035
B2B Travel Market Size and Share Forecast Outlook 2025 to 2035
B2B Sports Nutrition Market Analysis by Form, Application, Packaging, Distribution Channel and Region through 2035
B2B Telecommunication Market Analysis by Solution, End-User, Vertical, and Region from 2025 to 2035
B2B Payments Platform Market
Bot Services Market Size and Share Forecast Outlook 2025 to 2035
Spa Services Market Size and Share Forecast Outlook 2025 to 2035
M2M Services Market – Trends & Forecast through 2034
Microservices Orchestration Market Growth - Trends & Forecast 2025 to 2035
VOIP Services Market Analysis - Trends, Growth & Forecast through 2034
Global AI HR Services Market Size and Share Forecast Outlook 2025 to 2035
Legal Services Market Size and Share Forecast Outlook 2025 to 2035
Oracle Services Market Analysis – Trends & Forecast 2024-2034
Seismic Services Market Size and Share Forecast Outlook 2025 to 2035
AR Tour Services Market Analysis - Size and Share Forecast Outlook 2025 to 2035
Tableau Services Market Size and Share Forecast Outlook 2025 to 2035
Managed Services Market Analysis - Size, Share, and Forecast Outlook 2025 to 2035
Walk-in Services Market Growth – Trends & Forecast 2024-2034
The AI Legal Services Market Analysis - Size and Share Forecast Outlook 2025 to 2035

Thank you!
You will receive an email from our Business Development Manager. Please be sure to check your SPAM/JUNK folder too.
Chat With
MaRIA