The global podiatry services market is projected to grow from USD 4.95 billion in 2025 to USD 6.22 billion by 2035, registering a modest compound annual growth rate (CAGR) of 2.3% over the forecast period. This steady growth is driven by an increasing prevalence of foot and lower limb disorders, growing awareness about foot health, and rising demand for specialized podiatric care among aging populations worldwide.
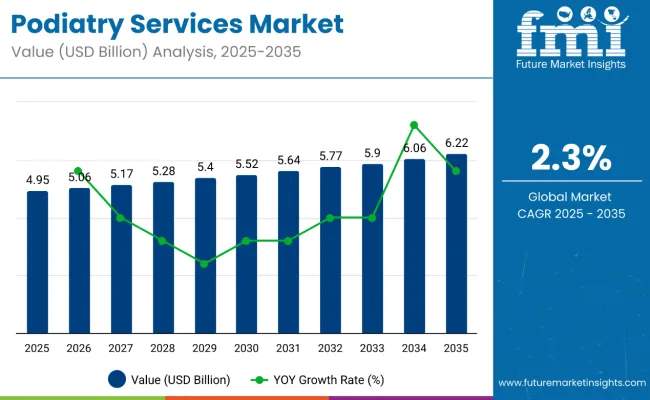
| Attributes | Key Insights |
|---|---|
| Estimated Size, 2025 | USD 4.95 billion |
| Projected Size, 2035 | USD 6.22 billion |
| Value-based CAGR (2025 to 2035) | 2.3% |
Podiatry services encompass the diagnosis, treatment, and prevention of conditions affecting the feet, ankles, and lower extremities. The growing incidence of diabetes and related complications such as diabetic foot ulcers and peripheral neuropathy is a key factor fueling demand for podiatric care. Additionally, sports injuries, arthritis, and biomechanical foot problems are increasing the need for professional podiatric interventions.
Advancements in diagnostic technologies, including gait analysis and imaging, are improving treatment accuracy and patient outcomes. Moreover, rising availability of outpatient clinics and specialized podiatry centers is enhancing accessibility to care, particularly in developed markets. Telemedicine and digital health solutions are also beginning to play a role in extending podiatry services to underserved regions.
North America holds a significant share of the market due to high healthcare expenditure, established podiatry infrastructure, and supportive insurance coverage. Europe follows closely, supported by an aging demographic and growing focus on preventive healthcare. The Asia-Pacific region is expected to witness gradual growth as healthcare infrastructure improves and awareness increases in emerging economies such as China and India.
In a 2024 industry statement published by the American Board of Foot and Ankle Surgery, Dr. Lawrence Santi, President of ABFAS, stated, “More than 10,000 podiatrists trust ABFAS’ certification in podiatric surgery to demonstrate to the public and the health care system that they have the experience and knowledge to perform surgery. … ABFAS will not consider lowering its standards.” His comment highlights the growing importance of maintaining rigorous standards in podiatry, reinforcing public trust and advancing the role of podiatric care within the broader healthcare ecosystem.
With rising foot-related health issues, technological advancements, and expanding healthcare access, the podiatry services market is positioned for steady and sustained growth through 2035.
The global geriatric population is expanding rapidly, placing increasing pressure on healthcare systems, social support networks, and economic structures. As people live longer due to medical advancements and improved living conditions, age-related health concerns such as chronic illnesses, mobility issues, and musculoskeletal diseases are becoming more prevalent. This demographic shift is also creating a greater need for specialized care, long-term treatment options, and age-friendly infrastructure.
Governments across the globe are taking active steps to integrate and support podiatry services, especially to meet the growing needs of aging populations and rising chronic conditions such as diabetes. Support mechanisms vary depending on national healthcare frameworks, economic priorities, and demographic challenges.
The table below compares the compound annual growth rate (CAGR) for the global podiatry services market from 2024 to 2025 during the first half of the year. This overview highlights key changes and trends in revenue growth, offering valuable insights into market dynamics.
H1 covers January to June, while H2 spans July to December. In the first half (H1) of the decade from 2024 to 2034, the business is predicted to surge at a CAGR of 3.0%, followed by a slightly lower growth rate of 2.7% in the second half (H2) of the same decade.
| Particular | Value CAGR |
|---|---|
| H1 | 3.0% (2024 to 2034) |
| H2 | 2.7% (2024 to 2034) |
| H1 | 2.3% (2025 to 2035) |
| H2 | 1.8% (2025 to 2035) |
Moving into the subsequent period, from H1 2025 to H2 2035, the CAGR is projected to decrease slightly to 2.3% in the first half and projected to lower at 1.8% in the second half. In the first half (H1) the market witnessed a decrease of 70 BPS while in the second half (H2), the market witnessed a decrease of 90 BPS.
General podiatry commands a 24.7% share of the market, while diabetic foot care leads indications with 26.1%, driven primarily by the growing global prevalence of diabetes and its complications.
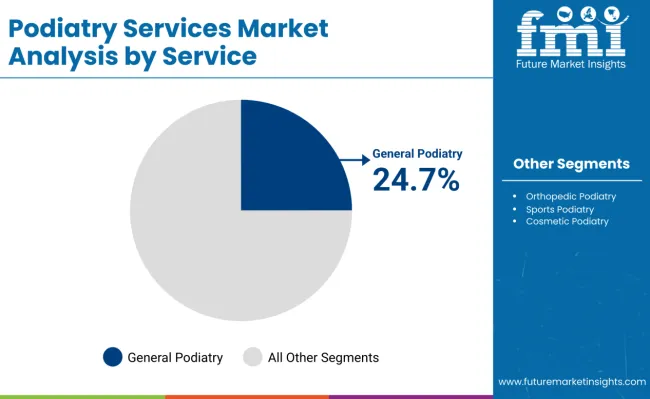
General podiatry holds the largest share in the podiatry services market, accounting for 24.7% in 2025. This segment encompasses routine foot care, diagnosis, and treatment of common foot and lower limb ailments including infections, nail disorders, and minor deformities. The broad scope and preventive nature of general podiatry services make it essential for patients of all ages.
Patients increasingly seek general podiatry for early intervention, reducing the risk of chronic complications. Clinics offering accessible, comprehensive foot care see consistent demand, particularly in urban areas with aging populations. The segment benefits from growing awareness about foot health and the importance of timely management of foot-related conditions.
Providers are also integrating telehealth and mobile podiatry services to expand reach and convenience. As healthcare systems emphasize preventive care, general podiatry is set to maintain its leading position by addressing a wide spectrum of foot health needs across demographics.
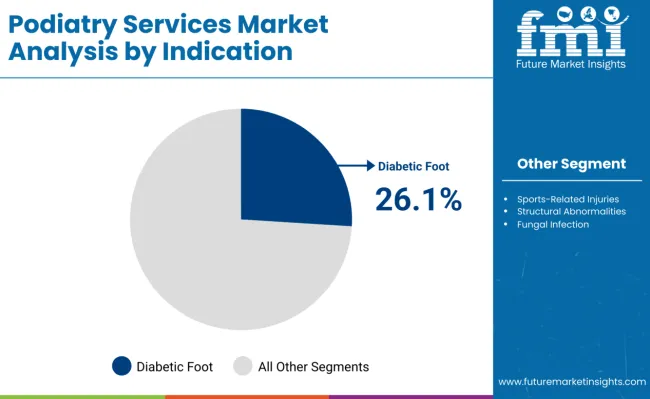
Diabetic foot care is the leading indication in the podiatry services market, accounting for 26.1% share in 2025. The increasing prevalence of diabetes worldwide has escalated demand for specialized foot care to manage neuropathy, ulcers, infections, and prevent amputations.
Patients with diabetes require regular podiatric assessments to monitor foot health and intervene early to avoid severe complications. Multidisciplinary diabetic foot clinics combine podiatry, endocrinology, and wound care, improving patient outcomes and reducing healthcare costs.
Rising awareness of diabetic foot complications among patients and providers is fueling demand. Innovations in wound care technologies, pressure offloading devices, and patient education programs enhance treatment efficacy.
As diabetes incidence grows, especially in aging populations, diabetic foot care services will continue to dominate podiatry market indications, supported by public health initiatives and reimbursement policies prioritizing preventive management.
The increase in sport-related injuries is a significant driving force for market growth in podiatry services. A considerable number of injuries related to the foot and ankle, which affect athletes such as professionals or amateurs athletes are effectively treated through podiatry.
In the light of this, the injuries have increased due to an increase in participation in recreational sports, competitive sports as well as the intense training and therefore there is a growing need for podiatry services.
Podiatrists greatly contribute to diagnosing injuries, treating injuries and preventing future injuries with surgical and non-surgical procedures. Podiatrists also provide rehabilitation resources such as orthotics and custom footwear to optimize foot health and ultimately create performance relieve future injury.
As a result, sports medicine clinics routinely collaborate with podiatrists to provide preventative avenues of care and rehabilitative treatment.
A growing awareness of fitness and sports activities across the globe, including running, football, basketball, and other athletic activities deemed "high impact," continues to provide increasing demand for the podiatry services market. Engagement in recreational and professional sports, continue to drive consumers to require podiatry services while highlighting the importance of foot health, injury prevention, and overall performance.
The podiatrist industry is experiencing a significant trend toward the establishment of clinics and centers that specialize in the areas, issues, and practices that relate to foot health. Thus, these newer facilities provide more than traditional podiatric services, offering specific services with unique competencies to meet the treatment needs of distinct populations of patients.
Foot care clinics reduce the incidence of ulcers, infections, and other foot concerns by providing specialized treatment to a population that experiences foot difficulties frequently. They also emphasize early intervention and prevention. These clinics have a major impact on lowering the prevalence of complex foot problems.
Pediatric podiatry clinics provide specialist therapy for developmental disorders, abnormalities of gait, and congenital foot issues to address the unique needs of children. Early treatment of foot conditions in young children can be beneficial, and these clinics provide pediatric podiatry treatments from professionals who specialize in the field.
Specialized clinics and centers represent a shift from general podiatric services toward more patient-specific care. These facilities offer tailored treatments for particular populations or conditions, enhancing the overall understanding and delivery of podiatric care. By focusing on specialized, comprehensive services, both healthcare providers and patients benefit from more effective and targeted foot health solutions.
The growing incidence of both foot and ankle injuries due to sports injuries, accidents, or chronic conditions derived from repetitive mechanisms represents a major potential propellant in the podiatry services category. These injuries can range from sprains and fractures to ligament tears and conditions that arise from overuse. Due to the specific anatomical features of the foot and ankle, the care of foot and ankle injuries often warrants specific treatment.
Ankle sprains, stress fractures, and Achilles tendonitis are frequent sports injuries that lead individuals to seek podiatric treatment. Sports podiatrists offer athletes not only therapeutic care but also customized treatment plans to aid in their recovery and ensure they are better equipped for future athletic challenges.
In addition to patients injuries are common among patients who have occupations or perform activities of high-impact and/or prolonged standing. Common examples of overuse injuries that may require expert care include plantar fasciitis and stress fractures.
A major factor driving the rise in the number of foot and ankle injuries that podiatrists can treat in an acute or chronic environment is the proliferation of clinics and rehabilitation settings that cater to the growing need for specialized treatment in the podiatry services industry.
The provision of modern diagnoses, treatment choices, and rehabilitative services tailored to the contemporary complications of foot and ankle injuries and their rehabilitative process is made possible by the developing landscape of specialized clinics, rehabilitation, and rehabilitation paradigms.
The insufficient number of podiatric practitioners has emerged on the scene as a significant impediment to the overall growth of the podiatry services market, especially in light of the increased diabetes and diabetic complication rates. In terms of diagnosis and treatment of foot-related ailments, podiatrists are essential to patients receiving appropriate care.
In areas with high diabetes prevalence such as Asia-Pacific and North America, the demand for qualified podiatrists exceeds the pool of available practitioners.
This is causing several complications for patients, including longer wait times for appointments, delayed diagnosis, and poor management of foot conditions such as diabetic foot ulcers (DFUs) that need to be addressed, as patients can easily experience adverse effects, including infection, complications, and limb amputations.
This shortage also has a tangible economic impact because it reduces healthcare facilities’ ability to provide patients with complete podiatry services, especially in rural areas and areas of health disparity. The market for podiatry services becomes limited, as the current workforce will not be able to meet the ever-increasing demand resulting in a delay through care expansion.
The outstanding deficit in the workforce is expected to position podiatric patients, especially those at risk with diabetes, to have even worse health-related outcomes resulting in a decrease in quality and access to service in podiatry and the health market overall.
Increasing the number of podiatrists may alleviate some of the impact in overburdened healthcare systems, as general practitioners and other specialists do not always have the level of knowledge to manage more complicated foot conditions. Thus, patients may no longer receive appropriate treatment, worsening conditions and increasing healthcare costs associated with more complicated health conditions.
The section below covers the industry analysis for the podiatry services market for different countries. Market demand analysis on key countries in several regions of the globe, including North America, Asia Pacific, Europe, and others, is provided. The United States is anticipated to remain at the forefront in North America, with a value share of 86.7% through 2034. In Asia Pacific, India is projected to witness a CAGR of 4.8% by 2035.
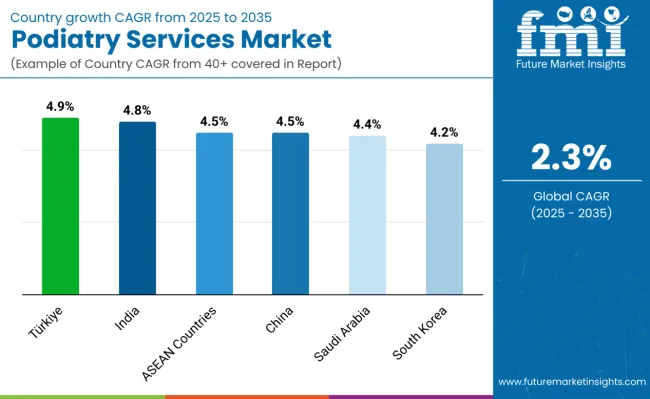
| Countries | Value CAGR (2025 to 2035) |
|---|---|
| Türkiye | 4.9% |
| India | 4.8% |
| ASEAN Countries | 4.5% |
| China | 4.5% |
| Saudi Arabia | 4.4% |
| South Korea | 4.2% |
The USA dominates the global market with a 31.5% market share in 2024. The USA is expected to exhibit a CAGR of 1.1% throughout the forecast period 2025 to 2035.
The podiatry services market in the United States is growing due to the increased prevalence of foot-related diseases and disorders, especially those related to chronic diseases; that affect millions of Americans, such as diabetic-related illnesses and obesity.
Foot care specialists (podiatrists) are an important preventative service against high complication costs (such as amputations and hospitalizations) as foot complications can be costly. The American Podiatric Medical Association (APMA) estimates that the USA healthcare system could save USD 3.5 billion annually in treating diabetic patients utilizing podiatric services.
An aging population and acknowledgment of the effects of foot health on overall health are other contributory factors to the ongoing need for podiatry services. As this continues the podiatric care, market will likely continue to grow considering all of the technological advancements and accessibility to health care, healthcare settings, and access to patient-centered podiatric practices.
In 2024, Germany held a dominant revenue in the Western Europe market and contributed market share of 18.1%, and is expected to grow with a CAGR of 1.0%.
According to the GEHWOL Foot Care Trends, Germany is shifting its focus to foot care as a lifestyle concern, which will have a substantial impact on the podiatry services market. Foot care will no longer be limited to the elderly or those with severe foot problems, but will become a priority for all demographic groups, including health-conscious persons, self-care advocates, and those interested in aesthetic maintenance.
Preventive foot care is becoming more popular, especially for those individuals and groups who view foot care as a holistic approach to health, similar to exercise and nutrition. This increased interest in prevention and wellness will drive a need for podiatric services as individuals seek professional assessment to maintain foot health and avoid prevention of issues.
Additionally, as foot care becomes more related to beauty or self-care amenities or services, the market should expect to see an increase in visits to podiatrists for cosmetic treatments, skincare, and aesthetic procedures. The expansion of foot care beyond a medically necessary visit should encourage growth in the market for podiatry services in Germany.
China occupies a 48.7% value share in East Asia market in 2024 and is expected to grow with a CAGR of 4.5% during the forecasted period.
In the People's Republic of China, public health is expected to greatly raise awareness of foot health. Future public health interventions should include increased public awareness efforts about preventive foot care and the significance of regular check-ups. As part of a larger public health strategy, these programs aim to educate the public on the importance of understanding the link between foot health and overall health.
The proposed public advertisements would most likely focus on lifestyle chemicals, suitable footwear, and the early detection of foot problems, all while advocating proactive foot management. By incorporating foot health into public health, China hopes to minimize the prevalence of preventable foot illnesses, improve health outcomes, and foster a culture of proactive foot health management and action among the people.
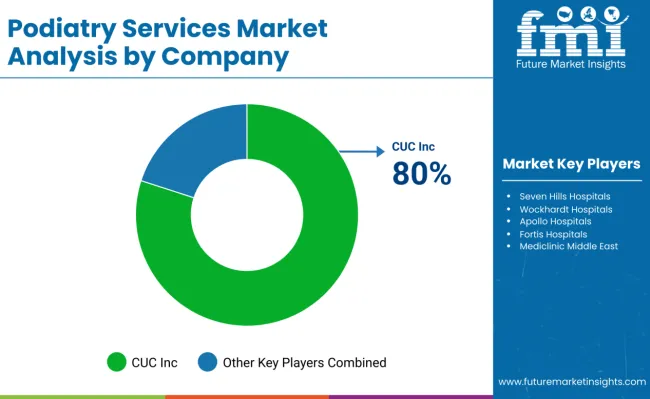
The podiatry services market is highly competitive with key players such as Podiatry Group LLC, Foot Solutions, Advanced Podiatry, and The Centers for Advanced Orthopaedics leading the landscape.
These companies focus on expanding their service offerings by integrating advanced technologies like digital diagnostics and minimally invasive procedures. Podiatry Group LLC emphasizes personalized patient care and partnerships with insurance providers to enhance accessibility.
Foot Solutions differentiates through specialized footwear and orthotic products alongside clinical services. Advanced Podiatry invests heavily in research and development to improve treatment outcomes and broaden therapeutic options. The Centers for Advanced Orthopaedics leverage their multidisciplinary approach to attract patients seeking comprehensive foot and ankle care.
| Report Attributes | Details |
|---|---|
| Market Size (2025) | USD 4.95 billion |
| Projected Market Size (2035) | USD 6.22 billion |
| CAGR (2025 to 2035) | 2.3% |
| Base Year for Estimation | 2024 |
| Historical Period | 2020 to 2024 |
| Projections Period | 2025 to 2035 |
| Quantitative Units | USD billion for value and number of patient visits or service instances for volume |
| Services Analyzed (Segment 1) | General Podiatry, Orthopedic Podiatry, Sports Podiatry, Cosmetic Podiatry, Podopaediatrics, Wound Care Podiatry, Others |
| Patient Demographics Analyzed (Segment 2) | Pediatric Podiatry, Adult Podiatry, Geriatric Podiatry |
| Indications Analyzed (Segment 3) | Diabetic Foot Care, Sports-Related Injuries, Structural Abnormalities, Fungal Infections, Bunions and Corns, Ingrown Toenails, Others |
| Service Providers Analyzed (Segment 4) | Hospitals, Podiatry Clinics, Homecare & Telemedicine |
| Regions Covered | North America; Latin America; Europe; East Asia; South Asia & Pacific; Middle East & Africa |
| Countries Covered | United States, Canada, Brazil, Mexico, Germany, United Kingdom, France, Italy, Spain, China, Japan, South Korea, India, Australia, UAE, Saudi Arabia, South Africa |
| Key Players Influencing the Market | Broadway Foot & Ankle Clinic, Chicago Foot Health Centers, Ashinosenmon Tokyo Podiatry Clinic, Shimokitazawa Hospital, DfC Diabetic Foot Clinic, Europe Hospitals - St-Michel Site, FLECK PODOLOGIA by Simone Fleck, MÉDICALE DU GRAND SUD, Bauerfeind Polyclinic, Burjeel Hospital for Advanced Surgery Dubai, Osteopoliklinik, Semeynaya Meditsinskaya Klinika, Euromed Clinic, Oregon Foot Clinic, Palm Beach Podiatry, Town Center Foot Clinic, Seven Hills Hospitals, Wockhardt Hospitals, Apollo Hospitals, Fortis Hospitals, Mediclinic Middle East |
| Additional Attributes | Dollar sales by service type, patient demographics, leading indications, private vs public clinic share, geographic growth hotspots, referral trends, reimbursement landscape, competitor strategies. |
In terms of service, the industry is divided into general podiatry, orthopedic podiatry, sports podiatry, cosmetic podiatry, podopaediatrics, wound care podiatry and others.
In terms of patient demographics, the industry is segregated into pediatric podiatry, adult podiatry, geriatric podiatry
In terms of indication, the industry is divided into diabetic foot care, sports-related injuries, structural abnormalities, fungal infections, bunions and corns, ingrown toenails and other indications.
In terms of Service provider, the industry is segregated into hospitals, podiatry clinics and homecare & telemedicine
Key countries of North America, Latin America, Europe, East Asia, South Asia & Pacific, Middle East and Africa (MEA) have been covered in the report.
The global podiatry services industry is projected to witness CAGR of 2.3% between 2025 and 2035.
The global podiatry services industry stood at USD 4,839.6 million in 2024.
The global podiatry services industry is anticipated to reach USD 6.22 billion by 2035 end.
China is expected to show a CAGR of 4.5% in the assessment period.
The key players operating in the global podiatry services industry include Broadway Foot & Ankle Clinic, Chicago Foot Health Centers, Ashinosenmon Tokyo Podiatry Clinic, Shimokitazawa Hospital, DfC Diabetic Foot Clinic, Europe Hospitals - St-Michel Site, FLECK PODOLOGIA by Simone Fleck, MÉDICALE DU GRAND SUD, Bauerfeind Polyclinic, Burjeel Hospital for Advanced Surgery Dubai, Osteopoliklinik, Semeynaya Meditsinskaya Klinika, Euromed Clinic, Oregon Foot Clinic, Palm Beach Podiatry, Town Center Fo


Our Research Products

The "Full Research Suite" delivers actionable market intel, deep dives on markets or technologies, so clients act faster, cut risk, and unlock growth.

The Leaderboard benchmarks and ranks top vendors, classifying them as Established Leaders, Leading Challengers, or Disruptors & Challengers.

Locates where complements amplify value and substitutes erode it, forecasting net impact by horizon

We deliver granular, decision-grade intel: market sizing, 5-year forecasts, pricing, adoption, usage, revenue, and operational KPIs—plus competitor tracking, regulation, and value chains—across 60 countries broadly.

Spot the shifts before they hit your P&L. We track inflection points, adoption curves, pricing moves, and ecosystem plays to show where demand is heading, why it is changing, and what to do next across high-growth markets and disruptive tech

Real-time reads of user behavior. We track shifting priorities, perceptions of today’s and next-gen services, and provider experience, then pace how fast tech moves from trial to adoption, blending buyer, consumer, and channel inputs with social signals (#WhySwitch, #UX).

Partner with our analyst team to build a custom report designed around your business priorities. From analysing market trends to assessing competitors or crafting bespoke datasets, we tailor insights to your needs.
Supplier Intelligence
Discovery & Profiling
Capacity & Footprint
Performance & Risk
Compliance & Governance
Commercial Readiness
Who Supplies Whom
Scorecards & Shortlists
Playbooks & Docs
Category Intelligence
Definition & Scope
Demand & Use Cases
Cost Drivers
Market Structure
Supply Chain Map
Trade & Policy
Operating Norms
Deliverables
Buyer Intelligence
Account Basics
Spend & Scope
Procurement Model
Vendor Requirements
Terms & Policies
Entry Strategy
Pain Points & Triggers
Outputs
Pricing Analysis
Benchmarks
Trends
Should-Cost
Indexation
Landed Cost
Commercial Terms
Deliverables
Brand Analysis
Positioning & Value Prop
Share & Presence
Customer Evidence
Go-to-Market
Digital & Reputation
Compliance & Trust
KPIs & Gaps
Outputs
Full Research Suite comprises of:
Market outlook & trends analysis
Interviews & case studies
Strategic recommendations
Vendor profiles & capabilities analysis
5-year forecasts
8 regions and 60+ country-level data splits
Market segment data splits
12 months of continuous data updates
DELIVERED AS:
PDF EXCEL ONLINE
M2M Services Market Size and Share Forecast Outlook 2025 to 2035
B2B Services Review Platforms Market Size and Share Forecast Outlook 2025 to 2035
Bot Services Market Size and Share Forecast Outlook 2025 to 2035
Spa Services Market Size and Share Forecast Outlook 2025 to 2035
Microservices Orchestration Market Growth - Trends & Forecast 2025 to 2035
VOIP Services Market Analysis - Trends, Growth & Forecast through 2034
Global AI HR Services Market Size and Share Forecast Outlook 2025 to 2035
Legal Services Market Size and Share Forecast Outlook 2025 to 2035
Oracle Services Market Analysis – Trends & Forecast 2024-2034
Seismic Services Market Size and Share Forecast Outlook 2025 to 2035
AR Tour Services Market Analysis - Size and Share Forecast Outlook 2025 to 2035
Tableau Services Market Size and Share Forecast Outlook 2025 to 2035
Managed Services Market Analysis - Size, Share, and Forecast Outlook 2025 to 2035
Walk-in Services Market Growth – Trends & Forecast 2024-2034
The AI Legal Services Market Analysis - Size and Share Forecast Outlook 2025 to 2035
Catering Services Market Analysis by Service Type, Application and End User and Region Through 2035
Wellness Services Market Trends - Growth & Forecast 2025 to 2035
Audiology Services Market Size and Share Forecast Outlook 2025 to 2035
Home Care Services Market Size, Growth, and Forecast 2025 to 2035
Neurology Services Market Overview - Growth & Forecast 2025 to 2035

Thank you!
You will receive an email from our Business Development Manager. Please be sure to check your SPAM/JUNK folder too.
Chat With
MaRIA