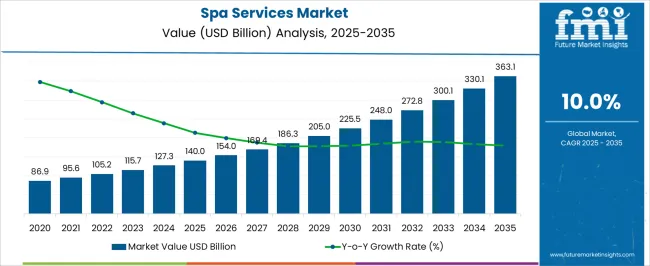
The Spa Services Market is estimated to be valued at USD 140.0 billion in 2025 and is projected to reach USD 363.1 billion by 2035, registering a compound annual growth rate (CAGR) of 10.0% over the forecast period.
| Metric | Value |
|---|---|
| Spa Services Market Estimated Value in (2025 E) | USD 140.0 billion |
| Spa Services Market Forecast Value in (2035 F) | USD 363.1 billion |
| Forecast CAGR (2025 to 2035) | 10.0% |
The spa services market is undergoing significant transformation, supported by evolving consumer lifestyles, heightened wellness awareness, and increased urbanization. Rising disposable income and growing stress-related health conditions have accelerated demand for therapeutic and relaxation treatments, particularly in metro and tier-2 cities.
The market is also being influenced by changing beauty standards and holistic health approaches, which are expanding service offerings beyond aesthetics to include preventive care and mental wellness. Technological innovations such as digital appointment platforms, mobile spa services, and AI-based skin diagnostics are reshaping consumer engagement.
Additionally, partnerships with hotels, resorts, and retail wellness chains are extending the reach and visibility of spa offerings. Looking ahead, growth is expected to be reinforced by personalized wellness experiences, increased male participation, and a rising preference for natural and organic products integrated into service delivery.
The market is segmented by Product Type, Service Type, and End User and region. By Product Type, the market is divided into Day Spa, Resort/Hotel, Medical Spa, Thermal/Mineral Springs Spas, and Others. In terms of Service Type, the market is classified into Massage, Beauty/Grooming, Physical Fitness, and Others. Based on End User, the market is segmented into Women and Men. Regionally, the market is classified into North America, Latin America, Western Europe, Eastern Europe, Balkan & Baltic Countries, Russia & Belarus, Central Asia, East Asia, South Asia & Pacific, and the Middle East & Africa.
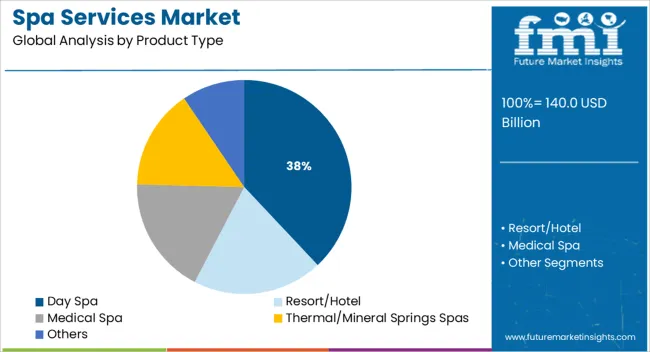
Day spas are expected to hold 38.0% of the total revenue share in the spa services market by 2025, making them the leading product type. This segment’s growth is being driven by convenience, accessibility, and affordability for time-sensitive urban consumers.
Day spas cater to short-duration treatments such as facials, massages, and grooming services, enabling walk-in traffic and high customer turnover. Their presence in commercial hubs, shopping complexes, and residential zones allows for regular engagement with a broad client base.
Moreover, standardized pricing, flexible service packages, and digital scheduling options have made day spas attractive to working professionals and first-time users. Their ability to offer stress-relief therapies in compact, non-resort settings has helped solidify their market leadership in both standalone and franchised formats.
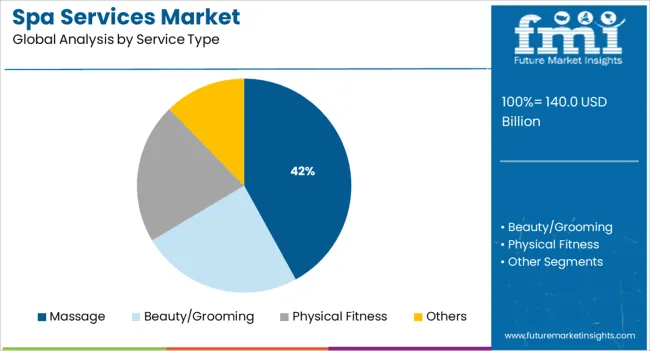
Massage services are projected to contribute 42.0% of the spa services market revenue by 2025, marking them as the most demanded service type. This dominance is being fueled by the increasing recognition of massage therapy for both wellness and medical benefits, including pain relief, stress reduction, and improved circulation.
The segment’s appeal spans across age groups and genders, with rising adoption among working populations and elderly clients. Variety in offerings—such as deep tissue, aromatherapy, hot stone, and sports massage—has expanded market reach.
Integration with wellness retreats, physiotherapy clinics, and luxury spa centers has further elevated the segment’s visibility. As consumers increasingly seek non-invasive, non-pharmaceutical approaches to health, massage therapy continues to lead in both repeat usage and customer satisfaction within spa menus.
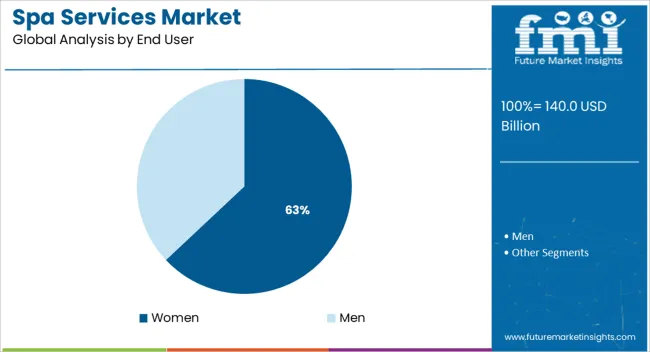
Women are expected to account for 63.0% of the total spa services market revenue in 2025, positioning them as the dominant end-user segment. This leadership is being attributed to women’s higher frequency of spa visits, broader engagement across services, and greater awareness of beauty and wellness routines.
Services such as skincare, body treatments, and relaxation therapies are strongly aligned with female consumer preferences and lifestyle habits. Additionally, targeted marketing strategies, loyalty programs, and bundled offerings designed for women have driven consistent engagement.
Women-centric spa formats, including maternity care, bridal packages, and hormone-balancing therapies, have further diversified the segment’s influence. As wellness becomes a more integrated part of self-care routines, the female demographic continues to anchor market growth through both individual and group-based experiences.
The prevalence of long-term conditions like asthma will continue to drive up demand for a diverse array of spa treatments in the international spa services market. Patients who suffer from asthma often have enlarged airways, which can make it difficult for them to breathe.
Asthmatic individuals frequently struggle with a variety of symptoms, including wheezing, coughing, and shortness of breath, among other typical issues.
The use of steam baths and saunas, which cost money, helps asthma patients open their airways and eliminate toxins through their skin. In addition, increasing the amount of money spent on steam baths can assist in the treatment of upper respiratory issues, such as coughing and bronchitis, by facilitating the release of phlegm and mucus.
The increasing demand for asthmatic relief and relaxation is anticipated to help the expansion of the spa services market around the world.
Software-as-a-service
The term software as a service (SaaS) refers to software that is licensed on a subscription basis and is hosted centrally. This type of software is also known as on-demand software.
New software as a service (SaaS) called Spa Space offers cost reductions, optimization of income streams, and an increase in client satisfaction. A customer's preferences regarding location and length of treatment are considered by an algorithm that is currently being considered for a patent.
Delivering unique KPI reporting and dynamic yield management to spas is made possible by the ability to install turnkey spa management solutions. These solutions include payments, scheduling, local marketing, and therapist sourcing, and they make it easier for spas to open their doors again.
Contactless Booking
Contactless booking offers safe and effective remote transactions across the board, from the booking procedure itself to check-in and check-out, as well as product purchases. In addition to the apparent safety offered by a touchless experience during the pandemic, contactless booking grants guests complete control over their journey from the beginning to the end.
Maintaining central reservations as well as a welcome desk for check-in and check-out ties up important human resources. This was a problem from an operational point of view.
CRM
Increased capture rates, repeat business, guest loyalty, and guest engagement may all be attributed to communicating the appropriate message to the appropriate guest or prospect. Market segmentation is the process of dividing a market into smaller, more defined segments based on criteria that are shared within those categories.
This can be accomplished through spa management software or customer relationship management (CRM) applications. Messaging will be more successful if the visitors and potential customers are divided into distinct groups according to the characteristics they share, such as their demographics, psychographics, behaviors, geographic locations, and stages in their lifecycles.
Using the marketing feature of their CRM, resort hotel spas have a chance to acquire business by directly targeting and connecting with guests before their arrival. This can be accomplished by directly targeting potential customers. Locals are an ideal demographic for hotel spas to target for memberships, staycation packages, and repeat visits.
The availability of numerous therapies, ranging from tried-and-true cryotherapy to cutting-edge LED therapy, hydrotherapy, and sound therapy, among others, has been prompted by a desire to experience the convergence of the body, mind, and spirit.
As a result, the demand for spa services is projected to increase in the near future as customer attitudes change. The therapist must be near the client in order to provide services like body massages and facials and must be in close proximity to complete the procedure.
Since physical touch is essential for the therapeutic process, these centers are unable to abide by the physical distancing regulations. The spa services market suffers from the aforementioned issues and the discontinuance of services.
The growing trend of traveling for relaxation, wellness, and meditation is more prominent in North America and Europe, especially in countries such as Germany, France, the United Kingdom, the USA, and Canada, among others.
The concept of spas for wellness therapy is also booming in emerging economies, with the growth of the hospitality industry in these economies. Thailand is popular for traditional spas, especially Ayurvedic and Thai massages.
Lifestyle Changes- Expectation To Cope-Up With Hectic Schedules
Globally, people's health has gotten poorer as a result of mounting concerns about an increasingly chaotic lifestyle. Extended travel periods and hectic schedules are bad for the body. Therefore, travelers are looking for ways to enhance the benefit of being healthy and rejuvenated when traveling.
Grooming Treatments-Expectation To Be Fit
The rising reputation of beauty services among youths is positively impacting the market. Teenagers avail spa services before school/college gatherings or proms, where they are greatly looking for grooming treatments that can improve their looks, as well as tone their body through rough fitness and diet programs.
Body Healing for Elder Population-Expectation of Pain Management
On the other hand, elderly people experience several body-related distresses, such as back pain, neck pain, digestive disorders, and others, due to their failing health. Thus, comforting treatments, pain management, anti-aging, as well as internal body healing packages are being widely explored by the elderly population, which is likely to further accelerate the spa services market progress.
The market expansion may be constrained by the greater price of the majority of packages, which are out of the reach of the general public. Additionally, to secure the safety of the workers and visitors, the governing authorities have implemented several severe laws for running these kinds of facilities.
As a result, to operate the business, the facility operator must adhere to several tight governmental laws. Additionally, throughout the business cycle, the operator must undergo several strict inspections.
For the facility operator, this element presents difficulties. Moreover, increasing instances of physical abuse and other malpractices at these facilities are expected to reduce client visits, as well as present difficulties in employment due to safety concerns associated with working at such facilities.
Although demand for global spa services as a part of the wellness tourism market is seen significantly, certain factors are hindering the growth of the global spa services market, such as low penetration of spa services in developing countries and less availability of trained spa professionals.
The cost of the skilled workforce is high, thereby increasing the operational cost, and further restricting the growth of the global spa services market as a part of the wellness tourism market.
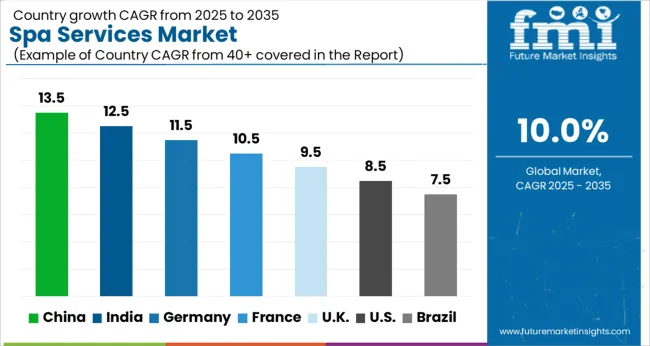
A growth in authentic facilities is likely to result from the rising demand for spa services.
The demand for full body massages and other aesthetic treatments in the USA and Canada, as well as the expansion of upscale service facilities, are the main factors driving the North American market.
The market in North America is expected to witness a rapid growth rate during the forecast period, owing to the growing number of luxurious massage services and facilities in the USA In addition, people from the region have shown an increasing inclination towards rejuvenating treatments.
Besides aging baby boomers, the millennials are also plunging headfast into the spa industry, as they seek to opt for relaxing treatment options, given the prevalence of hectic lifestyles. Thus, North America is holding about 25% global market share and is expected to rise from 2025 to 2035.
The presence of numerous natural springs is expected to massively boost Asia Pacific’s shares in the global market.
Emerging economies in this region, including Japan, India, and China, are exhibiting strong economic growth. The flourishing hospitality industry and the growing popularity of traditional spas, such as Thai massage and Ayurveda in the region, would continue to drive the spa services market.
Asian spa service demand is spearheaded by nations like China and India. Spa industries are being drawn to both of these countries by their growing populations. Additionally, people are choosing spa treatments due to the region's worsening health conditions.
The travel and tourism industry has expanded significantly. Thus, resorts in the region are offering attractive packages for customers. Also, traditional ayurvedic treatments in the region have created humongous opportunities for the spa industry.
Due to the region's expanding middle-class population, as well as the rising number of massage, sauna, and mineral spring facilities, Asia Pacific currently holds a sizable part of the market at about 22%.
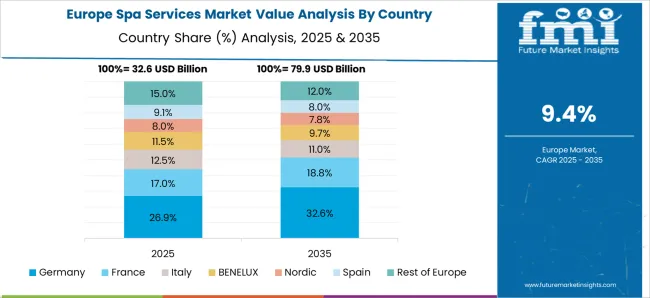
Europe is expected to witness the fastest growth with a CAGR of 19% by 2035.
Due to the rising expenditure on health and well-being, Europe is anticipated to dominate the global market in the upcoming years. The rising awareness about the body and mind spurs opportunities for the spa services market in Europe. It is anticipated that the well-established travel and tourism sector helps the Europe spa services market expand.
The government initiatives and favorable regulatory environment are further boosting the spa services market growth. With the increasing popularity of wellness among ordinary people, many spa vendors in Europe have developed a wide range of services to encourage healthy living.
Increased spending on health owing to increased awareness regarding well-being in the region also contributes to greater market penetration. Also, growing travel and tourism activities in European countries are further driving the demand for spa services.
The increase in tourists traveling and the rise in the number of hotels lifted the revenue in the spa services market.
Preference for relaxing therapies during trips and tourism has led to a surge in demand for spa services in hotel/resort spas globally. Based on product type, the hotel/resort spa segment is expected to generate significant revenues in the global spa market during the forecast period.
Owing to the increasing number of hotel chains in the international market, as well as the rising number of traveling and tourism activities, lifts the segment growth. While the availability of a variety of these massages is projected to cause the destination category to experience the fastest growth rate.
Spa services are primarily utilized by women, while more men are using them as well.
Women are the primary users of personal care services, and therefore the women segment holds a major spa services market share. However, the increasing trend of grooming among the men population is likely to propel men’s segment growth.
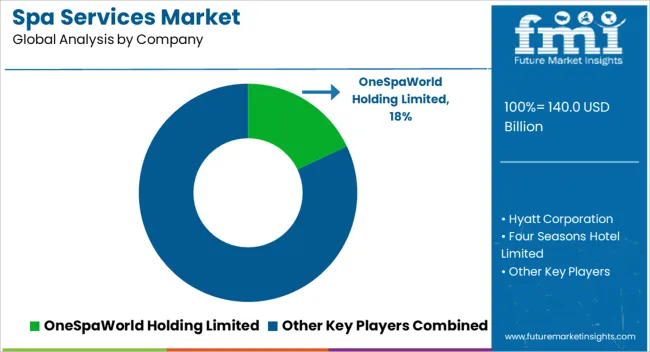
Players are mostly concentrating on providing consumers with personalized bundles to improve their experience at the establishment. In a similar vein, facility owners are implementing software-based tracking systems and applications to gather and organize data from clients, enabling seamless paperless management of the facility.
The start-ups employ new technologies to link people with salons and spas as a result of digitalization.
Leading service providers are promoting the introduction of several spa packages aimed at different consumer segments. For example, In October 2020, Marriott International Inc. launched a new J.W. Marriott resort & spa on Vagaru Island, Maldives to provide signature spa services such as head-to-toe pampering and exquisite treatments to Maldivian tourists.
However, players are likely to find the most chances for expansion in the premium and luxury sectors. Furthermore, the increasing digitalization of services is increasing competition among spa service providers.
Changing lifestyle trends are projected to create substantial demand for spa services for health and wellness awareness. Hectic schedules are causing mental tiredness as well as food and sleeping disorders all across the world. Unhealthy lifestyles have increased the demand for stress management, mental tranquility, and system purification. Furthermore, the frequency of chronic diseases is likely to increase the adoption of spa services globally.
As the traditional ambiance is one of the main criteria regarded in such sorts of personal care facilities, players are making efforts on continual refurbishment operations in response to changing customer preferences. The growing need to live a physically and mentally healthy lifestyle is projected to keep the demand for spa therapies strong.
Customers increased preference for destination spas is projected to open up new opportunities for the key players. The increased demand for quick spa facilities at airports, such as XpressSpas, is likely to drive the adoption of spa services.
Similarly, OneSpaWorld's ship/cruise-based facilities are likely to encourage the key spa service providers in the near future. Furthermore, the growing mindfulness for health and wellbeing is anticipated to help the service providers survive during the forecast period.
| Attribute | Details |
|---|---|
| Forecast Period | 2025 to 2035 |
| Historical Data Available for | 2020 to 2024 |
| Market Analysis | USD Million for Value |
| Key Region Covered | North America; Latin America; Asia Pacific; Middle East and Africa; Europe |
| Key Countries Covered | United States of America, Canada, Brazil, Argentina, Germany, The United Kingdom, France, Spain, Italy, Nordics, BENELUX, Australia & New Zealand, China, India, GCC Countries, South Africa |
| Key Segments Covered | Product, End User, Service Type, Tour Type, Region. |
| Key Companies Profiled | Hyatt Hotels Corporation; Four Seasons Hotel Limited; Marriott International Inc.; Hilton Hotels & Resorts; OneSpaWorld Holdings Limited; Siam Wellness Group; InterContinental Hotels Group plc; Massage Envy; Kempinski Hotels S.A; Brenners Park-Hotel & Spa; Others |
| Report Coverage | Market Forecast, Company Share Analysis, Competition Intelligence, Drivers, Restraints, Opportunities and Threats Analysis, Market Dynamics and Challenges, and Strategic Growth Initiatives |
The global spa services market is estimated to be valued at USD 140.0 billion in 2025.
The market size for the spa services market is projected to reach USD 363.1 billion by 2035.
The spa services market is expected to grow at a 10.0% CAGR between 2025 and 2035.
The key product types in spa services market are day spa, resort/hotel, medical spa, thermal/mineral springs spas and others.
In terms of service type, massage segment to command 42.0% share in the spa services market in 2025.


Our Research Products

The "Full Research Suite" delivers actionable market intel, deep dives on markets or technologies, so clients act faster, cut risk, and unlock growth.

The Leaderboard benchmarks and ranks top vendors, classifying them as Established Leaders, Leading Challengers, or Disruptors & Challengers.

Locates where complements amplify value and substitutes erode it, forecasting net impact by horizon

We deliver granular, decision-grade intel: market sizing, 5-year forecasts, pricing, adoption, usage, revenue, and operational KPIs—plus competitor tracking, regulation, and value chains—across 60 countries broadly.

Spot the shifts before they hit your P&L. We track inflection points, adoption curves, pricing moves, and ecosystem plays to show where demand is heading, why it is changing, and what to do next across high-growth markets and disruptive tech

Real-time reads of user behavior. We track shifting priorities, perceptions of today’s and next-gen services, and provider experience, then pace how fast tech moves from trial to adoption, blending buyer, consumer, and channel inputs with social signals (#WhySwitch, #UX).

Partner with our analyst team to build a custom report designed around your business priorities. From analysing market trends to assessing competitors or crafting bespoke datasets, we tailor insights to your needs.
Supplier Intelligence
Discovery & Profiling
Capacity & Footprint
Performance & Risk
Compliance & Governance
Commercial Readiness
Who Supplies Whom
Scorecards & Shortlists
Playbooks & Docs
Category Intelligence
Definition & Scope
Demand & Use Cases
Cost Drivers
Market Structure
Supply Chain Map
Trade & Policy
Operating Norms
Deliverables
Buyer Intelligence
Account Basics
Spend & Scope
Procurement Model
Vendor Requirements
Terms & Policies
Entry Strategy
Pain Points & Triggers
Outputs
Pricing Analysis
Benchmarks
Trends
Should-Cost
Indexation
Landed Cost
Commercial Terms
Deliverables
Brand Analysis
Positioning & Value Prop
Share & Presence
Customer Evidence
Go-to-Market
Digital & Reputation
Compliance & Trust
KPIs & Gaps
Outputs
Full Research Suite comprises of:
Market outlook & trends analysis
Interviews & case studies
Strategic recommendations
Vendor profiles & capabilities analysis
5-year forecasts
8 regions and 60+ country-level data splits
Market segment data splits
12 months of continuous data updates
DELIVERED AS:
PDF EXCEL ONLINE
Aerospace Engineering Services Outsourcing (ESO) Market Analysis - Size, Share, and Forecast Outlook (025 to 2035
Spain Sports Tourism Market Size and Share Forecast Outlook 2025 to 2035
Spark Detection System Market Forecast and Outlook 2025 to 2035
Spa Hot Tub Covers Market Size and Share Forecast Outlook 2025 to 2035
Space-based C4ISR Market Size and Share Forecast Outlook 2025 to 2035
Spasticity Treatment Market Size and Share Forecast Outlook 2025 to 2035
Space Lander and Rover Market Size and Share Forecast Outlook 2025 to 2035
Space-Based Solar Power Market Size and Share Forecast Outlook 2025 to 2035
Space Frame Market Size and Share Forecast Outlook 2025 to 2035
Spatial Computing Market Size and Share Forecast Outlook 2025 to 2035
Space Situational Awareness Market Size and Share Forecast Outlook 2025 to 2035
Space Robotics Market Size and Share Forecast Outlook 2025 to 2035
Space On Board Computing Platform Market Size and Share Forecast Outlook 2025 to 2035
Space Militarization Market Size and Share Forecast Outlook 2025 to 2035
Space Economy Market Size and Share Forecast Outlook 2025 to 2035
Spatial Mass Spectrometry Market Size and Share Forecast Outlook 2025 to 2035
Space Power Electronics Market Size and Share Forecast Outlook 2025 to 2035
Space Management Solutions Market Size and Share Forecast Outlook 2025 to 2035
Spackling Paste Market Size and Share Forecast Outlook 2025 to 2035
Spay and Neuter Market Analysis - Size, Share, & Forecast Outlook 2025 to 2035

Thank you!
You will receive an email from our Business Development Manager. Please be sure to check your SPAM/JUNK folder too.
Chat With
MaRIA