Service Lifecycle Management Application Market Outlook for 2024 to 2034

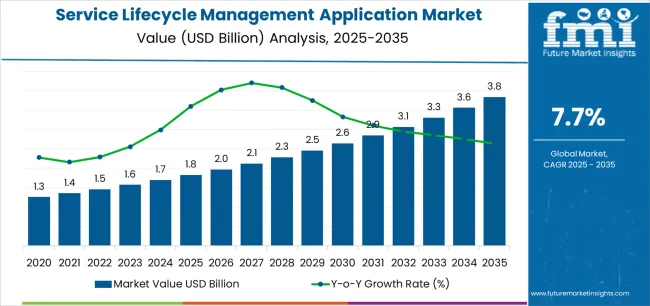
The service lifecycle management application market is on an upward trajectory, with an anticipated CAGR of 8.10%. FMI’s latest forecasts project notable growth from the market valuation of USD 1.69 billion in 2024 to a striking USD 3.69 billion by 2034. The shift from waterfall to agile development models is propelling the SLM application market, enhancing customer satisfaction, and increasing revenue.

Attributes Details
Market Value for 2024 USD 1.69 billion
Market Value for 2034 USD 3.69 billion
Market Forecast CAGR for 2024 to 2034 8.10%

Consumption Analysis of the Service Lifecycle Management Application Market

  • Service lifecycle management involves various processes, including center management, spare parts management, and collaboration with other companies, focusing on the full-service lifecycle of a product.
  • The service lifecycle management application industry is anticipated to flourish due to inflated value proposition, customer satisfaction, cost savings, and innovation in third platform technologies.
  • Cloud-based software is the preferred method for deploying SLM solutions, preventing implementation, upgrades, and customization challenges, and is foreseen to continue looming in the forthcoming decade.
  • SLM software adoption is advancing in metal-consuming industries, particularly in automotive, aerospace, defense, and transportation. Product-centric companies prioritize after-sales services, leading to a projected consumer base upsurge.
  • AI technology is revolutionizing in-service lifecycle management applications, reducing human variability and ensuring product availability while leading firms to prioritize research and development for competitive advantage.
  • SLM application adoption boosts end-use industries' cost reduction, improves technician productivity, and enhances inventory management. This propels market evolution due to its benefits in reverse logistics, field service, and warranty management.
  • Service lifecycle management applications integrate delivery, planning, and analysis, providing a competitive advantage and improving information accuracy, thereby advancing the demand from diverse industries.

2019 to 2023 Historical Analysis vs. 2024 to 2034 Market Forecast Projection

The global demand has historically developed at a CAGR of 5.90%. However, sales have stated to advance at a better pace, displaying a CAGR of 8.10% from 2024 to 2034.

Attributes Details
Market Historical CAGR for 2019 to 2023 5.90%

The pandemic has impacted the SLM market, leading to small businesses closing and increasing demand for existing products, with a projected increase in dependency on commercial sectors.

The pandemic significantly impacted the global economy, SLM applications demand, industry development, and business closures due to a lack of finance.

Artificial intelligence improves real-time applications, particularly predictive analytics, in service lifecycle management and aftermarket support services. It reduces human variability and ensures faster problem-solving, product availability, and customer query resolution.

In sectors that utilize metal, SLM applications are becoming prevalent since the platforms track performance and offer post-purchase services like welding and maintenance.

Key Trends Influencing the Service Lifecycle Management Application Market

Widespread Demand for the Short Release Timeline to Propel the Market

  • The SLM software is essential for businesses in the software development industry. It offers tools for managing software development, maintenance, and retirement processes, including configuration management, requirement management, planning, estimating, testing, implementation, support, and maintenance.
  • SLM software provides pre-deployment performance reports, enabling enterprises to deliver high-quality services and expedite development and test cycles, reducing product delivery time.
  • SLM software streamlines internal procedures, enhancing software creation, delivery, and implementation. It provides real-time data on application construction and delivery, enabling businesses to make data-driven decisions and adjust strategies as needed.
  • SLM software centralizes software development processes through defect management, progress monitoring, and improvement area identification. This cuts down on waste and inefficiencies, empowering enterprises to maximize productivity, efficiency, and quality.

Third-platform Technology Offerings Advance the Development of the SLM Tools

  • The SLM application demand is envisioned to encounter growth due to the adoption of third-platform technologies like cloud computing, mobile technology, analytics/big data, and social media. These accelerate innovation and enhance real-time connectivity.
  • Cloud computing offers enhanced visibility of service parts, enabling better inventory management and service delivery. Mobile technology enables field technicians to access vital information and data, enabling knowledgeable decisions and more efficient service delivery.
  • Big data and analytics are essential to SLM because they let businesses compare service performance to plans and pinpoint areas for development. Organizations may optimize their operations by using data from customer feedback, service records, and performance measures to inform data-driven decision-making.
  • Social media is revolutionizing the service lifecycle management process by enabling real-time collaboration with clients, partners, and stakeholders. It expedites exchanging information and improves service delivery and client satisfaction through real-time communication.
  • Because of the popularity of third-platform technologies, cloud computing, mobile technology, analytics, and social media, the demand for SLM applications is anticipated to develop in the forthcoming decade.

Rise of Research and Development in Automated SLM to Lift Market Value

  • Since cloud computing and artificial intelligence are developing at a rapid pace, the global automation industry is turning toward applications for service lifecycle management. This trend is projected to continue. Applications for SLM that incorporate AI elements have the potential to transform company processes and boost industrial productivity completely.
  • As automated service lifecycle management is still being researched and developed, the demand for SLM applications is predicted to increase significantly. Open-source service hubs, which are made to combine different services and apps, are anticipated to aid in the market expansion.
  • Businesses may increase efficiency and simplify operations with the aid of these centers, which bodes well for the market's future.

Category-wise Insights

The following part offers an in-depth analysis of segments of the SLM market. The demand for web-based service lifecycle management software is significant, whereas the adoption of depot-based SLM Models is anticipated to increase in 2024.

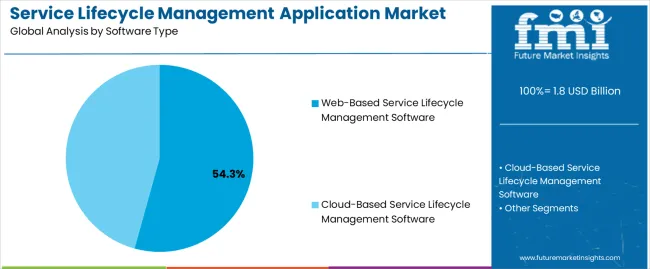
Web-based Software Tracks Almost 54.3% of Market Share

Attributes Details
Top Software Type Web-based Service Lifecycle Management Software
Market share in 2024 54.3%

Web-based SLM software is anticipated to account for 54.3% of the SLM application market in 2024. Service lifecycle management application solutions are increasingly being deployed via web-based software. Industry experts estimate that this trend is anticipated to continue to dominate the market for a subsequent decade.

Web-based service lifecycle management systems offer flexibility and customization. These make updates and modifications to meet an organization's unique demands. Over 50% of workloads are performed on web-hosted services due to scalability, security, and improved collaboration.

The web-based SLM solutions enhance IT operations, service delivery, and customer experience. These help organizations achieve goals and stay competitive, benefiting organizations of all sizes.

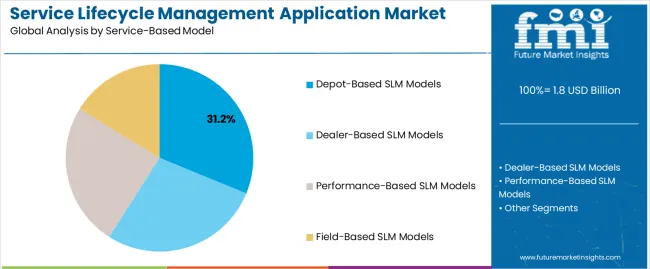
Depot-based Models Gains Traction Around 31.2% of Consumer Base

Attributes Details
Top Service-based Model Depot-based Service Lifecycle Management Models
Market share in 2024 31.20%

The demand for depot-based SLM models is augmented, with a market share of 31.2% in 2024. Depot-based models give an integrated perspective of service delivery, planning, and analysis. This improves operational efficiency and cost-effectiveness for enterprises. They are complete service management systems that encompass a product's whole lifecycle.

Through process simplification, increased information quality, fewer mistakes in manual data input, and improved departmental data visibility, depot-based models give businesses a competitive edge. As a result, decisions are made more effectively, customers are happier, and profits rise.

Depot-based models provide several advantages, including enhanced competitiveness, cost-effectiveness, and operational efficiency, all of which are anticipated to propel market expansion throughout the projected timeframe.

Country-wise Insights

Based on the statistical data, industries in Germany and Japan are set to develop relatively in the upcoming decade. Simultaneously, the SLM application sector in Australia and China is on the way to hitting the roof due to several factors. The SLM technology sector in the United States is anticipated to climb gradually in the upcoming decade.

Countries CAGR from 2024 to 2034
United States 4.90%
Germany 3.50%
China 8.60%
Japan 2.80%
Australia 11.60%

The United States Hits the Roof with the Improvements in the Novel SLM Models

The United States is anticipated to hold a CAGR of 4.9% from 2024 to 2034 in the service lifecycle management application market.

The United States is a tech-savvy nation, particularly North America, which has a competitive edge in the adoption of emerging technologies like smartphones and cloud platforms. This openness to new technologies allows organizations to gain a competitive edge over their counterparts.

The United States’ robust financial position has enabled significant investment in advanced technologies. This investment has given the country a competitive edge in various industries like healthcare, finance, and manufacturing, thereby transforming the industry.

The United States has been a pioneer in embracing emerging technologies like artificial intelligence, blockchain, and IoT. These have revolutionized operations, opened new business opportunities, and generated significant revenue streams for organizations.

Tech-savvy Individuals Invade the Security Surveillance Field in Germany

Demand for SLM software in Germany is estimated to develop at a CAGR of 3.5%, with firms developing innovative solutions for production tracking.

Germany is predicted to emerge significant in the SLM software market due to the presence of major players and the increasing adoption of next-generation technologies like 5G, ML, AR, IoT, LTE, and additive manufacturing.

Germany is anticipated to hold significance in the European market share. This is due to the rapid integration of advanced technologies in various industries, particularly in aerospace, automotive, and healthcare, leading to increased demand for SLM software.

The service lifecycle management application market in Germany is also thriving due to its active investment in research and development, high level of innovation, and competitiveness in SLM software. The region's favorable regulatory environment, supportive government policies, and skilled workforce further contribute to its growth.

Demand for SLM applications has Risen Steeply in China

China is on the brink of a significant market expansion in service management apps, with a projected CAGR of 8.6% from 2024 to 2034.

In China, SLM is in demand as a comprehensive strategy. It integrates various functions like service parts management, technical communication, field service management, and product support operations to ensure maximum customer satisfaction and asset uptime.

Chinese companies use SLM to manage their inventory, procurement, storage, and distribution of service parts. SLM facilitates communication across teams, including product development, design, engineering, and customer support, ensuring alignment and alignment of stakeholders in the product lifecycle.

Service lifecycle management is a necessary practice for Chinese companies, ensuring maximum customer satisfaction and asset uptime by aligning various functions and operations.

Australia Cultivates the Demand for Open-Source Service Hubs

Between 2024 and 2034, Australia is set to experience a remarkable CAGR of 11.6% in the SLM solutions sector. The country's robust economic growth can be attributed to the increased adoption of advanced technologies in various industries and the continued research into the development of novel technologies.

The automated service lifecycle management field is predicted to grow in Australia. This is due to the increasing adoption of automation technologies and the growing demand for services that streamline business processes and improve operational efficiency.

Open-source service hubs are envisioned to boost growth in the Australian market. They enable service providers to use various tools and resources to enhance their offerings, drive innovation, and share knowledge. This accelerates the development and adoption of new service solutions.

Development in the Isolated SLM Applications Skyrockets in Japan

The demand for SLM applications in Japan is foreseen to experience a CAGR of 2.8% from 2024 to 2034.

Through the use of data analytics and predictive maintenance technologies, SLM helps businesses in Japan manage service operations, including maintenance, repair, and upgrades. This helps to identify possible problems early on and take proactive steps to reduce downtime.

In Japan, supply chain management, or SLM, helps businesses monitor product performance, collect customer feedback, and make ongoing improvements to offers. This allows organizations to build lasting connections with customers by delivering dependable, superior products and services.

The outlook for service lifecycle management application solutions in Japan is positive. Providers that can deliver innovative, efficient, and cost-effective solutions are likely to experience strong demand and growth opportunities over the forecast period.

Market Players Shaping the Outlook of the Global Service Lifecycle Management Application Market

Service lifecycle management (SLM) application solution providers are investing in research and development to support future technologies and enhance their service offerings and customer base. These companies are also acquiring or partnering with other companies to strengthen their market position and gain a competitive edge.

Due to the increased use of SLM applications, the global product lifecycle management (PLM) industry is mounting considerably. This has led major companies to concentrate on research and development to provide novel solutions.

The future of the SLM application solutions market looks promising, with a growing number of companies investing in research and development to develop new and innovative solutions. Such market trends are foreseen to continue as companies seek to stay ahead of the curve and meet the ever-changing needs of their customers.

Recent Developments in the Service Lifecycle Management Application Market
  • In January 2024, Plano-based Siemens Digital Industries Software launched a new Teamcenter SLM app on Salesforce AppExchange, integrating Siemens' Xcelerator software with Salesforce Manufacturing Cloud and Service Cloud. The app aims to improve service-centric business models, customer experience, and revenue.
  • In September 2023, Aras, a low-code application platform for complex product design, was named the 2023 technology leader in Quadrant Knowledge Solutions' SPARK Matrix for Product Lifecycle Management. The platform's resilient model and customizable front end make it adaptable and competitive.
  • In August 2023, Enterprise resource planning software vendor IFS acquired Falkonry, an AI-based time-series data analytics tool, to enhance its enterprise asset management (EAM) services portfolio, focusing on connected machines in factories.
  • In April 2023, Siemens Digital Industries Software and IBM are partnering to create a software solution for systems engineering, service lifecycle management, and asset management. The solution aims to optimize product lifecycles, improve traceability, and promote sustainable designs, accelerating innovation and reducing costs.

Key Companies in the Service Lifecycle Management Application Market

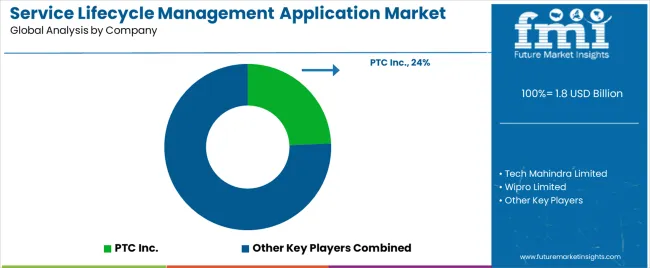
  • PTC Inc.
  • Tech Mahindra Limited
  • Wipro Limited
  • Siemens AG
  • Atos SE
  • TCS Ltd.
  • Oracle Corporation
  • Astea International Inc.
  • IBM Corporation
  • Dassault Systems
  • Tavant Technologies

Key Coverage in the Service Lifecycle Management Application Market Report

  • Study of the Case Studies on Successful Implementation of Service Lifecycle Management Solutions in Large Enterprises in the United States
  • Growth Analysis of the Product Lifecycle Management Market
  • Exploration of the Top 10 Emerging Trends Such as Predictive Maintenance in the Service Lifecycle Management Market
  • Market Analysis of Service Lifecycle Management Solutions for Small and Medium-Sized Businesses in the United States
  • Sales Assessment of Strategies for Optimizing Field Service Operations Using Advanced Service Lifecycle Management Tools
  • Development of the Contract Lifecycle Management Market in the United States

Key Segments

By Software Type:

  • Cloud-based Service Lifecycle Management Software
  • Web-based Service Lifecycle Management Software

By Service-based Model:

  • Field-based SLM Models
  • Depot-based SLM Models
  • Dealer-based SLM Models
  • Performance-based SLM Models

By Solution:

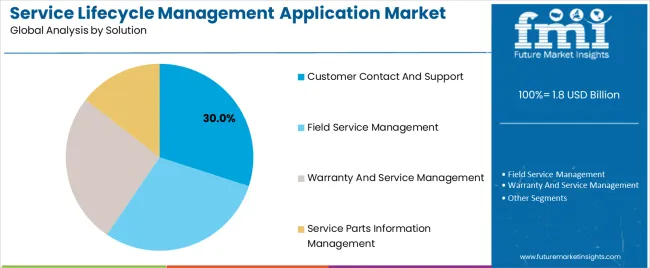
  • Customer Contact and Support
  • Field Service Management
  • Warranty and Service Management
  • Service Parts Information Management

By End-use Industry:

  • Automotive and Transportation
  • Aerospace and Defense
  • Medical Equipment
  • High Technology
  • Telecommunications
  • Industrial Machineries and Equipment

By Region:

  • North America
  • Latin America
  • Europe
  • East Asia
  • South Asia
  • Oceania
  • Middle East and Africa

Table of Content

  • 1. Executive Summary
  • 2. Market Overview
  • 3. Market Background
  • 4. Global Market Analysis 2019 to 2023 and Forecast, 2024 to 2034
  • 5. Global Market Analysis 2019 to 2023 and Forecast 2024 to 2034, By Deployment
    • 5.1. Cloud-Based
    • 5.2. Web-Based
  • 6. Global Market Analysis 2019 to 2023 and Forecast 2024 to 2034, By Service-Based Model
    • 6.1. Field-Based
    • 6.2. Depot-Based
    • 6.3. Dealer-Based
    • 6.4. Performance-Based
  • 7. Global Market Analysis 2019 to 2023 and Forecast 2024 to 2034, By Solution
    • 7.1. Customer Contact & Support
    • 7.2. Field Service Management
    • 7.3. Warranty & Service Management
    • 7.4. Service Parts Information Management
  • 8. Global Market Analysis 2019 to 2023 and Forecast 2024 to 2034, By End-Use Industry
    • 8.1. Automotive & Transportation
    • 8.2. Aerospace & Defence
    • 8.3. Medical Equipment
    • 8.4. High Technology
    • 8.5. Telecommunications
    • 8.6. Industrial Machineries & Equipment
  • 9. Global Market Analysis 2019 to 2023 and Forecast 2024 to 2034, By Region
    • 9.1. North America
    • 9.2. Latin America
    • 9.3. Western Europe
    • 9.4. Eastern Europe
    • 9.5. South Asia and Pacific
    • 9.6. East Asia
    • 9.7. Middle East and Africa
  • 10. North America Market Analysis 2019 to 2023 and Forecast 2024 to 2034, By Country
  • 11. Latin America Market Analysis 2019 to 2023 and Forecast 2024 to 2034, By Country
  • 12. Western Europe Market Analysis 2019 to 2023 and Forecast 2024 to 2034, By Country
  • 13. Eastern Europe Market Analysis 2019 to 2023 and Forecast 2024 to 2034, By Country
  • 14. South Asia and Pacific Market Analysis 2019 to 2023 and Forecast 2024 to 2034, By Country
  • 15. East Asia Market Analysis 2019 to 2023 and Forecast 2024 to 2034, By Country
  • 16. Middle East and Africa Market Analysis 2019 to 2023 and Forecast 2024 to 2034, By Country
  • 17. Key Countries Market Analysis
  • 18. Market Structure Analysis
  • 19. Competition Analysis
    • 19.1. PTC Inc.
    • 19.2. Tech Mahindra Limited
    • 19.3. Wipro Limited
    • 19.4. Siemens AG
    • 19.5. Atos SE
    • 19.6. TCS Ltd.
    • 19.7. Oracle Corporation
    • 19.8. Astea International Inc.
    • 19.9. IBM Corporation
    • 19.10. Dassault Systems
    • 19.11. Tavant Technologies
  • 20. Assumptions & Acronyms Used
  • 21. Research Methodology

List of Tables

Table 1: Global Market Value (US$ Million) Forecast by Region, 2019 to 2034

Table 2: Global Market Value (US$ Million) Forecast by Deployment, 2019 to 2034

Table 3: Global Market Value (US$ Million) Forecast by Service-Based Model, 2019 to 2034

Table 4: Global Market Value (US$ Million) Forecast by Solution , 2019 to 2034

Table 5: Global Market Value (US$ Million) Forecast by End-Use Industry, 2019 to 2034

Table 6: North America Market Value (US$ Million) Forecast by Country, 2019 to 2034

Table 7: North America Market Value (US$ Million) Forecast by Deployment, 2019 to 2034

Table 8: North America Market Value (US$ Million) Forecast by Service-Based Model, 2019 to 2034

Table 9: North America Market Value (US$ Million) Forecast by Solution , 2019 to 2034

Table 10: North America Market Value (US$ Million) Forecast by End-Use Industry, 2019 to 2034

Table 11: Latin America Market Value (US$ Million) Forecast by Country, 2019 to 2034

Table 12: Latin America Market Value (US$ Million) Forecast by Deployment, 2019 to 2034

Table 13: Latin America Market Value (US$ Million) Forecast by Service-Based Model, 2019 to 2034

Table 14: Latin America Market Value (US$ Million) Forecast by Solution , 2019 to 2034

Table 15: Latin America Market Value (US$ Million) Forecast by End-Use Industry, 2019 to 2034

Table 16: Western Europe Market Value (US$ Million) Forecast by Country, 2019 to 2034

Table 17: Western Europe Market Value (US$ Million) Forecast by Deployment, 2019 to 2034

Table 18: Western Europe Market Value (US$ Million) Forecast by Service-Based Model, 2019 to 2034

Table 19: Western Europe Market Value (US$ Million) Forecast by Solution , 2019 to 2034

Table 20: Western Europe Market Value (US$ Million) Forecast by End-Use Industry, 2019 to 2034

Table 21: Eastern Europe Market Value (US$ Million) Forecast by Country, 2019 to 2034

Table 22: Eastern Europe Market Value (US$ Million) Forecast by Deployment, 2019 to 2034

Table 23: Eastern Europe Market Value (US$ Million) Forecast by Service-Based Model, 2019 to 2034

Table 24: Eastern Europe Market Value (US$ Million) Forecast by Solution , 2019 to 2034

Table 25: Eastern Europe Market Value (US$ Million) Forecast by End-Use Industry, 2019 to 2034

Table 26: South Asia and Pacific Market Value (US$ Million) Forecast by Country, 2019 to 2034

Table 27: South Asia and Pacific Market Value (US$ Million) Forecast by Deployment, 2019 to 2034

Table 28: South Asia and Pacific Market Value (US$ Million) Forecast by Service-Based Model, 2019 to 2034

Table 29: South Asia and Pacific Market Value (US$ Million) Forecast by Solution , 2019 to 2034

Table 30: South Asia and Pacific Market Value (US$ Million) Forecast by End-Use Industry, 2019 to 2034

Table 31: East Asia Market Value (US$ Million) Forecast by Country, 2019 to 2034

Table 32: East Asia Market Value (US$ Million) Forecast by Deployment, 2019 to 2034

Table 33: East Asia Market Value (US$ Million) Forecast by Service-Based Model, 2019 to 2034

Table 34: East Asia Market Value (US$ Million) Forecast by Solution , 2019 to 2034

Table 35: East Asia Market Value (US$ Million) Forecast by End-Use Industry, 2019 to 2034

Table 36: Middle East and Africa Market Value (US$ Million) Forecast by Country, 2019 to 2034

Table 37: Middle East and Africa Market Value (US$ Million) Forecast by Deployment, 2019 to 2034

Table 38: Middle East and Africa Market Value (US$ Million) Forecast by Service-Based Model, 2019 to 2034

Table 39: Middle East and Africa Market Value (US$ Million) Forecast by Solution , 2019 to 2034

Table 40: Middle East and Africa Market Value (US$ Million) Forecast by End-Use Industry, 2019 to 2034

List of Figures

Figure 1: Global Market Value (US$ Million) by Deployment, 2024 to 2034

Figure 2: Global Market Value (US$ Million) by Service-Based Model, 2024 to 2034

Figure 3: Global Market Value (US$ Million) by Solution , 2024 to 2034

Figure 4: Global Market Value (US$ Million) by End-Use Industry, 2024 to 2034

Figure 5: Global Market Value (US$ Million) by Region, 2024 to 2034

Figure 6: Global Market Value (US$ Million) Analysis by Region, 2019 to 2034

Figure 7: Global Market Value Share (%) and BPS Analysis by Region, 2024 to 2034

Figure 8: Global Market Y-o-Y Growth (%) Projections by Region, 2024 to 2034

Figure 9: Global Market Value (US$ Million) Analysis by Deployment, 2019 to 2034

Figure 10: Global Market Value Share (%) and BPS Analysis by Deployment, 2024 to 2034

Figure 11: Global Market Y-o-Y Growth (%) Projections by Deployment, 2024 to 2034

Figure 12: Global Market Value (US$ Million) Analysis by Service-Based Model, 2019 to 2034

Figure 13: Global Market Value Share (%) and BPS Analysis by Service-Based Model, 2024 to 2034

Figure 14: Global Market Y-o-Y Growth (%) Projections by Service-Based Model, 2024 to 2034

Figure 15: Global Market Value (US$ Million) Analysis by Solution , 2019 to 2034

Figure 16: Global Market Value Share (%) and BPS Analysis by Solution , 2024 to 2034

Figure 17: Global Market Y-o-Y Growth (%) Projections by Solution , 2024 to 2034

Figure 18: Global Market Value (US$ Million) Analysis by End-Use Industry, 2019 to 2034

Figure 19: Global Market Value Share (%) and BPS Analysis by End-Use Industry, 2024 to 2034

Figure 20: Global Market Y-o-Y Growth (%) Projections by End-Use Industry, 2024 to 2034

Figure 21: Global Market Attractiveness by Deployment, 2024 to 2034

Figure 22: Global Market Attractiveness by Service-Based Model, 2024 to 2034

Figure 23: Global Market Attractiveness by Solution , 2024 to 2034

Figure 24: Global Market Attractiveness by End-Use Industry, 2024 to 2034

Figure 25: Global Market Attractiveness by Region, 2024 to 2034

Figure 26: North America Market Value (US$ Million) by Deployment, 2024 to 2034

Figure 27: North America Market Value (US$ Million) by Service-Based Model, 2024 to 2034

Figure 28: North America Market Value (US$ Million) by Solution , 2024 to 2034

Figure 29: North America Market Value (US$ Million) by End-Use Industry, 2024 to 2034

Figure 30: North America Market Value (US$ Million) by Country, 2024 to 2034

Figure 31: North America Market Value (US$ Million) Analysis by Country, 2019 to 2034

Figure 32: North America Market Value Share (%) and BPS Analysis by Country, 2024 to 2034

Figure 33: North America Market Y-o-Y Growth (%) Projections by Country, 2024 to 2034

Figure 34: North America Market Value (US$ Million) Analysis by Deployment, 2019 to 2034

Figure 35: North America Market Value Share (%) and BPS Analysis by Deployment, 2024 to 2034

Figure 36: North America Market Y-o-Y Growth (%) Projections by Deployment, 2024 to 2034

Figure 37: North America Market Value (US$ Million) Analysis by Service-Based Model, 2019 to 2034

Figure 38: North America Market Value Share (%) and BPS Analysis by Service-Based Model, 2024 to 2034

Figure 39: North America Market Y-o-Y Growth (%) Projections by Service-Based Model, 2024 to 2034

Figure 40: North America Market Value (US$ Million) Analysis by Solution , 2019 to 2034

Figure 41: North America Market Value Share (%) and BPS Analysis by Solution , 2024 to 2034

Figure 42: North America Market Y-o-Y Growth (%) Projections by Solution , 2024 to 2034

Figure 43: North America Market Value (US$ Million) Analysis by End-Use Industry, 2019 to 2034

Figure 44: North America Market Value Share (%) and BPS Analysis by End-Use Industry, 2024 to 2034

Figure 45: North America Market Y-o-Y Growth (%) Projections by End-Use Industry, 2024 to 2034

Figure 46: North America Market Attractiveness by Deployment, 2024 to 2034

Figure 47: North America Market Attractiveness by Service-Based Model, 2024 to 2034

Figure 48: North America Market Attractiveness by Solution , 2024 to 2034

Figure 49: North America Market Attractiveness by End-Use Industry, 2024 to 2034

Figure 50: North America Market Attractiveness by Country, 2024 to 2034

Figure 51: Latin America Market Value (US$ Million) by Deployment, 2024 to 2034

Figure 52: Latin America Market Value (US$ Million) by Service-Based Model, 2024 to 2034

Figure 53: Latin America Market Value (US$ Million) by Solution , 2024 to 2034

Figure 54: Latin America Market Value (US$ Million) by End-Use Industry, 2024 to 2034

Figure 55: Latin America Market Value (US$ Million) by Country, 2024 to 2034

Figure 56: Latin America Market Value (US$ Million) Analysis by Country, 2019 to 2034

Figure 57: Latin America Market Value Share (%) and BPS Analysis by Country, 2024 to 2034

Figure 58: Latin America Market Y-o-Y Growth (%) Projections by Country, 2024 to 2034

Figure 59: Latin America Market Value (US$ Million) Analysis by Deployment, 2019 to 2034

Figure 60: Latin America Market Value Share (%) and BPS Analysis by Deployment, 2024 to 2034

Figure 61: Latin America Market Y-o-Y Growth (%) Projections by Deployment, 2024 to 2034

Figure 62: Latin America Market Value (US$ Million) Analysis by Service-Based Model, 2019 to 2034

Figure 63: Latin America Market Value Share (%) and BPS Analysis by Service-Based Model, 2024 to 2034

Figure 64: Latin America Market Y-o-Y Growth (%) Projections by Service-Based Model, 2024 to 2034

Figure 65: Latin America Market Value (US$ Million) Analysis by Solution , 2019 to 2034

Figure 66: Latin America Market Value Share (%) and BPS Analysis by Solution , 2024 to 2034

Figure 67: Latin America Market Y-o-Y Growth (%) Projections by Solution , 2024 to 2034

Figure 68: Latin America Market Value (US$ Million) Analysis by End-Use Industry, 2019 to 2034

Figure 69: Latin America Market Value Share (%) and BPS Analysis by End-Use Industry, 2024 to 2034

Figure 70: Latin America Market Y-o-Y Growth (%) Projections by End-Use Industry, 2024 to 2034

Figure 71: Latin America Market Attractiveness by Deployment, 2024 to 2034

Figure 72: Latin America Market Attractiveness by Service-Based Model, 2024 to 2034

Figure 73: Latin America Market Attractiveness by Solution , 2024 to 2034

Figure 74: Latin America Market Attractiveness by End-Use Industry, 2024 to 2034

Figure 75: Latin America Market Attractiveness by Country, 2024 to 2034

Figure 76: Western Europe Market Value (US$ Million) by Deployment, 2024 to 2034

Figure 77: Western Europe Market Value (US$ Million) by Service-Based Model, 2024 to 2034

Figure 78: Western Europe Market Value (US$ Million) by Solution , 2024 to 2034

Figure 79: Western Europe Market Value (US$ Million) by End-Use Industry, 2024 to 2034

Figure 80: Western Europe Market Value (US$ Million) by Country, 2024 to 2034

Figure 81: Western Europe Market Value (US$ Million) Analysis by Country, 2019 to 2034

Figure 82: Western Europe Market Value Share (%) and BPS Analysis by Country, 2024 to 2034

Figure 83: Western Europe Market Y-o-Y Growth (%) Projections by Country, 2024 to 2034

Figure 84: Western Europe Market Value (US$ Million) Analysis by Deployment, 2019 to 2034

Figure 85: Western Europe Market Value Share (%) and BPS Analysis by Deployment, 2024 to 2034

Figure 86: Western Europe Market Y-o-Y Growth (%) Projections by Deployment, 2024 to 2034

Figure 87: Western Europe Market Value (US$ Million) Analysis by Service-Based Model, 2019 to 2034

Figure 88: Western Europe Market Value Share (%) and BPS Analysis by Service-Based Model, 2024 to 2034

Figure 89: Western Europe Market Y-o-Y Growth (%) Projections by Service-Based Model, 2024 to 2034

Figure 90: Western Europe Market Value (US$ Million) Analysis by Solution , 2019 to 2034

Figure 91: Western Europe Market Value Share (%) and BPS Analysis by Solution , 2024 to 2034

Figure 92: Western Europe Market Y-o-Y Growth (%) Projections by Solution , 2024 to 2034

Figure 93: Western Europe Market Value (US$ Million) Analysis by End-Use Industry, 2019 to 2034

Figure 94: Western Europe Market Value Share (%) and BPS Analysis by End-Use Industry, 2024 to 2034

Figure 95: Western Europe Market Y-o-Y Growth (%) Projections by End-Use Industry, 2024 to 2034

Figure 96: Western Europe Market Attractiveness by Deployment, 2024 to 2034

Figure 97: Western Europe Market Attractiveness by Service-Based Model, 2024 to 2034

Figure 98: Western Europe Market Attractiveness by Solution , 2024 to 2034

Figure 99: Western Europe Market Attractiveness by End-Use Industry, 2024 to 2034

Figure 100: Western Europe Market Attractiveness by Country, 2024 to 2034

Figure 101: Eastern Europe Market Value (US$ Million) by Deployment, 2024 to 2034

Figure 102: Eastern Europe Market Value (US$ Million) by Service-Based Model, 2024 to 2034

Figure 103: Eastern Europe Market Value (US$ Million) by Solution , 2024 to 2034

Figure 104: Eastern Europe Market Value (US$ Million) by End-Use Industry, 2024 to 2034

Figure 105: Eastern Europe Market Value (US$ Million) by Country, 2024 to 2034

Figure 106: Eastern Europe Market Value (US$ Million) Analysis by Country, 2019 to 2034

Figure 107: Eastern Europe Market Value Share (%) and BPS Analysis by Country, 2024 to 2034

Figure 108: Eastern Europe Market Y-o-Y Growth (%) Projections by Country, 2024 to 2034

Figure 109: Eastern Europe Market Value (US$ Million) Analysis by Deployment, 2019 to 2034

Figure 110: Eastern Europe Market Value Share (%) and BPS Analysis by Deployment, 2024 to 2034

Figure 111: Eastern Europe Market Y-o-Y Growth (%) Projections by Deployment, 2024 to 2034

Figure 112: Eastern Europe Market Value (US$ Million) Analysis by Service-Based Model, 2019 to 2034

Figure 113: Eastern Europe Market Value Share (%) and BPS Analysis by Service-Based Model, 2024 to 2034

Figure 114: Eastern Europe Market Y-o-Y Growth (%) Projections by Service-Based Model, 2024 to 2034

Figure 115: Eastern Europe Market Value (US$ Million) Analysis by Solution , 2019 to 2034

Figure 116: Eastern Europe Market Value Share (%) and BPS Analysis by Solution , 2024 to 2034

Figure 117: Eastern Europe Market Y-o-Y Growth (%) Projections by Solution , 2024 to 2034

Figure 118: Eastern Europe Market Value (US$ Million) Analysis by End-Use Industry, 2019 to 2034

Figure 119: Eastern Europe Market Value Share (%) and BPS Analysis by End-Use Industry, 2024 to 2034

Figure 120: Eastern Europe Market Y-o-Y Growth (%) Projections by End-Use Industry, 2024 to 2034

Figure 121: Eastern Europe Market Attractiveness by Deployment, 2024 to 2034

Figure 122: Eastern Europe Market Attractiveness by Service-Based Model, 2024 to 2034

Figure 123: Eastern Europe Market Attractiveness by Solution , 2024 to 2034

Figure 124: Eastern Europe Market Attractiveness by End-Use Industry, 2024 to 2034

Figure 125: Eastern Europe Market Attractiveness by Country, 2024 to 2034

Figure 126: South Asia and Pacific Market Value (US$ Million) by Deployment, 2024 to 2034

Figure 127: South Asia and Pacific Market Value (US$ Million) by Service-Based Model, 2024 to 2034

Figure 128: South Asia and Pacific Market Value (US$ Million) by Solution , 2024 to 2034

Figure 129: South Asia and Pacific Market Value (US$ Million) by End-Use Industry, 2024 to 2034

Figure 130: South Asia and Pacific Market Value (US$ Million) by Country, 2024 to 2034

Figure 131: South Asia and Pacific Market Value (US$ Million) Analysis by Country, 2019 to 2034

Figure 132: South Asia and Pacific Market Value Share (%) and BPS Analysis by Country, 2024 to 2034

Figure 133: South Asia and Pacific Market Y-o-Y Growth (%) Projections by Country, 2024 to 2034

Figure 134: South Asia and Pacific Market Value (US$ Million) Analysis by Deployment, 2019 to 2034

Figure 135: South Asia and Pacific Market Value Share (%) and BPS Analysis by Deployment, 2024 to 2034

Figure 136: South Asia and Pacific Market Y-o-Y Growth (%) Projections by Deployment, 2024 to 2034

Figure 137: South Asia and Pacific Market Value (US$ Million) Analysis by Service-Based Model, 2019 to 2034

Figure 138: South Asia and Pacific Market Value Share (%) and BPS Analysis by Service-Based Model, 2024 to 2034

Figure 139: South Asia and Pacific Market Y-o-Y Growth (%) Projections by Service-Based Model, 2024 to 2034

Figure 140: South Asia and Pacific Market Value (US$ Million) Analysis by Solution , 2019 to 2034

Figure 141: South Asia and Pacific Market Value Share (%) and BPS Analysis by Solution , 2024 to 2034

Figure 142: South Asia and Pacific Market Y-o-Y Growth (%) Projections by Solution , 2024 to 2034

Figure 143: South Asia and Pacific Market Value (US$ Million) Analysis by End-Use Industry, 2019 to 2034

Figure 144: South Asia and Pacific Market Value Share (%) and BPS Analysis by End-Use Industry, 2024 to 2034

Figure 145: South Asia and Pacific Market Y-o-Y Growth (%) Projections by End-Use Industry, 2024 to 2034

Figure 146: South Asia and Pacific Market Attractiveness by Deployment, 2024 to 2034

Figure 147: South Asia and Pacific Market Attractiveness by Service-Based Model, 2024 to 2034

Figure 148: South Asia and Pacific Market Attractiveness by Solution , 2024 to 2034

Figure 149: South Asia and Pacific Market Attractiveness by End-Use Industry, 2024 to 2034

Figure 150: South Asia and Pacific Market Attractiveness by Country, 2024 to 2034

Figure 151: East Asia Market Value (US$ Million) by Deployment, 2024 to 2034

Figure 152: East Asia Market Value (US$ Million) by Service-Based Model, 2024 to 2034

Figure 153: East Asia Market Value (US$ Million) by Solution , 2024 to 2034

Figure 154: East Asia Market Value (US$ Million) by End-Use Industry, 2024 to 2034

Figure 155: East Asia Market Value (US$ Million) by Country, 2024 to 2034

Figure 156: East Asia Market Value (US$ Million) Analysis by Country, 2019 to 2034

Figure 157: East Asia Market Value Share (%) and BPS Analysis by Country, 2024 to 2034

Figure 158: East Asia Market Y-o-Y Growth (%) Projections by Country, 2024 to 2034

Figure 159: East Asia Market Value (US$ Million) Analysis by Deployment, 2019 to 2034

Figure 160: East Asia Market Value Share (%) and BPS Analysis by Deployment, 2024 to 2034

Figure 161: East Asia Market Y-o-Y Growth (%) Projections by Deployment, 2024 to 2034

Figure 162: East Asia Market Value (US$ Million) Analysis by Service-Based Model, 2019 to 2034

Figure 163: East Asia Market Value Share (%) and BPS Analysis by Service-Based Model, 2024 to 2034

Figure 164: East Asia Market Y-o-Y Growth (%) Projections by Service-Based Model, 2024 to 2034

Figure 165: East Asia Market Value (US$ Million) Analysis by Solution , 2019 to 2034

Figure 166: East Asia Market Value Share (%) and BPS Analysis by Solution , 2024 to 2034

Figure 167: East Asia Market Y-o-Y Growth (%) Projections by Solution , 2024 to 2034

Figure 168: East Asia Market Value (US$ Million) Analysis by End-Use Industry, 2019 to 2034

Figure 169: East Asia Market Value Share (%) and BPS Analysis by End-Use Industry, 2024 to 2034

Figure 170: East Asia Market Y-o-Y Growth (%) Projections by End-Use Industry, 2024 to 2034

Figure 171: East Asia Market Attractiveness by Deployment, 2024 to 2034

Figure 172: East Asia Market Attractiveness by Service-Based Model, 2024 to 2034

Figure 173: East Asia Market Attractiveness by Solution , 2024 to 2034

Figure 174: East Asia Market Attractiveness by End-Use Industry, 2024 to 2034

Figure 175: East Asia Market Attractiveness by Country, 2024 to 2034

Figure 176: Middle East and Africa Market Value (US$ Million) by Deployment, 2024 to 2034

Figure 177: Middle East and Africa Market Value (US$ Million) by Service-Based Model, 2024 to 2034

Figure 178: Middle East and Africa Market Value (US$ Million) by Solution , 2024 to 2034

Figure 179: Middle East and Africa Market Value (US$ Million) by End-Use Industry, 2024 to 2034

Figure 180: Middle East and Africa Market Value (US$ Million) by Country, 2024 to 2034

Figure 181: Middle East and Africa Market Value (US$ Million) Analysis by Country, 2019 to 2034

Figure 182: Middle East and Africa Market Value Share (%) and BPS Analysis by Country, 2024 to 2034

Figure 183: Middle East and Africa Market Y-o-Y Growth (%) Projections by Country, 2024 to 2034

Figure 184: Middle East and Africa Market Value (US$ Million) Analysis by Deployment, 2019 to 2034

Figure 185: Middle East and Africa Market Value Share (%) and BPS Analysis by Deployment, 2024 to 2034

Figure 186: Middle East and Africa Market Y-o-Y Growth (%) Projections by Deployment, 2024 to 2034

Figure 187: Middle East and Africa Market Value (US$ Million) Analysis by Service-Based Model, 2019 to 2034

Figure 188: Middle East and Africa Market Value Share (%) and BPS Analysis by Service-Based Model, 2024 to 2034

Figure 189: Middle East and Africa Market Y-o-Y Growth (%) Projections by Service-Based Model, 2024 to 2034

Figure 190: Middle East and Africa Market Value (US$ Million) Analysis by Solution , 2019 to 2034

Figure 191: Middle East and Africa Market Value Share (%) and BPS Analysis by Solution , 2024 to 2034

Figure 192: Middle East and Africa Market Y-o-Y Growth (%) Projections by Solution , 2024 to 2034

Figure 193: Middle East and Africa Market Value (US$ Million) Analysis by End-Use Industry, 2019 to 2034

Figure 194: Middle East and Africa Market Value Share (%) and BPS Analysis by End-Use Industry, 2024 to 2034

Figure 195: Middle East and Africa Market Y-o-Y Growth (%) Projections by End-Use Industry, 2024 to 2034

Figure 196: Middle East and Africa Market Attractiveness by Deployment, 2024 to 2034

Figure 197: Middle East and Africa Market Attractiveness by Service-Based Model, 2024 to 2034

Figure 198: Middle East and Africa Market Attractiveness by Solution , 2024 to 2034

Figure 199: Middle East and Africa Market Attractiveness by End-Use Industry, 2024 to 2034

Figure 200: Middle East and Africa Market Attractiveness by Country, 2024 to 2034

Frequently Asked Questions

How Big Is the SLM Market?

The market is valued at USD 1.69 billion in 2024.

What is the Future of the Service Lifecycle Management Application Market?

The market will be valued at USD 3.69 billion by 2034.

What is the Size of the SML Market in the United States?

In the United States, demand for SLM solutions is anticipated to develop a CAGR of 4.9% by 2034.

What is the Forecast for the Service Lifecycle Management Application Market?

The market is to register a CAGR of 8.10% from 2024 to 2034.

How is the Demand for Service Lifecycle Management Application Software in 2024?

Web-based SLM software is anticipated to acquire a 54.3% market share in 2024.

Explore Similar Insights

Future Market Insights

Service Lifecycle Management Application Market