ServiceNow Tech Services Market
Surging Adoption of ServiceNow Tech Services to Improve Employee Productivity and Eliminate Outages: Plan your Strategy with Insights from FMI
ServiceNow Tech Services Market by Service, Enterprise Size, Industry, End-User and Region Forecast 2023–2033
ServiceNow Tech Services Market Outlook
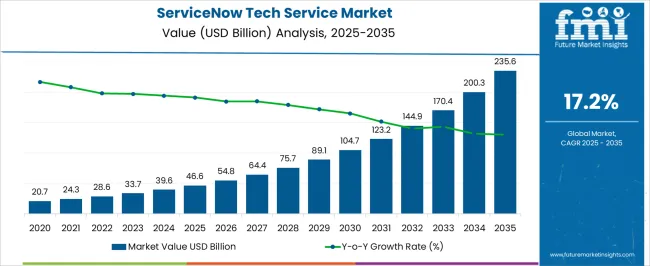
According to Future Market Insights' study, the market for ServiceNow tech services is expected to witness an impressive CAGR of 17.4% over the forecast period. The market value is expected to grow from US$ 24.8 Bn in 2023 to US$ 123.2 Bn by 2033. Some of the key factors aiding the market growth include:
- Rising demand for enhanced digital experiences to upscale the organization’s output.
- Surging adoption of ServiceNow tech services by the IT sector, in a bid to transform companies’ operations to extract the optimum amount of cost, productivity, and resilience with a single platform.
- Increasing adoption by numerous enterprises, varying in size, to connect people, systems, and functions across the organization to streamline digital workflows.
- Growing demand to personalize value acceleration so as to realize the value faster with the help of expert guidance, preventive tools, and premium support to facilitate digital transformation.
Attributes |
Details |
ServiceNow Tech Services Market CAGR (2023-2033) |
17.4% |
ServiceNow Tech Services Market Size (2023) |
US$ 24.8 Bn |
ServiceNow Tech Services Market Size (2033) |
US$ 123.2 Bn |
Let us know your requirement to get
100% FREE customization
Historical Outlook V/S Future Projections for ServiceNow Tech Services Market
The global ServiceNow tech services market increased from US$ 12.1 Bn to US$ 21.3 Bn between 2018 and 2022. The market growth in the historical period has been determined by the rising expenditure by end-use enterprises in cloud analytical tools to enhance their digital infrastructure and upgrades.
ServiceNow tech services provides analytics pertaining to structured and unstructured data, thus enabling organizations to identify present market trends and obtain actionable insights. Due to the effectiveness of ServiceNow tech services, the same has been witnessing a steady growth rate in years between 2018-2022.
Even though the outburst of coronavirus impinged on the market growth in the first two quarters, the ServiceNow tech services market bounced back and exhibited an upward market growth, arriving at a market valuation of US$ 18.4 Bn in 2020, a significant rise from the value of US$ 15.9 Bn attained by 2019. Surge in demand for ServiceNow tech services as the end-use industries zeroed in on the digitalization of their business models in the pandemic to enable remote working facilities for their workforce, led to increased adoption of ServiceNow tech services in 2020.
Going forward, the market is forecast to plow ahead to attain a market valuation of US 123.2 Bn by 2033 end, tremendously growing at a CAGR of 17.4% over the forecast period. Various market propellants contributing to the overall market growth, such as the latest technological advancements in Artificial Intelligence (AI), Blockchain, cybersecurity, Machine Learning (ML), etc., new additions of features to the existing line of services, and beneficial governmental initiatives. Further, the rising demand for ServiceNow tech services is motivating the key players to invest in software R&D activities to innovate new products and boost their brand value.
Innovations and Opportunities in ServiceNow Tech Services Market
The ServiceNow tech services market is forecast to witness several opportunities on account of rapidly growing and transforming technology industry. The tech companies need to innovate and concurrently manage their current product or service portfolio to stay relevant in the market. With the help of ServiceNow’s cloud based platform, companies automate their internal processes across every department, thereby boosting teams to drive output and innovation.
Additionally, in the energy and utilities industry, the demand for these services is predicted to increase as companies are replacing the outdated, manual processes with the ServiceNow tech services to stay competitive in the changing environment. The desire for automation, the elimination of inefficiencies, and performance indicators to enhance business decisions is forecast to expand, which will lead to an increase in the use of ServiceNow tech solutions.
Besides the emerging demand from energy and utilities, and technology industries, other thriving sectors, such as healthcare, financial services, communications and media, businesses services, life sciences, and manufacturing are expected to manoeuvr the market growth of ServiceNow tech services.
Find your sweet spots for generating winning opportunities in this market.
Talk to AnalystWhat are the Key ServiceNow Tech Services Market Challenges?
The high costs associated with the purchase of ServiceNow tech services and rising digital threats are might restrict the market growth. In order to boost the efficiency and reliability of the services, the key players would require to invest more, thus raising the cost of these services. Moreover, surging cyber-attacks like viruses, ransomware, Distributed Denial-of-Service (DDoS), and Corporate Account Takeover (CATO) are adversely affecting the sales of ServiceNow tech services. The market players need to take these challenges into consideration while taking their next move towards service development.
Comparative View of Adjacent ServiceNow Tech Services Market
ServiceNow Tech Services Market:
Attributes |
ServiceNow Tech Services Market |
CAGR (2023-2033) |
17.4% |
Market Value (2033) |
US$ 123.2 Bn |
Growth Factor |
The market is being driven by the increasing adoption of ServiceNow tech services by numerous enterprises, varying in size, to connect people, systems, and functions across the organization to streamline digital workflows. |
Opportunity |
Emerging demand from energy and utilities, technology, healthcare, financial services, communications and media, businesses services, and other industries are expected to create growth opportunities for the market. |
Key Trends |
Surging demand for ServiceNow tech services is motivating the key players to invest in software R&D activities to innovate new products and boost their brand value. |
Enterprise Software Market:
Attributes |
Enterprise Software Market |
CAGR (2023-2033) |
12% |
Market Value (2033) |
US$ 681.80 Bn |
Growth Factor |
The market is being propelled as governments across the globe are initiating supportive measures to digitalize their infrastructure through considerable investment in software and technology sector. |
Opportunity |
Integrating technologies, such as AI, ML, Blockchain, and cybersecurity into enterprise software enhances software adaptability and efficiency, creating a positive market outlook. |
Key Trends |
Adoption of various business strategies, like mergers and acquisitions, by the key players to enhance service offerings, are expanding the market size. |
Enterprise-Grade DLT Market:
Attributes |
Enterprise-Grade DLT Market |
CAGR (2023-2033) |
26.7% |
Market Value (2033) |
US$ 38.8 Mn |
Growth Factor |
The market is being driven by the growing susceptibility of distributed IT environments to privacy related concerns, thus fueling the demand for enterprise-grade DLT. |
Opportunity |
Many pioneers are implementing distributed ledger solutions for a decentralized network of IoT devices, thus propelling market growth over the coming years. |
Key Trends |
Rising venture capital fundings and investment in the technology, wide application of enterprise-grade DLT solutions, including smart contracts, payment, and digital entities, are all bolstering the market growth. |

A unified Market Research Subscription Platform, built for today's disparate research needs.
Segmentation Analysis of the ServiceNow Tech Services Market
By Service, IT Asset Management Services are Anticipated to Witness Rapid Growth in the ServiceNow Tech Services Market
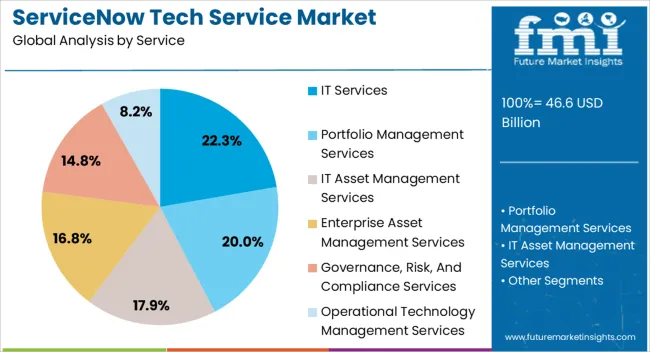
The IT asset management services segment is predicted to exhibit the fastest CAGR of 18.2% over the forecast period. The reasons behind such considerable growth can be attributed to the expected heightened deployment of ServiceNow tech services for the purpose of asset management to digitize IT workflows. The ServiceNow tech services cater to the dynamic demands of the IT sector, such as cost reduction, risk mitigation, enhanced visibility of asset estate.
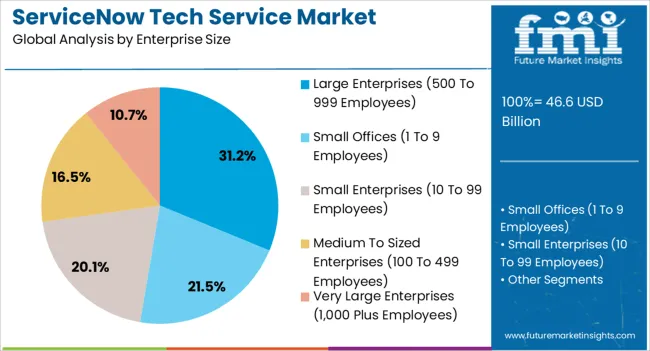
Based on Enterprise Size, Very Large Enterprises (1,000+ employees) Hold the Largest Market Share
As of 2021, the very large enterprises (1,000+ employees) represent largest share of the market, accounting 28.2% of the overall market. Very large enterprises have been receptive to the adoption of ServiceNow tech services, owing to the high focus of such enterprises to invest in novel technologies to advance their workflows. Another prominent reason for highest adoption of these services by very large enterprises is the availability of funds with these organizations. As the costs related to ServiceNow tech services would lessen over the years, these solutions are predicted to be adopted by small offices as well.
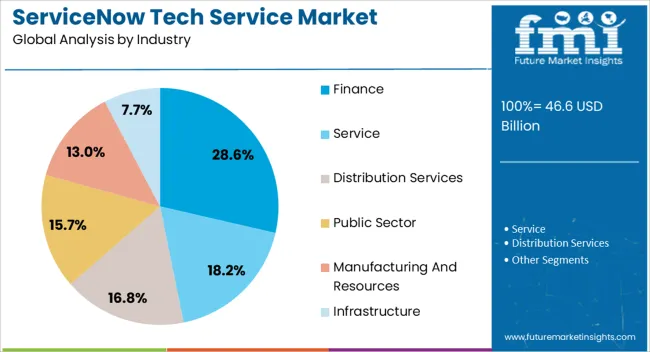
On the Basis of Industry, Finance Industry is Forecast to Experience Robust Growth
Over the forecast period, finance industry is estimated to witness speedy growth, expanding at a CAGR of 17.9%. The enterprise-grade DLT services are anticipated to be heavily deployed by finance industry owing to multiple factors. They provide an edge over other competitors by consolidating, automating, and streamlining services. Further, many key players in the market offer suite of applications that help the client to be distinguished among its competitors.
North America Represents the Largest Market Share in ServiceNow Tech Services Market
North America ServiceNow tech services market accounts for 35.9% of the overall market share, as of 2021. The market growth can be credited to the rising adoption of ServiceNow tech services due to its operational efficiency and reduced maintenance costs. Moreover, the high density of key players in the region, further enlarging their service offerings due to intense competition in the market, is invigorating the regional market growth.
Development of Additional Solutions by Key Players to Boost Engagement and Productivity
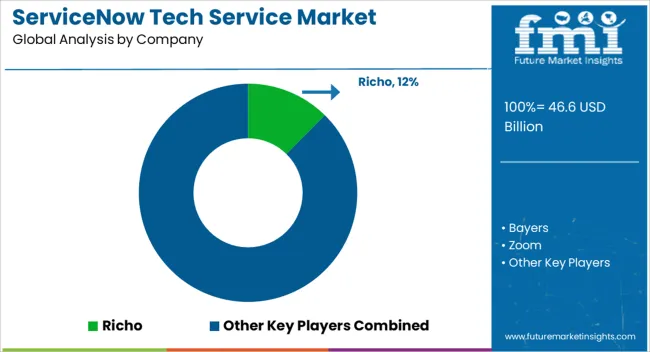
The key players in the market are focusing on enhancing their service offering, acquisition and mergers, and innovating new services to meet new and complex demand of end use industries. The thriving end use industries are expected to create heightened demand for ServiceNow tech services in the forecast period, thus creating more opportunities for market expansion. Some of the key players in the market include ServiceNow, Broadcom Inc. (CA Technologies, Inc.), Epicor Software Corporation, Hewlett Packard Enterprise, IBM Corporation, Microsoft Corporation, Oracle Corporation, Salesforce.com, Inc., SAP SE, SYSPRO, and Zoho Corporation Pvt. Ltd.
- In September 2022, ServiceNow announced the launch of Now Platform Tokyo, which is designed to assist organizations in navigating complex business challenges in the midst of an unpredictable macro environment.
- Later, in the same month and year, the company announced that it is adding more new features in Now Platform Tokyo to help deliver improved customer and employee experiences, and streamline employee scheduling and order management.
ServiceNow Tech Services Market by Category
By Service, ServiceNow tech services market is segmented as:
- IT Services
- Portfolio Management Services
- IT Asset Management Services
- Enterprise Asset Management Services
- Governance, Risk, and Compliance Services
- Operational Technology Management Services
By Enterprise Size, ServiceNow tech services market is segmented as:
- Small Offices (1-9 employees)
- Small Enterprises (10-99 employees)
- Medium-sized Enterprises (100-499 employees)
- Large Enterprises (500-999 employees)
- Very Large Enterprises (1,000+ employees)
By Industry, ServiceNow tech services market is segmented as:
- Service
- Distribution Services
- Public Sector
- Finance
- Manufacturing and Resources
- Infrastructure
By Region, ServiceNow tech services market is segmented as:
- North America
- Latin America
- Europe
- Asia Pacific
- Oceania
- MEA
Frequently Asked Questions
The ServiceNow tech services market is predicted to reach nearly US$ 24.8 Bn by 2023.
The ServiceNow tech services market is expected to rise at a tremendous CAGR of 17.4%.
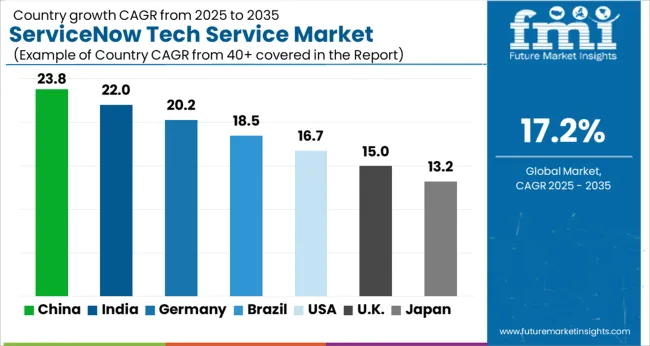
India, Japan, China, and Germany are the major countries driving the demand for ServiceNow tech services market.
The global demand for ServiceNow tech services market is forecast to surpass US$ 123.2 Bn by the year 2033.
Table of Content
1. Executive Summary
1.1. Global Market Outlook
1.2. Demand-side Trends
1.3. Supply-side Trends
1.4. Technology Roadmap Analysis
1.5. Analysis and Recommendations
2. Market Overview
2.1. Market Coverage / Taxonomy
2.2. Market Definition / Scope / Limitations
3. Market Background
3.1. Market Dynamics
3.1.1. Drivers
3.1.2. Restraints
3.1.3. Opportunity
3.1.4. Trends
3.2. Scenario Forecast
3.2.1. Demand in Optimistic Scenario
3.2.2. Demand in Likely Scenario
3.2.3. Demand in Conservative Scenario
3.3. Opportunity Map Analysis
3.4. Investment Feasibility Matrix
3.5. PESTLE and Porter’s Analysis
3.6. Regulatory Landscape
3.6.1. By Key Regions
3.6.2. By Key Countries
3.7. Regional Parent Market Outlook
4. Global Market Analysis 2018-2022 and Forecast, 2023-2033
4.1. Historical Market Size Value (US$ Mn) Analysis, 2018-2022
4.2. Current and Future Market Size Value (US$ Mn) Projections, 2023-2033
4.2.1. Y-o-Y Growth Trend Analysis
4.2.2. Absolute $ Opportunity Analysis
5. Global Market Analysis 2018-2022 and Forecast 2023-2033, By Deployment
5.1. Introduction / Key Findings
5.2. Historical Market Size Value (US$ Mn) Analysis By Deployment, 2018-2022
5.3. Current and Future Market Size Value (US$ Mn) Analysis and Forecast By Deployment, 2023-2033
5.3.1. Cloud
5.3.2. On-Premises
5.3.3. Smart Phone and Tablet
5.4. Y-o-Y Growth Trend Analysis By Deployment, 2018-2022
5.5. Absolute $ Opportunity Analysis By Deployment, 2023-2033
6. Global Market Analysis 2018-2022 and Forecast 2023-2033, By Component
6.1. Introduction / Key Findings
6.2. Historical Market Size Value (US$ Mn) Analysis By Component, 2018-2022
6.3. Current and Future Market Size Value (US$ Mn) Analysis and Forecast By Component, 2023-2033
6.3.1. Software
6.3.2. Service
6.4. Y-o-Y Growth Trend Analysis By Component, 2018-2022
6.5. Absolute $ Opportunity Analysis By Component, 2023-2033
7. Global Market Analysis 2018-2022 and Forecast 2023-2033, By Industry Size
7.1. Introduction / Key Findings
7.2. Historical Market Size Value (US$ Mn) Analysis By Industry Size , 2018-2022
7.3. Current and Future Market Size Value (US$ Mn) Analysis and Forecast By Industry Size , 2023-2033
7.3.1. Large enterprises
7.3.2. Small or Medium enterprises
7.4. Y-o-Y Growth Trend Analysis By Industry Size , 2018-2022
7.5. Absolute $ Opportunity Analysis By Industry Size , 2023-2033
8. Global Market Analysis 2018-2022 and Forecast 2023-2033, By Verticals
8.1. Introduction / Key Findings
8.2. Historical Market Size Value (US$ Mn) Analysis By Verticals, 2018-2022
8.3. Current and Future Market Size Value (US$ Mn) Analysis and Forecast By Verticals, 2023-2033
8.3.1. Financial Services
8.3.2. Education
8.3.3. Government
8.3.4. Healthcare
8.3.5. Retail
8.3.6. Other
8.4. Y-o-Y Growth Trend Analysis By Verticals, 2018-2022
8.5. Absolute $ Opportunity Analysis By Verticals, 2023-2033
9. Global Market Analysis 2018-2022 and Forecast 2023-2033, By Region
9.1. Introduction
9.2. Historical Market Size Value (US$ Mn) Analysis By Region, 2018-2022
9.3. Current Market Size Value (US$ Mn) Analysis and Forecast By Region, 2023-2033
9.3.1. North America
9.3.2. Latin America
9.3.3. Europe
9.3.4. South Asia
9.3.5. East Asia
9.3.6. Oceania
9.3.7. MEA
9.4. Market Attractiveness Analysis By Region
10. North America Market Analysis 2018-2022 and Forecast 2023-2033, By Country
10.1. Historical Market Size Value (US$ Mn) Trend Analysis By Market Taxonomy, 2018-2022
10.2. Market Size Value (US$ Mn) Forecast By Market Taxonomy, 2023-2033
10.2.1. By Country
10.2.1.1. U.S.
10.2.1.2. Canada
10.2.2. By Deployment
10.2.3. By Component
10.2.4. By Industry Size
10.2.5. By Verticals
10.3. Market Attractiveness Analysis
10.3.1. By Country
10.3.2. By Deployment
10.3.3. By Component
10.3.4. By Industry Size
10.3.5. By Verticals
10.4. Key Takeaways
11. Latin America Market Analysis 2018-2022 and Forecast 2023-2033, By Country
11.1. Historical Market Size Value (US$ Mn) Trend Analysis By Market Taxonomy, 2018-2022
11.2. Market Size Value (US$ Mn) Forecast By Market Taxonomy, 2023-2033
11.2.1. By Country
11.2.1.1. Brazil
11.2.1.2. Mexico
11.2.1.3. Rest of Latin America
11.2.2. By Deployment
11.2.3. By Component
11.2.4. By Industry Size
11.2.5. By Verticals
11.3. Market Attractiveness Analysis
11.3.1. By Country
11.3.2. By Deployment
11.3.3. By Component
11.3.4. By Industry Size
11.3.5. By Verticals
11.4. Key Takeaways
12. Europe Market Analysis 2018-2022 and Forecast 2023-2033, By Country
12.1. Historical Market Size Value (US$ Mn) Trend Analysis By Market Taxonomy, 2018-2022
12.2. Market Size Value (US$ Mn) Forecast By Market Taxonomy, 2023-2033
12.2.1. By Country
12.2.1.1. Germany
12.2.1.2. U.K.
12.2.1.3. France
12.2.1.4. Spain
12.2.1.5. Italy
12.2.1.6. Rest of Europe
12.2.2. By Deployment
12.2.3. By Component
12.2.4. By Industry Size
12.2.5. By Verticals
12.3. Market Attractiveness Analysis
12.3.1. By Country
12.3.2. By Deployment
12.3.3. By Component
12.3.4. By Industry Size
12.3.5. By Verticals
12.4. Key Takeaways
13. South Asia Market Analysis 2018-2022 and Forecast 2023-2033, By Country
13.1. Historical Market Size Value (US$ Mn) Trend Analysis By Market Taxonomy, 2018-2022
13.2. Market Size Value (US$ Mn) Forecast By Market Taxonomy, 2023-2033
13.2.1. By Country
13.2.1.1. India
13.2.1.2. Malaysia
13.2.1.3. Singapore
13.2.1.4. Thailand
13.2.1.5. Rest of South Asia
13.2.2. By Deployment
13.2.3. By Component
13.2.4. By Industry Size
13.2.5. By Verticals
13.3. Market Attractiveness Analysis
13.3.1. By Country
13.3.2. By Deployment
13.3.3. By Component
13.3.4. By Industry Size
13.3.5. By Verticals
13.4. Key Takeaways
14. East Asia Market Analysis 2018-2022 and Forecast 2023-2033, By Country
14.1. Historical Market Size Value (US$ Mn) Trend Analysis By Market Taxonomy, 2018-2022
14.2. Market Size Value (US$ Mn) Forecast By Market Taxonomy, 2023-2033
14.2.1. By Country
14.2.1.1. China
14.2.1.2. Japan
14.2.1.3. South Korea
14.2.2. By Deployment
14.2.3. By Component
14.2.4. By Industry Size
14.2.5. By Verticals
14.3. Market Attractiveness Analysis
14.3.1. By Country
14.3.2. By Deployment
14.3.3. By Component
14.3.4. By Industry Size
14.3.5. By Verticals
14.4. Key Takeaways
15. Oceania Market Analysis 2018-2022 and Forecast 2023-2033, By Country
15.1. Historical Market Size Value (US$ Mn) Trend Analysis By Market Taxonomy, 2018-2022
15.2. Market Size Value (US$ Mn) Forecast By Market Taxonomy, 2023-2033
15.2.1. By Country
15.2.1.1. Australia
15.2.1.2. New Zealand
15.2.2. By Deployment
15.2.3. By Component
15.2.4. By Industry Size
15.2.5. By Verticals
15.3. Market Attractiveness Analysis
15.3.1. By Country
15.3.2. By Deployment
15.3.3. By Component
15.3.4. By Industry Size
15.3.5. By Verticals
15.4. Key Takeaways
16. MEA Market Analysis 2018-2022 and Forecast 2023-2033, By Country
16.1. Historical Market Size Value (US$ Mn) Trend Analysis By Market Taxonomy, 2018-2022
16.2. Market Size Value (US$ Mn) Forecast By Market Taxonomy, 2023-2033
16.2.1. By Country
16.2.1.1. GCC Countries
16.2.1.2. South Africa
16.2.1.3. Israel
16.2.1.4. Rest of MEA
16.2.2. By Deployment
16.2.3. By Component
16.2.4. By Industry Size
16.2.5. By Verticals
16.3. Market Attractiveness Analysis
16.3.1. By Country
16.3.2. By Deployment
16.3.3. By Component
16.3.4. By Industry Size
16.3.5. By Verticals
16.4. Key Takeaways
17. Key Countries Market Analysis
17.1. U.S.
17.1.1. Pricing Analysis
17.1.2. Market Share Analysis, 2021
17.1.2.1. By Deployment
17.1.2.2. By Component
17.1.2.3. By Industry Size
17.1.2.4. By Verticals
17.2. Canada
17.2.1. Pricing Analysis
17.2.2. Market Share Analysis, 2021
17.2.2.1. By Deployment
17.2.2.2. By Component
17.2.2.3. By Industry Size
17.2.2.4. By Verticals
17.3. Brazil
17.3.1. Pricing Analysis
17.3.2. Market Share Analysis, 2021
17.3.2.1. By Deployment
17.3.2.2. By Component
17.3.2.3. By Industry Size
17.3.2.4. By Verticals
17.4. Mexico
17.4.1. Pricing Analysis
17.4.2. Market Share Analysis, 2021
17.4.2.1. By Deployment
17.4.2.2. By Component
17.4.2.3. By Industry Size
17.4.2.4. By Verticals
17.5. Germany
17.5.1. Pricing Analysis
17.5.2. Market Share Analysis, 2021
17.5.2.1. By Deployment
17.5.2.2. By Component
17.5.2.3. By Industry Size
17.5.2.4. By Verticals
17.6. U.K.
17.6.1. Pricing Analysis
17.6.2. Market Share Analysis, 2021
17.6.2.1. By Deployment
17.6.2.2. By Component
17.6.2.3. By Industry Size
17.6.2.4. By Verticals
17.7. France
17.7.1. Pricing Analysis
17.7.2. Market Share Analysis, 2021
17.7.2.1. By Deployment
17.7.2.2. By Component
17.7.2.3. By Industry Size
17.7.2.4. By Verticals
17.8. Spain
17.8.1. Pricing Analysis
17.8.2. Market Share Analysis, 2021
17.8.2.1. By Deployment
17.8.2.2. By Component
17.8.2.3. By Industry Size
17.8.2.4. By Verticals
17.9. Italy
17.9.1. Pricing Analysis
17.9.2. Market Share Analysis, 2021
17.9.2.1. By Deployment
17.9.2.2. By Component
17.9.2.3. By Industry Size
17.9.2.4. By Verticals
17.10. India
17.10.1. Pricing Analysis
17.10.2. Market Share Analysis, 2021
17.10.2.1. By Deployment
17.10.2.2. By Component
17.10.2.3. By Industry Size
17.10.2.4. By Verticals
17.11. Malaysia
17.11.1. Pricing Analysis
17.11.2. Market Share Analysis, 2021
17.11.2.1. By Deployment
17.11.2.2. By Component
17.11.2.3. By Industry Size
17.11.2.4. By Verticals
17.12. Singapore
17.12.1. Pricing Analysis
17.12.2. Market Share Analysis, 2021
17.12.2.1. By Deployment
17.12.2.2. By Component
17.12.2.3. By Industry Size
17.12.2.4. By Verticals
17.13. Thailand
17.13.1. Pricing Analysis
17.13.2. Market Share Analysis, 2021
17.13.2.1. By Deployment
17.13.2.2. By Component
17.13.2.3. By Industry Size
17.13.2.4. By Verticals
17.14. China
17.14.1. Pricing Analysis
17.14.2. Market Share Analysis, 2021
17.14.2.1. By Deployment
17.14.2.2. By Component
17.14.2.3. By Industry Size
17.14.2.4. By Verticals
17.15. Japan
17.15.1. Pricing Analysis
17.15.2. Market Share Analysis, 2021
17.15.2.1. By Deployment
17.15.2.2. By Component
17.15.2.3. By Industry Size
17.15.2.4. By Verticals
17.16. South Korea
17.16.1. Pricing Analysis
17.16.2. Market Share Analysis, 2021
17.16.2.1. By Deployment
17.16.2.2. By Component
17.16.2.3. By Industry Size
17.16.2.4. By Verticals
17.17. Australia
17.17.1. Pricing Analysis
17.17.2. Market Share Analysis, 2021
17.17.2.1. By Deployment
17.17.2.2. By Component
17.17.2.3. By Industry Size
17.17.2.4. By Verticals
17.18. New Zealand
17.18.1. Pricing Analysis
17.18.2. Market Share Analysis, 2021
17.18.2.1. By Deployment
17.18.2.2. By Component
17.18.2.3. By Industry Size
17.18.2.4. By Verticals
17.19. GCC Countries
17.19.1. Pricing Analysis
17.19.2. Market Share Analysis, 2021
17.19.2.1. By Deployment
17.19.2.2. By Component
17.19.2.3. By Industry Size
17.19.2.4. By Verticals
17.20. South Africa
17.20.1. Pricing Analysis
17.20.2. Market Share Analysis, 2021
17.20.2.1. By Deployment
17.20.2.2. By Component
17.20.2.3. By Industry Size
17.20.2.4. By Verticals
17.21. Israel
17.21.1. Pricing Analysis
17.21.2. Market Share Analysis, 2021
17.21.2.1. By Deployment
17.21.2.2. By Component
17.21.2.3. By Industry Size
17.21.2.4. By Verticals
18. Market Structure Analysis
18.1. Competition Dashboard
18.2. Competition Benchmarking
18.3. Market Share Analysis of Top Players
18.3.1. By Regional
18.3.2. By Deployment
18.3.3. By Component
18.3.4. By Industry Size
18.3.5. By Verticals
19. Competition Analysis
19.1. Competition Deep Dive
19.1.1. AAA Allied Groups
19.1.1.1. Overview
19.1.1.2. Product Portfolio
19.1.1.3. Profitability by Market Segments
19.1.1.4. Sales Footprint
19.1.1.5. Strategy Overview
19.1.1.5.1. Marketing Strategy
19.1.2. Aarons
19.1.2.1. Overview
19.1.2.2. Product Portfolio
19.1.2.3. Profitability by Market Segments
19.1.2.4. Sales Footprint
19.1.2.5. Strategy Overview
19.1.2.5.1. Marketing Strategy
19.1.3. Adidas
19.1.3.1. Overview
19.1.3.2. Product Portfolio
19.1.3.3. Profitability by Market Segments
19.1.3.4. Sales Footprint
19.1.3.5. Strategy Overview
19.1.3.5.1. Marketing Strategy
19.1.4. Banqsoft
19.1.4.1. Overview
19.1.4.2. Product Portfolio
19.1.4.3. Profitability by Market Segments
19.1.4.4. Sales Footprint
19.1.4.5. Strategy Overview
19.1.4.5.1. Marketing Strategy
19.1.5. Becton Dickinson
19.1.5.1. Overview
19.1.5.2. Product Portfolio
19.1.5.3. Profitability by Market Segments
19.1.5.4. Sales Footprint
19.1.5.5. Strategy Overview
19.1.5.5.1. Marketing Strategy
19.1.6. BitHawk
19.1.6.1. Overview
19.1.6.2. Product Portfolio
19.1.6.3. Profitability by Market Segments
19.1.6.4. Sales Footprint
19.1.6.5. Strategy Overview
19.1.6.5.1. Marketing Strategy
19.1.7. Deloitte
19.1.7.1. Overview
19.1.7.2. Product Portfolio
19.1.7.3. Profitability by Market Segments
19.1.7.4. Sales Footprint
19.1.7.5. Strategy Overview
19.1.7.5.1. Marketing Strategy
19.1.8. zoom
19.1.8.1. Overview
19.1.8.2. Product Portfolio
19.1.8.3. Profitability by Market Segments
19.1.8.4. Sales Footprint
19.1.8.5. Strategy Overview
19.1.8.5.1. Marketing Strategy
19.1.9. Bayers
19.1.9.1. Overview
19.1.9.2. Product Portfolio
19.1.9.3. Profitability by Market Segments
19.1.9.4. Sales Footprint
19.1.9.5. Strategy Overview
19.1.9.5.1. Marketing Strategy
19.1.10. Richo
19.1.10.1. Overview
19.1.10.2. Product Portfolio
19.1.10.3. Profitability by Market Segments
19.1.10.4. Sales Footprint
19.1.10.5. Strategy Overview
19.1.10.5.1. Marketing Strategy
20. Assumptions & Acronyms Used
21. Research Methodology
Let us know your requirement to get
100% FREE customization
List of Tables
Table 1: Global Market Value (US$ Mn) Forecast by Region, 2018-2033
Table 2: Global Market Value (US$ Mn) Forecast by Deployment, 2018-2033
Table 3: Global Market Value (US$ Mn) Forecast by Component, 2018-2033
Table 4: Global Market Value (US$ Mn) Forecast by Industry Size , 2018-2033
Table 5: Global Market Value (US$ Mn) Forecast by Verticals, 2018-2033
Table 6: North America Market Value (US$ Mn) Forecast by Country, 2018-2033
Table 7: North America Market Value (US$ Mn) Forecast by Deployment, 2018-2033
Table 8: North America Market Value (US$ Mn) Forecast by Component, 2018-2033
Table 9: North America Market Value (US$ Mn) Forecast by Industry Size , 2018-2033
Table 10: North America Market Value (US$ Mn) Forecast by Verticals, 2018-2033
Table 11: Latin America Market Value (US$ Mn) Forecast by Country, 2018-2033
Table 12: Latin America Market Value (US$ Mn) Forecast by Deployment, 2018-2033
Table 13: Latin America Market Value (US$ Mn) Forecast by Component, 2018-2033
Table 14: Latin America Market Value (US$ Mn) Forecast by Industry Size , 2018-2033
Table 15: Latin America Market Value (US$ Mn) Forecast by Verticals, 2018-2033
Table 16: Europe Market Value (US$ Mn) Forecast by Country, 2018-2033
Table 17: Europe Market Value (US$ Mn) Forecast by Deployment, 2018-2033
Table 18: Europe Market Value (US$ Mn) Forecast by Component, 2018-2033
Table 19: Europe Market Value (US$ Mn) Forecast by Industry Size , 2018-2033
Table 20: Europe Market Value (US$ Mn) Forecast by Verticals, 2018-2033
Table 21: South Asia Market Value (US$ Mn) Forecast by Country, 2018-2033
Table 22: South Asia Market Value (US$ Mn) Forecast by Deployment, 2018-2033
Table 23: South Asia Market Value (US$ Mn) Forecast by Component, 2018-2033
Table 24: South Asia Market Value (US$ Mn) Forecast by Industry Size , 2018-2033
Table 25: South Asia Market Value (US$ Mn) Forecast by Verticals, 2018-2033
Table 26: East Asia Market Value (US$ Mn) Forecast by Country, 2018-2033
Table 27: East Asia Market Value (US$ Mn) Forecast by Deployment, 2018-2033
Table 28: East Asia Market Value (US$ Mn) Forecast by Component, 2018-2033
Table 29: East Asia Market Value (US$ Mn) Forecast by Industry Size , 2018-2033
Table 30: East Asia Market Value (US$ Mn) Forecast by Verticals, 2018-2033
Table 31: Oceania Market Value (US$ Mn) Forecast by Country, 2018-2033
Table 32: Oceania Market Value (US$ Mn) Forecast by Deployment, 2018-2033
Table 33: Oceania Market Value (US$ Mn) Forecast by Component, 2018-2033
Table 34: Oceania Market Value (US$ Mn) Forecast by Industry Size , 2018-2033
Table 35: Oceania Market Value (US$ Mn) Forecast by Verticals, 2018-2033
Table 36: MEA Market Value (US$ Mn) Forecast by Country, 2018-2033
Table 37: MEA Market Value (US$ Mn) Forecast by Deployment, 2018-2033
Table 38: MEA Market Value (US$ Mn) Forecast by Component, 2018-2033
Table 39: MEA Market Value (US$ Mn) Forecast by Industry Size , 2018-2033
Table 40: MEA Market Value (US$ Mn) Forecast by Verticals, 2018-2033
Find your sweet spots for generating winning opportunities in this market.
Talk to AnalystList of Charts
Figure 1: Global Market Value (US$ Mn) by Deployment, 2023-2033
Figure 2: Global Market Value (US$ Mn) by Component, 2023-2033
Figure 3: Global Market Value (US$ Mn) by Industry Size , 2023-2033
Figure 4: Global Market Value (US$ Mn) by Verticals, 2023-2033
Figure 5: Global Market Value (US$ Mn) by Region, 2023-2033
Figure 6: Global Market Value (US$ Mn) Analysis by Region, 2018-2033
Figure 7: Global Market Value Share (%) and BPS Analysis by Region, 2023-2033
Figure 8: Global Market Y-o-Y Growth (%) Projections by Region, 2023-2033
Figure 9: Global Market Value (US$ Mn) Analysis by Deployment, 2018-2033
Figure 10: Global Market Value Share (%) and BPS Analysis by Deployment, 2023-2033
Figure 11: Global Market Y-o-Y Growth (%) Projections by Deployment, 2023-2033
Figure 12: Global Market Value (US$ Mn) Analysis by Component, 2018-2033
Figure 13: Global Market Value Share (%) and BPS Analysis by Component, 2023-2033
Figure 14: Global Market Y-o-Y Growth (%) Projections by Component, 2023-2033
Figure 15: Global Market Value (US$ Mn) Analysis by Industry Size , 2018-2033
Figure 16: Global Market Value Share (%) and BPS Analysis by Industry Size , 2023-2033
Figure 17: Global Market Y-o-Y Growth (%) Projections by Industry Size , 2023-2033
Figure 18: Global Market Value (US$ Mn) Analysis by Verticals, 2018-2033
Figure 19: Global Market Value Share (%) and BPS Analysis by Verticals, 2023-2033
Figure 20: Global Market Y-o-Y Growth (%) Projections by Verticals, 2023-2033
Figure 21: Global Market Attractiveness by Deployment, 2023-2033
Figure 22: Global Market Attractiveness by Component, 2023-2033
Figure 23: Global Market Attractiveness by Industry Size , 2023-2033
Figure 24: Global Market Attractiveness by Verticals, 2023-2033
Figure 25: Global Market Attractiveness by Region, 2023-2033
Figure 26: North America Market Value (US$ Mn) by Deployment, 2023-2033
Figure 27: North America Market Value (US$ Mn) by Component, 2023-2033
Figure 28: North America Market Value (US$ Mn) by Industry Size , 2023-2033
Figure 29: North America Market Value (US$ Mn) by Verticals, 2023-2033
Figure 30: North America Market Value (US$ Mn) by Country, 2023-2033
Figure 31: North America Market Value (US$ Mn) Analysis by Country, 2018-2033
Figure 32: North America Market Value Share (%) and BPS Analysis by Country, 2023-2033
Figure 33: North America Market Y-o-Y Growth (%) Projections by Country, 2023-2033
Figure 34: North America Market Value (US$ Mn) Analysis by Deployment, 2018-2033
Figure 35: North America Market Value Share (%) and BPS Analysis by Deployment, 2023-2033
Figure 36: North America Market Y-o-Y Growth (%) Projections by Deployment, 2023-2033
Figure 37: North America Market Value (US$ Mn) Analysis by Component, 2018-2033
Figure 38: North America Market Value Share (%) and BPS Analysis by Component, 2023-2033
Figure 39: North America Market Y-o-Y Growth (%) Projections by Component, 2023-2033
Figure 40: North America Market Value (US$ Mn) Analysis by Industry Size , 2018-2033
Figure 41: North America Market Value Share (%) and BPS Analysis by Industry Size , 2023-2033
Figure 42: North America Market Y-o-Y Growth (%) Projections by Industry Size , 2023-2033
Figure 43: North America Market Value (US$ Mn) Analysis by Verticals, 2018-2033
Figure 44: North America Market Value Share (%) and BPS Analysis by Verticals, 2023-2033
Figure 45: North America Market Y-o-Y Growth (%) Projections by Verticals, 2023-2033
Figure 46: North America Market Attractiveness by Deployment, 2023-2033
Figure 47: North America Market Attractiveness by Component, 2023-2033
Figure 48: North America Market Attractiveness by Industry Size , 2023-2033
Figure 49: North America Market Attractiveness by Verticals, 2023-2033
Figure 50: North America Market Attractiveness by Country, 2023-2033
Figure 51: Latin America Market Value (US$ Mn) by Deployment, 2023-2033
Figure 52: Latin America Market Value (US$ Mn) by Component, 2023-2033
Figure 53: Latin America Market Value (US$ Mn) by Industry Size , 2023-2033
Figure 54: Latin America Market Value (US$ Mn) by Verticals, 2023-2033
Figure 55: Latin America Market Value (US$ Mn) by Country, 2023-2033
Figure 56: Latin America Market Value (US$ Mn) Analysis by Country, 2018-2033
Figure 57: Latin America Market Value Share (%) and BPS Analysis by Country, 2023-2033
Figure 58: Latin America Market Y-o-Y Growth (%) Projections by Country, 2023-2033
Figure 59: Latin America Market Value (US$ Mn) Analysis by Deployment, 2018-2033
Figure 60: Latin America Market Value Share (%) and BPS Analysis by Deployment, 2023-2033
Figure 61: Latin America Market Y-o-Y Growth (%) Projections by Deployment, 2023-2033
Figure 62: Latin America Market Value (US$ Mn) Analysis by Component, 2018-2033
Figure 63: Latin America Market Value Share (%) and BPS Analysis by Component, 2023-2033
Figure 64: Latin America Market Y-o-Y Growth (%) Projections by Component, 2023-2033
Figure 65: Latin America Market Value (US$ Mn) Analysis by Industry Size , 2018-2033
Figure 66: Latin America Market Value Share (%) and BPS Analysis by Industry Size , 2023-2033
Figure 67: Latin America Market Y-o-Y Growth (%) Projections by Industry Size , 2023-2033
Figure 68: Latin America Market Value (US$ Mn) Analysis by Verticals, 2018-2033
Figure 69: Latin America Market Value Share (%) and BPS Analysis by Verticals, 2023-2033
Figure 70: Latin America Market Y-o-Y Growth (%) Projections by Verticals, 2023-2033
Figure 71: Latin America Market Attractiveness by Deployment, 2023-2033
Figure 72: Latin America Market Attractiveness by Component, 2023-2033
Figure 73: Latin America Market Attractiveness by Industry Size , 2023-2033
Figure 74: Latin America Market Attractiveness by Verticals, 2023-2033
Figure 75: Latin America Market Attractiveness by Country, 2023-2033
Figure 76: Europe Market Value (US$ Mn) by Deployment, 2023-2033
Figure 77: Europe Market Value (US$ Mn) by Component, 2023-2033
Figure 78: Europe Market Value (US$ Mn) by Industry Size , 2023-2033
Figure 79: Europe Market Value (US$ Mn) by Verticals, 2023-2033
Figure 80: Europe Market Value (US$ Mn) by Country, 2023-2033
Figure 81: Europe Market Value (US$ Mn) Analysis by Country, 2018-2033
Figure 82: Europe Market Value Share (%) and BPS Analysis by Country, 2023-2033
Figure 83: Europe Market Y-o-Y Growth (%) Projections by Country, 2023-2033
Figure 84: Europe Market Value (US$ Mn) Analysis by Deployment, 2018-2033
Figure 85: Europe Market Value Share (%) and BPS Analysis by Deployment, 2023-2033
Figure 86: Europe Market Y-o-Y Growth (%) Projections by Deployment, 2023-2033
Figure 87: Europe Market Value (US$ Mn) Analysis by Component, 2018-2033
Figure 88: Europe Market Value Share (%) and BPS Analysis by Component, 2023-2033
Figure 89: Europe Market Y-o-Y Growth (%) Projections by Component, 2023-2033
Figure 90: Europe Market Value (US$ Mn) Analysis by Industry Size , 2018-2033
Figure 91: Europe Market Value Share (%) and BPS Analysis by Industry Size , 2023-2033
Figure 92: Europe Market Y-o-Y Growth (%) Projections by Industry Size , 2023-2033
Figure 93: Europe Market Value (US$ Mn) Analysis by Verticals, 2018-2033
Figure 94: Europe Market Value Share (%) and BPS Analysis by Verticals, 2023-2033
Figure 95: Europe Market Y-o-Y Growth (%) Projections by Verticals, 2023-2033
Figure 96: Europe Market Attractiveness by Deployment, 2023-2033
Figure 97: Europe Market Attractiveness by Component, 2023-2033
Figure 98: Europe Market Attractiveness by Industry Size , 2023-2033
Figure 99: Europe Market Attractiveness by Verticals, 2023-2033
Figure 100: Europe Market Attractiveness by Country, 2023-2033
Figure 101: South Asia Market Value (US$ Mn) by Deployment, 2023-2033
Figure 102: South Asia Market Value (US$ Mn) by Component, 2023-2033
Figure 103: South Asia Market Value (US$ Mn) by Industry Size , 2023-2033
Figure 104: South Asia Market Value (US$ Mn) by Verticals, 2023-2033
Figure 105: South Asia Market Value (US$ Mn) by Country, 2023-2033
Figure 106: South Asia Market Value (US$ Mn) Analysis by Country, 2018-2033
Figure 107: South Asia Market Value Share (%) and BPS Analysis by Country, 2023-2033
Figure 108: South Asia Market Y-o-Y Growth (%) Projections by Country, 2023-2033
Figure 109: South Asia Market Value (US$ Mn) Analysis by Deployment, 2018-2033
Figure 110: South Asia Market Value Share (%) and BPS Analysis by Deployment, 2023-2033
Figure 111: South Asia Market Y-o-Y Growth (%) Projections by Deployment, 2023-2033
Figure 112: South Asia Market Value (US$ Mn) Analysis by Component, 2018-2033
Figure 113: South Asia Market Value Share (%) and BPS Analysis by Component, 2023-2033
Figure 114: South Asia Market Y-o-Y Growth (%) Projections by Component, 2023-2033
Figure 115: South Asia Market Value (US$ Mn) Analysis by Industry Size , 2018-2033
Figure 116: South Asia Market Value Share (%) and BPS Analysis by Industry Size , 2023-2033
Figure 117: South Asia Market Y-o-Y Growth (%) Projections by Industry Size , 2023-2033
Figure 118: South Asia Market Value (US$ Mn) Analysis by Verticals, 2018-2033
Figure 119: South Asia Market Value Share (%) and BPS Analysis by Verticals, 2023-2033
Figure 120: South Asia Market Y-o-Y Growth (%) Projections by Verticals, 2023-2033
Figure 121: South Asia Market Attractiveness by Deployment, 2023-2033
Figure 122: South Asia Market Attractiveness by Component, 2023-2033
Figure 123: South Asia Market Attractiveness by Industry Size , 2023-2033
Figure 124: South Asia Market Attractiveness by Verticals, 2023-2033
Figure 125: South Asia Market Attractiveness by Country, 2023-2033
Figure 126: East Asia Market Value (US$ Mn) by Deployment, 2023-2033
Figure 127: East Asia Market Value (US$ Mn) by Component, 2023-2033
Figure 128: East Asia Market Value (US$ Mn) by Industry Size , 2023-2033
Figure 129: East Asia Market Value (US$ Mn) by Verticals, 2023-2033
Figure 130: East Asia Market Value (US$ Mn) by Country, 2023-2033
Figure 131: East Asia Market Value (US$ Mn) Analysis by Country, 2018-2033
Figure 132: East Asia Market Value Share (%) and BPS Analysis by Country, 2023-2033
Figure 133: East Asia Market Y-o-Y Growth (%) Projections by Country, 2023-2033
Figure 134: East Asia Market Value (US$ Mn) Analysis by Deployment, 2018-2033
Figure 135: East Asia Market Value Share (%) and BPS Analysis by Deployment, 2023-2033
Figure 136: East Asia Market Y-o-Y Growth (%) Projections by Deployment, 2023-2033
Figure 137: East Asia Market Value (US$ Mn) Analysis by Component, 2018-2033
Figure 138: East Asia Market Value Share (%) and BPS Analysis by Component, 2023-2033
Figure 139: East Asia Market Y-o-Y Growth (%) Projections by Component, 2023-2033
Figure 140: East Asia Market Value (US$ Mn) Analysis by Industry Size , 2018-2033
Figure 141: East Asia Market Value Share (%) and BPS Analysis by Industry Size , 2023-2033
Figure 142: East Asia Market Y-o-Y Growth (%) Projections by Industry Size , 2023-2033
Figure 143: East Asia Market Value (US$ Mn) Analysis by Verticals, 2018-2033
Figure 144: East Asia Market Value Share (%) and BPS Analysis by Verticals, 2023-2033
Figure 145: East Asia Market Y-o-Y Growth (%) Projections by Verticals, 2023-2033
Figure 146: East Asia Market Attractiveness by Deployment, 2023-2033
Figure 147: East Asia Market Attractiveness by Component, 2023-2033
Figure 148: East Asia Market Attractiveness by Industry Size , 2023-2033
Figure 149: East Asia Market Attractiveness by Verticals, 2023-2033
Figure 150: East Asia Market Attractiveness by Country, 2023-2033
Figure 151: Oceania Market Value (US$ Mn) by Deployment, 2023-2033
Figure 152: Oceania Market Value (US$ Mn) by Component, 2023-2033
Figure 153: Oceania Market Value (US$ Mn) by Industry Size , 2023-2033
Figure 154: Oceania Market Value (US$ Mn) by Verticals, 2023-2033
Figure 155: Oceania Market Value (US$ Mn) by Country, 2023-2033
Figure 156: Oceania Market Value (US$ Mn) Analysis by Country, 2018-2033
Figure 157: Oceania Market Value Share (%) and BPS Analysis by Country, 2023-2033
Figure 158: Oceania Market Y-o-Y Growth (%) Projections by Country, 2023-2033
Figure 159: Oceania Market Value (US$ Mn) Analysis by Deployment, 2018-2033
Figure 160: Oceania Market Value Share (%) and BPS Analysis by Deployment, 2023-2033
Figure 161: Oceania Market Y-o-Y Growth (%) Projections by Deployment, 2023-2033
Figure 162: Oceania Market Value (US$ Mn) Analysis by Component, 2018-2033
Figure 163: Oceania Market Value Share (%) and BPS Analysis by Component, 2023-2033
Figure 164: Oceania Market Y-o-Y Growth (%) Projections by Component, 2023-2033
Figure 165: Oceania Market Value (US$ Mn) Analysis by Industry Size , 2018-2033
Figure 166: Oceania Market Value Share (%) and BPS Analysis by Industry Size , 2023-2033
Figure 167: Oceania Market Y-o-Y Growth (%) Projections by Industry Size , 2023-2033
Figure 168: Oceania Market Value (US$ Mn) Analysis by Verticals, 2018-2033
Figure 169: Oceania Market Value Share (%) and BPS Analysis by Verticals, 2023-2033
Figure 170: Oceania Market Y-o-Y Growth (%) Projections by Verticals, 2023-2033
Figure 171: Oceania Market Attractiveness by Deployment, 2023-2033
Figure 172: Oceania Market Attractiveness by Component, 2023-2033
Figure 173: Oceania Market Attractiveness by Industry Size , 2023-2033
Figure 174: Oceania Market Attractiveness by Verticals, 2023-2033
Figure 175: Oceania Market Attractiveness by Country, 2023-2033
Figure 176: MEA Market Value (US$ Mn) by Deployment, 2023-2033
Figure 177: MEA Market Value (US$ Mn) by Component, 2023-2033
Figure 178: MEA Market Value (US$ Mn) by Industry Size , 2023-2033
Figure 179: MEA Market Value (US$ Mn) by Verticals, 2023-2033
Figure 180: MEA Market Value (US$ Mn) by Country, 2023-2033
Figure 181: MEA Market Value (US$ Mn) Analysis by Country, 2018-2033
Figure 182: MEA Market Value Share (%) and BPS Analysis by Country, 2023-2033
Figure 183: MEA Market Y-o-Y Growth (%) Projections by Country, 2023-2033
Figure 184: MEA Market Value (US$ Mn) Analysis by Deployment, 2018-2033
Figure 185: MEA Market Value Share (%) and BPS Analysis by Deployment, 2023-2033
Figure 186: MEA Market Y-o-Y Growth (%) Projections by Deployment, 2023-2033
Figure 187: MEA Market Value (US$ Mn) Analysis by Component, 2018-2033
Figure 188: MEA Market Value Share (%) and BPS Analysis by Component, 2023-2033
Figure 189: MEA Market Y-o-Y Growth (%) Projections by Component, 2023-2033
Figure 190: MEA Market Value (US$ Mn) Analysis by Industry Size , 2018-2033
Figure 191: MEA Market Value Share (%) and BPS Analysis by Industry Size , 2023-2033
Figure 192: MEA Market Y-o-Y Growth (%) Projections by Industry Size , 2023-2033
Figure 193: MEA Market Value (US$ Mn) Analysis by Verticals, 2018-2033
Figure 194: MEA Market Value Share (%) and BPS Analysis by Verticals, 2023-2033
Figure 195: MEA Market Y-o-Y Growth (%) Projections by Verticals, 2023-2033
Figure 196: MEA Market Attractiveness by Deployment, 2023-2033
Figure 197: MEA Market Attractiveness by Component, 2023-2033
Figure 198: MEA Market Attractiveness by Industry Size , 2023-2033
Figure 199: MEA Market Attractiveness by Verticals, 2023-2033
Figure 200: MEA Market Attractiveness by Country, 2023-2033
Need specific information?
Request CustomizationExplore Technology Insights
View Reports