Technical Films Market Outlook from 2025 to 2035

Technical films are widely used across diversified sectors such as packaging, electronics, automotive and construction, etc. These are high-performance materials that provide enhanced mechanical, thermal and chemical properties tailored to specialized applications. The growing demand for advanced packaging solutions, protective coatings and energy-efficient materials are expected to drive industry growth in the upcoming decade.

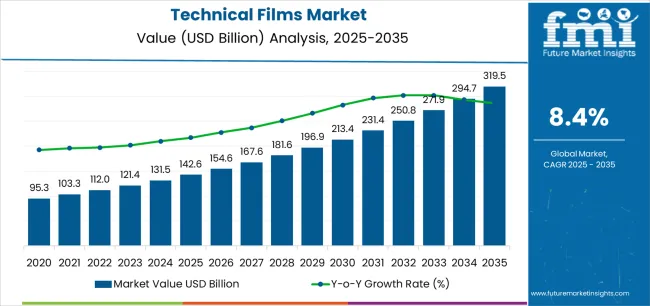
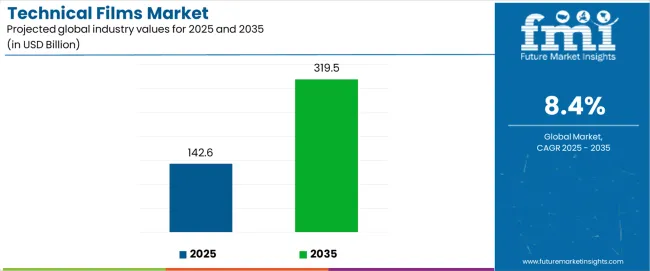
The technical film industry size is anticipated to grow up to an estimated value of USD 42.69 billion by 2025 and is further anticipated to progress at a CAGR of 5.3% during 2025 and reach USD 71.55 billion by 2035. The growth is driven by rising technological developments, growing industrial use, and standardization policies fostering sustainable and high-performance materials. Moreover, the R&D activities in biodegradable and recyclable technical films are expanding the sustainability of the industry.

Technical Films Market

The development of the sector is driven by the growth of smart electronics and electronic vehicles, with technical films possessing a crucial role in component protection and performance enhancement. The technological growth in the film-making technology, including multi-layered and nano-engineered films, which are expected to enhance the efficiency of technical films.

Segment-wise Analysis

By Films Type

Technological films will continue to evolve during the forecast period of 2025 to 2035 due to their surging demand across various industries. Stretch films are a key factor for the flexible packaging industry in both the logistics and retail sectors due to their high flexibility and load stability.

With the growing demand for effective product packaging solutions, shrink films will have increased usage in various segments, particularly in food packaging and product bundling, as these end-use segments are used for their need for strong product protection and aesthetic appeal.

In food packaging, specifically, barrier films will see improvements, such as the more efficient configurations of multi-layer constructions offering optimum protection against moisture, oxygen, and UV light. In the field of electronics, conductive films will be important and will enable flexible and wearable devices.

In automotive and construction sectors, safety & security films will gain ground due to increased concern regarding vandalism and security. In addition, in automotive and medical applications, where visibility is of utmost importance, anti-fog films will see increasing demand. Expansion will also occur in other technical films for applications such as smart packaging or medical.

By Material Type

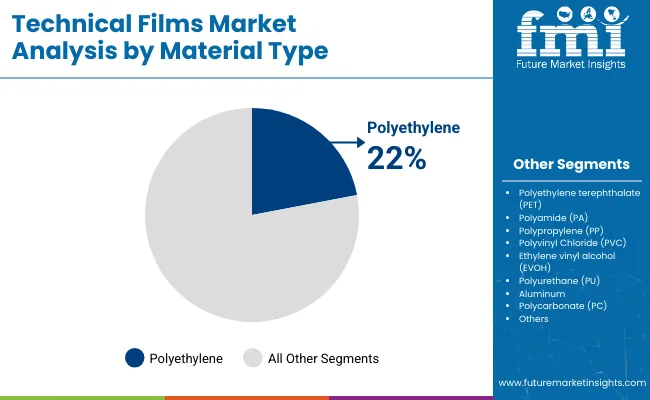
Polyethylene (PE) will remain the leading product in the film industry due to its versatility and cost efficiency, especially for packaging materials. Low-density polyethene (LDPE) and Linear Low-Density Polyethylene (LLDPE) will continue to be widely used for flexible films, providing good tensile strength and elasticity. Polyethylene Terephthalate (PET) will further gain traction, especially in food packaging and the medical sector, due to its high-barrier properties and durability.

Polyamide (PA) films will see increasing use in applications requiring high thermal resistance and strength. It is also applicable to the automotive and aerospace industries. Polypropylene (PP) will remain preferred due to its resistance to chemicals and moisture, making it ideal in the pharmaceutical and chemical industries. PVC are used in applications that require rigidity and chemical resistance, such as construction.

The demand for Ethylene Vinyl Alcohol (EVOH) will increase due to its excellent barrier properties in food packaging applications, whereas polyurethane (PU) films will ensure that their use is growing because of their unique flexibility and durability. Aluminum films (for barrier and safety applications) will continue to play an essential role, and PC will find niche applications in high-impact and optical applications.

By Thickness Type

For lightweight and flexible packaging, especially food and beverage packaging, films with thicknesses of up to 25 microns will dominate. The thin films offer articulate performance along with significant material savings, making them highly suitable for companies focused on sustainability.

Films in the range of 25-50 microns will have very general use, particularly in applications where some extra strength and barrier properties are desired, including, for example, cosmetic and personal care. 50-100 micron films will gain popularity in pharmaceutical and chemical sectors where strength, puncture resistance and protection of the product are of utmost importance.

In the 100-150 microns, films are targeted in automotive and construction applications, where more robust films are required to resist harsher environments. Heavy-duty industries and applications, such as agriculture, building and construction, will require films in more thicknesses-greater than 150 microns-as these films offer better protection against circumstances faced in extreme conditions.

By End-Use Verticals

The food and beverage industry will continue to be a strong driver for technical films due to the growing need for increasing the shelf life of commodities along with protection and convenience via packaging. Packaging will change to meet consumer demand for sustainability and environmental friendliness, with bio-based and recyclable films growing faster.

The growing demand for appealing, functional, and sustainable packaging will lead to a high adoption of technical film in this segment of the personal care and cosmetics industry as well. Packaging will also be more sophisticated than ever before, driving higher demand for chemical-resistant and durable films, among other features in the chemical sector.

Films for protective and insulating applications will continue to be required across the construction and building industries, with a growing demand for energy-efficient solutions. At the same time, from the pharmaceutical sector, the demand for high-performance barrier films that protect sensitive drugs will increase.

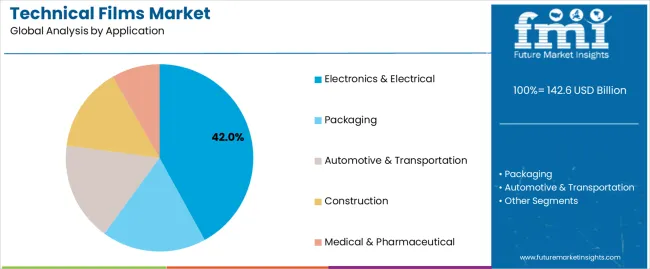
The electrical and electronic industry requires films that protect against moisture, dust, and electromagnetic interference. While, the automotive sector will use technical films more widely for safety, security, and styling purposes. Growing adoption of specialty films would be observed across the other industries, such as textiles and medical devices, as new solutions and applications are developed.

Region-wise Trends

Asia-Pacific

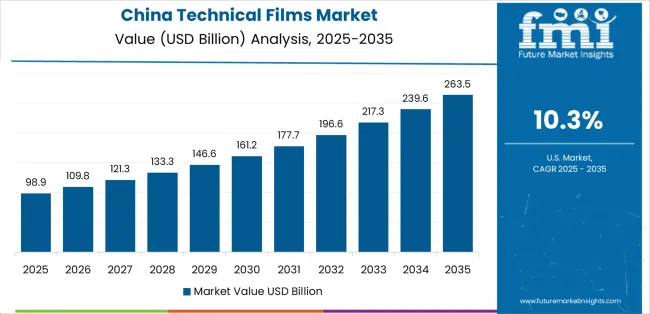
Asia-Pacific will lead the technical films industry, fueled by fast industrialization, growing electronics production, and robust demand for flexible packaging solutions. China, India, and Japan are major contributors, with robust demand for high-performance films in the automotive, electronics, and construction sectors. Moreover, fast urbanization and growing manufacturing capabilities in the region are further fueling industry growth.

The growth in the region is boosted by increasing investment in sustainable film materials and polymer technology innovations. Besides, government initiatives to encourage eco-friendly packaging and energy-efficient solar films will also fuel innovation in the industry. Also, the rising presence of international technical filmmakers in the Asia-Pacific region is enhancing local capacities. Also, high-barrier and biodegradable film research and development are expected to contribute to new sources of growth in the region.

North America

North America is a major industry for technical films due to its high demand in the healthcare, food packaging, and automotive sectors. The United States and Canada are spearheading the region with technological innovation in smart films, protective coatings, and energy-saving materials. Increasing demand for lightweight, high-durability films in automotive and aerospace applications is also driving the industry further.

The use of sophisticated technical films is increasing, driven by government policies and corporate sustainability programs. Growing investments in research and development of high-performance and recyclable film technology are also fueling industry expansion.

The growth in electric vehicle manufacturing and next-generation flexible electronics is also increasing the demand for protective and insulating films. Most of the companies in North America are also focusing on enhancing the recyclability and durability of technical films to increase product performance. Advances in self-healing and antimicrobial films will continue to define the industry in the future years.

Europe

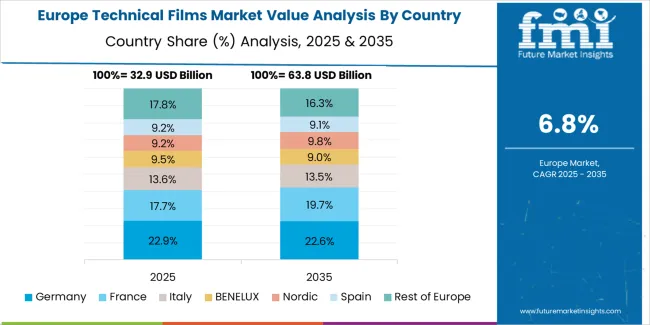
Europe is a major player in the technical films industry, supported by robust regulatory environments that encourage sustainable and high-performance materials. Top economies like Germany, France, and the UK are leaders in polymer engineering and advanced film technologies. The rising investments in circular economy programs and research on bio-based films are further consolidating the region's leadership in the industry.

Stringent green regulations favoring low-carbon, recyclable, and biodegradable packaging material are driving growth towards sustainable technical films.

Increasing consumer knowledge and demand for environment-friendly products also are likely to support long-term industry growth. The region also is seeing growing numbers of collaborations between film manufacturers and industries for creating new high-performance formulations.

In addition, research organizations in Europe are investing in the next-generation technical films with better barrier performance and energy efficiency. These developments are likely to contribute to better efficiency and utilization of technical films across industries.

Key Dynamics

Key Challenges

  • High Production Cost: Technical film manufacturing is more expensive than traditional films, and it directly impacts its pricing and adoption levels.
  • Environmental Concerns: Some traditional technical films still use non-recyclable polymers, which poses sustainability crises

Key Opportunities

  • Development of New Industries: Technical films are often used in renewable energy medical devices, and high-tech electronics, providing new growth and opportunities.
  • Advances in Biodegradable and Recyclable Film Technology: Research in high-performance, environmentally friendly films is expected to drive innovation and enhance product innovations.

Market Shifts: 2020 to 2024 Vs 2025 to 2035

During the period between 2020 and 2024, the technical films industry witnessed a moderate growth due to rising industrial demand, sustainability commitments and increasing applications in smart packaging and flexible electronics. However, there are several challenges such as high production cost, material disposal concerns and key issues for manufacturers.

Additionally, the industry experienced greater investment in research for enhanced film strength, transparency, and recyclability. There were mounting concerns over plastic waste that led regulatory authorities to promote biodegradable alternatives. Also, development in nanotechnology led to enhanced film properties and application efficiency.

In the upcoming decade, the market growth of the technical films industry will be led by innovation in smart films, self-healing coatings and ultra-thin barrier films. The use of AI and automation in the film manufacturing processes will surge the market competition. Further, the rising demand for technical films in high-performance industries like aerospace, EV batteries and wearable electronics will generate new opportunities.

Companies are emphasising improving the function and longevity of technical films as per industrial applications. The development of personalised firm solutions designed for specific niches will continue to gain momentum in the forecasted period.

2020 to 2024 Trends 2025 to 2035 Projections
Initial focus on reducing single-use plastics. Stricter global policies mandating biodegradable and recyclable technical films.
Development of basic multi-layered films. Expansion of smart films, high-barrier, and self-healing technical films.
Widely used in packaging and automotive industries. Increased adoption of renewable energy, medical devices, and flexible electronics.
Dominated by major film manufacturers. Rise of sustainable material startups and collaborations with tech industries.
Growth driven by food packaging and industrial applications. industry expansion fueled by AI-optimized film manufacturing and sustainable solutions.
Early-stage transition to eco-friendly film materials. Large-scale adoption of bio-based and fully recyclable technical films.
Limited use of AI in production processes. AI-driven predictive modeling and automated film production enhancements.
Focus on high-barrier and lightweight films. Development of multi-functional, smart, and temperature-resistant technical films.

Country-wise Analysis

United States

The United States has been leading the technical film industry due to its surging demand for high-performance, durable and multifunctional films across various industries, including packaging, automotive and construction.

The demand for high-barrier, UV-resistant, and flexible films has forced manufacturers to develop advanced technical films that provide enhanced protection and performance to products. Further, the demand for high-barrier, UV-protected and flexible films has encouraged the manufacturers to develop advanced films that provide protection and performance to products.

Further, government regulations favouring sustainable and recycled materials insist that companies adopt environmentally friendly and biodegradable film solutions. Further, technological advancements in nanocoatings, multi-layer structures and self-healing film technologies are enhancing functionality and longevity of technical films.

Country CAGR (2025 to 2035)
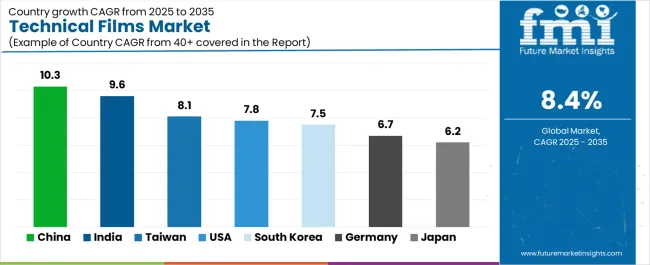
United States 5.4%

Japan

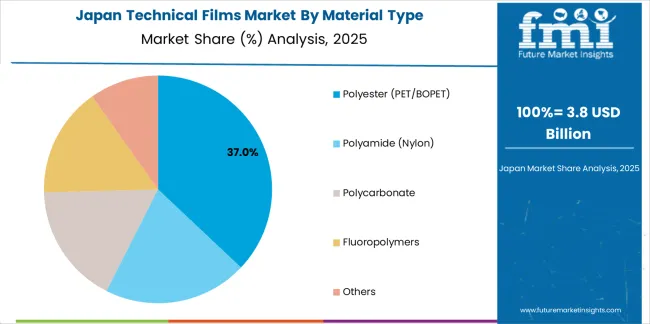
In Japan, the technical films industry continues to grow steadily due to the rising demand for precision-engineered and high-performance films in the electronics and semiconductor and display panel segments. Brands are innovating technical films with ultra-thin layers, scratch-resistant coatings and optical clarity to improve durability and performance.

As electronic waste and sustainable materials become ever more tightly regulated, companies are migrating toward recyclable and bio-based technical films. Similarly, growth in flexible display films and EMI shielding coatings is provided to applications that require conductivity and electromagnetic protection.

For the same reason, businesses are investing in automation-friendly film manufacturing technologies. Moreover, the growth of high-tech consumer electronics and wearable devices in Japan is driving demand for specialized high-quality technical films in different industries.

Country CAGR (2025 to 2035)
Japan 4.5%

South Korea

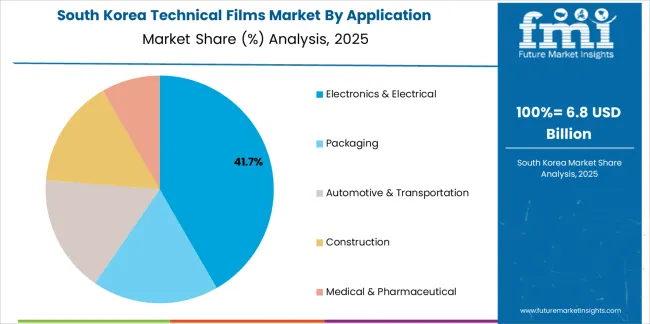
The rising demand for flexible, lightweight, and high-barrier films for the automotive, electronics, and packing industries is driving the growth of technical films in South Korea. This has encouraged manufacturers to work on creating multi-functional solutions with better thermal stability, anti-glare and chemical resistance properties for low-emissivity films in which they have sensors/devices incorporated as part of the structure.

Additionally, the introduction of new government regulations promoting sustainable materials further strengthened industry growth. Furthermore, companies are incorporating nanotechnology and AI-enabled material design in technical films to enhance functionality and recyclability.

Increased adoption is also driven by rising demand for photographic window films (energy-efficient window films), protective coatings for smartphones and electronic devices, and flexible printed electronics. In addition, research in self-cleaning and anti-fingerprint coatings is helping businesses to find new technical film solutions for high-tech and consumer-oriented marketplaces.

Country CAGR (2025 to 2035)
South Korea 5.2%

United Kingdom

The technical films industry in the United Kingdom is growing steadily, with companies focusing more on sustainability, regulatory compliance, and superior performance in industrial and consumer applications. Broad adoption across end-use industries, such as food packaging, aerospace, and renewable energy, has been bolstered by robust demand for heat-resistant, anti-fog, and high-strength films.

Government efforts to promote green materials, including recyclable and compostable technical films, are thus urging companies to integrate more such eco-friendly products. Innovations in lightweight and high-barrier films bring more attractiveness in high-performance applications.

Some companies are investing in printed electronic films and intelligent coatings that can improve product functionality. Moreover, the UK industry is expected to see a growing demand for technical films as protection films and smart surfaces are becoming popular in automotive and construction.

Country CAGR (2025 to 2035)
United Kingdom 4.9%

Competitive Outlook

The technical films industry is driven by growing demand in electronics, automotive, healthcare, and packaging applications. The industry is being driven by innovation through new formulations of materials, including bio-based polymers, ultra-thin laminates, and high-barrier films, which are tackling issues related to performance, sustainability, and efficiency. Automated manufacturing and artificial intelligence-optimized supply chains are also affecting industry trends.

Increased demand for sustainable and high-performance film alternatives is also propelling industry growth. Furthermore, increased investments in green film production technologies improve product efficiency. Companies are also exploring hybrid technical film solutions that incorporate strength, flexibility, and recyclability for enhanced durability. Furthermore, collaborations between corporate players and video suppliers are driving tailored technical video improvement for certain trade construction.

Market Share Analysis by Company

Company Name Estimated Market Share (%)
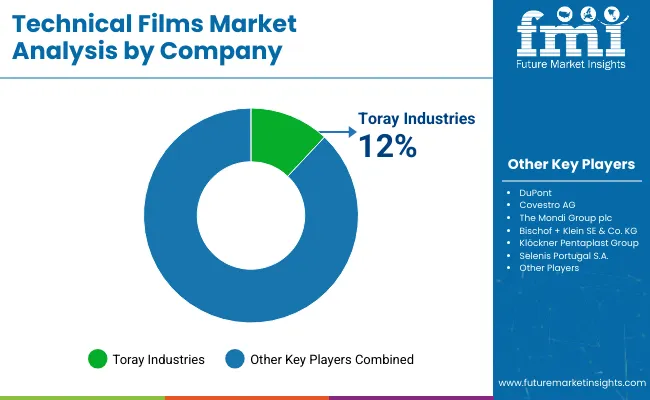
Toray Industries 12-16%
DuPont 8-12%
Covestro AG 6-10%
3M Company 4-8%
Amcor Limited 4-8%
Other Companies (combined) 45-55%

Key Company Offerings and Activities

Company Name Key Offerings/Activities
Toray Industries Develops high-performance polymer-based technical films for electronics and industrial applications.
DuPont Specializes in multi-layered, moisture-resistant technical films for medical and packaging industries.
Covestro AG Produces durable, lightweight technical films with advanced mechanical properties.
3M Company Expands its product line with high-barrier and self-healing technical films for specialized applications.
Amcor Limited Develops sustainable and high-performance technical films with advanced barrier properties for multiple industries.

Key Company Insights

Toray Industries (12-16%)

Leading provider of high-performance technical films, focusing on innovation and durability.

DuPont (8-12%)

Strong presence in medical and food packaging sectors, offering moisture-resistant and tamper-proof films.

Covestro AG (6-10%)

Innovates with ultra-thin, high-strength films catering to electronics and automotive industries.

3M Company (4-8%)

Develops advanced multi-layered technical films with enhanced mechanical and optical properties.

Amcor Limited (4-8%)

Develops sustainable and high-performance technical films with advanced barrier properties for multiple industries.

Other Key Players (45-55% Combined)

Various specialty film manufacturers contribute to industry growth, including:

  • Mitsubishi Polyester Film: Specializes in high-performance polyester films for industrial applications.
  • Klöckner Pentaplast: Develops bio-based and high-barrier films for medical and food packaging industries.
  • Berry Global Inc.: Focuses on sustainable and recyclable technical film solutions.

Report Scope Table - Technical Films Market

Report Attributes Details
Current Total Market Size (2025) USD 42.69 billion
Projected Market Size (2035) USD 71.55 billion
CAGR (2025 to 2035) 5.3%
Base Year for Estimation 2024
Historical Period 2020 to 2024
Projections Period 2025 to 2035
Quantitative Units USD billion for value and kilotons for volume
Film Types Analyzed (Segment 1) Stretch Films, Shrink Films, Barrier Films, Conductive Films, Safety & Security Films, Anti-Fog Films, Other Technical Films
Materials Analyzed (Segment 2) Polyethylene (PE), LDPE, LLDPE, Polyethylene Terephthalate (PET), Polyamide (PA), Polypropylene (PP), Polyvinyl Chloride (PVC), Ethylene Vinyl Alcohol (EVOH), Polyurethane (PU), Aluminum, Polycarbonate (PC), Others
Thickness Types Analyzed (Segment 3) Up to 25 microns, 25-50 microns, 50-100 microns, 100-150 microns, Above 150 microns
End Use Industries Analyzed (Segment 4) Food & Beverage, Cosmetic & Personal Care, Chemical, Agriculture, Building & Construction, Pharmaceutical, Electrical & Electronic, Automobile, Others
Regions Covered North America; Latin America; Western Europe; Eastern Europe; South Asia and Pacific; East Asia; Middle East & Africa
Countries Covered United States, Canada, Mexico, Brazil, Argentina, Germany, France, United Kingdom, Italy, Spain, Netherlands, China, India, Japan, South Korea, ANZ, GCC Countries, South Africa
Key Players influencing the Technical Films Market Toray Industries, DuPont, Covestro AG, The Mondi Group plc, Bischof + Klein SE & Co. KG, Klöckner Pentaplast Group, Selenis Portugal S.A., Polifilm GmbH, Futamura Chemical Co. Ltd, Vizelpas, Bioplast, HYPAC Packaging Pte Ltd, Perlen Packaging AG, HAFLIGER Film Spa, Idealplast Srl, Cassioli Srl, Kuhne Anlagenbau GmbH
Additional Attributes Dollar sales by film type (barrier, shrink, conductive), Material-based adoption trends (PET, EVOH, aluminum), Thickness demand by application, End-use industry packaging advancements, Sustainability trends and recyclable multilayer films, Regional expansion of barrier and safety films
Customization and Pricing Customization and Pricing Available on Request

Key Segments Profiled In The Global Technical Films Market

By Films Type:

  • Stretch Films
  • Shrink Films
  • Barrier Films
  • Conductive Films
  • Safety & Security Films
  • Anti-Fog Films
  • Other Technical Films

By Material:

  • Polyethylene (PE)
    • LDPE
    • LLDPE
  • Polyethylene terephthalate (PET)
  • Polyamide (PA)
  • Polypropylene (PP)
  • Polyvinyl Chloride (PVC)
  • Ethylene vinyl alcohol (EVOH)
  • Polyurethane (PU)
  • Aluminum
  • Polycarbonate (PC)
  • Others

By Thickness Type:

  • Up to 25 microns
  • 25-50 microns
  • 50-100 microns
  • 100-150 microns
  • above 150 microns

By End Use Industry:

  • Food & Beverage
  • Cosmetic & Personal Care
  • Chemical
  • Agriculture
  • Building & Construction
  • Pharmaceutical
  • Electrical & Electronic
  • Automobile
  • Others

By Region:

  • North America
  • Latin America
  • Western Europe
  • Eastern Europe
  • South Asia and Pacific
  • East Asia
  • Middle East and Africa

Table of Content

  1. Executive Summary
  2. Market Overview
  3. Market Background
  4. Global Market Analysis 2020 to 2024 and Forecast, 2025 to 2035
  5. Global Market Analysis 2020 to 2024 and Forecast 2025 to 2035, By Film Type
    • Stretch Film
    • Shrink Film
    • Barrier Film
    • Conductive Film
    • Safety & Security Film
    • Anti-Fog Film
    • Other Technical Films
  6. Global Market Analysis 2020 to 2024 and Forecast 2025 to 2035, By Material
    • Polyethylene (PE)
      • LDPE
      • LLDPE
    • Polyethylene terephthalate (PET)
    • Polyamide (PA)
    • Polypropylene (PP)
    • Polyvinyl Chloride (PVC)
    • Ethylene Vinyl Alcohol (EVOH)
    • Polyurethane (PU)
    • Aluminum
    • Polycarbonate (PC)
    • Others
  7. Global Market Analysis 2020 to 2024 and Forecast 2025 to 2035, By Thickness Type
    • Up to 25 microns
    • 25-50 microns
    • 50-100 microns
    • 100-150 microns
    • Above 150 microns
  8. Global Market Analysis 2020 to 2024 and Forecast 2025 to 2035, By End Use Industry
    • Food & Beverage
    • Cosmetic & Personal Care
    • Chemical
    • Agriculture
    • Building & Construction
    • Pharmaceutical
    • Electrical & Electronic
    • Automobile
    • Others
  9. Global Market Analysis 2020 to 2024 and Forecast 2025 to 2035, By Region
    • North America
    • Latin America
    • Western Europe
    • Eastern Europe
    • South Asia and Pacific
    • East Asia
    • Middle East and Africa
  10. North America Market Analysis 2020 to 2024 and Forecast 2025 to 2035, By Country
  11. Latin America Market Analysis 2020 to 2024 and Forecast 2025 to 2035, By Country
  12. Western Europe Market Analysis 2020 to 2024 and Forecast 2025 to 2035, By Country
  13. Eastern Europe Market Analysis 2020 to 2024 and Forecast 2025 to 2035, By Country
  14. South Asia and Pacific Market Analysis 2020 to 2024 and Forecast 2025 to 2035, By Country
  15. East Asia Market Analysis 2020 to 2024 and Forecast 2025 to 2035, By Country
  16. Middle East and Africa Market Analysis 2020 to 2024 and Forecast 2025 to 2035, By Country
  17. Key Countries Market Analysis
  18. Market Structure Analysis
  19. Competition Analysis
    • The Mondi Group plc
    • Bischof + Klein SE & Co. KG
    • Klöckner Pentaplast Group
    • Selenis Portugal S.A.
    • Polifilm GmbH
    • Futamura Chemical Co. Ltd
    • Vizelpas
    • Bioplast
    • HYPAC Packaging Pte Ltd
    • Perlen Packaging AG
    • HAFLIGER Film Spa
    • Idealplast Srl
    • Cassioli Srl
    • Kuhne Anlagenbau GmbH
  20. Assumptions & Acronyms Used
  21. Research Methodology

List of Tables

Table 1: Global Market Value (US$ Million) Forecast by Region, 2018 to 2033

Table 2: Global Market Volume (Tons) Forecast by Region, 2018 to 2033

Table 3: Global Market Value (US$ Million) Forecast by Film Type, 2018 to 2033

Table 4: Global Market Volume (Tons) Forecast by Film Type, 2018 to 2033

Table 5: Global Market Value (US$ Million) Forecast by Material, 2018 to 2033

Table 6: Global Market Volume (Tons) Forecast by Material, 2018 to 2033

Table 7: Global Market Value (US$ Million) Forecast by Thickness Type, 2018 to 2033

Table 8: Global Market Volume (Tons) Forecast by Thickness Type, 2018 to 2033

Table 9: Global Market Value (US$ Million) Forecast by End Use Industry, 2018 to 2033

Table 10: Global Market Volume (Tons) Forecast by End Use Industry, 2018 to 2033

Table 11: North America Market Value (US$ Million) Forecast by Country, 2018 to 2033

Table 12: North America Market Volume (Tons) Forecast by Country, 2018 to 2033

Table 13: North America Market Value (US$ Million) Forecast by Film Type, 2018 to 2033

Table 14: North America Market Volume (Tons) Forecast by Film Type, 2018 to 2033

Table 15: North America Market Value (US$ Million) Forecast by Material, 2018 to 2033

Table 16: North America Market Volume (Tons) Forecast by Material, 2018 to 2033

Table 17: North America Market Value (US$ Million) Forecast by Thickness Type, 2018 to 2033

Table 18: North America Market Volume (Tons) Forecast by Thickness Type, 2018 to 2033

Table 19: North America Market Value (US$ Million) Forecast by End Use Industry, 2018 to 2033

Table 20: North America Market Volume (Tons) Forecast by End Use Industry, 2018 to 2033

Table 21: Latin America Market Value (US$ Million) Forecast by Country, 2018 to 2033

Table 22: Latin America Market Volume (Tons) Forecast by Country, 2018 to 2033

Table 23: Latin America Market Value (US$ Million) Forecast by Film Type, 2018 to 2033

Table 24: Latin America Market Volume (Tons) Forecast by Film Type, 2018 to 2033

Table 25: Latin America Market Value (US$ Million) Forecast by Material, 2018 to 2033

Table 26: Latin America Market Volume (Tons) Forecast by Material, 2018 to 2033

Table 27: Latin America Market Value (US$ Million) Forecast by Thickness Type, 2018 to 2033

Table 28: Latin America Market Volume (Tons) Forecast by Thickness Type, 2018 to 2033

Table 29: Latin America Market Value (US$ Million) Forecast by End Use Industry, 2018 to 2033

Table 30: Latin America Market Volume (Tons) Forecast by End Use Industry, 2018 to 2033

Table 31: Western Europe Market Value (US$ Million) Forecast by Country, 2018 to 2033

Table 32: Western Europe Market Volume (Tons) Forecast by Country, 2018 to 2033

Table 33: Western Europe Market Value (US$ Million) Forecast by Film Type, 2018 to 2033

Table 34: Western Europe Market Volume (Tons) Forecast by Film Type, 2018 to 2033

Table 35: Western Europe Market Value (US$ Million) Forecast by Material, 2018 to 2033

Table 36: Western Europe Market Volume (Tons) Forecast by Material, 2018 to 2033

Table 37: Western Europe Market Value (US$ Million) Forecast by Thickness Type, 2018 to 2033

Table 38: Western Europe Market Volume (Tons) Forecast by Thickness Type, 2018 to 2033

Table 39: Western Europe Market Value (US$ Million) Forecast by End Use Industry, 2018 to 2033

Table 40: Western Europe Market Volume (Tons) Forecast by End Use Industry, 2018 to 2033

Table 41: Eastern Europe Market Value (US$ Million) Forecast by Country, 2018 to 2033

Table 42: Eastern Europe Market Volume (Tons) Forecast by Country, 2018 to 2033

Table 43: Eastern Europe Market Value (US$ Million) Forecast by Film Type, 2018 to 2033

Table 44: Eastern Europe Market Volume (Tons) Forecast by Film Type, 2018 to 2033

Table 45: Eastern Europe Market Value (US$ Million) Forecast by Material, 2018 to 2033

Table 46: Eastern Europe Market Volume (Tons) Forecast by Material, 2018 to 2033

Table 47: Eastern Europe Market Value (US$ Million) Forecast by Thickness Type, 2018 to 2033

Table 48: Eastern Europe Market Volume (Tons) Forecast by Thickness Type, 2018 to 2033

Table 49: Eastern Europe Market Value (US$ Million) Forecast by End Use Industry, 2018 to 2033

Table 50: Eastern Europe Market Volume (Tons) Forecast by End Use Industry, 2018 to 2033

Table 51: South Asia and Pacific Market Value (US$ Million) Forecast by Country, 2018 to 2033

Table 52: South Asia and Pacific Market Volume (Tons) Forecast by Country, 2018 to 2033

Table 53: South Asia and Pacific Market Value (US$ Million) Forecast by Film Type, 2018 to 2033

Table 54: South Asia and Pacific Market Volume (Tons) Forecast by Film Type, 2018 to 2033

Table 55: South Asia and Pacific Market Value (US$ Million) Forecast by Material, 2018 to 2033

Table 56: South Asia and Pacific Market Volume (Tons) Forecast by Material, 2018 to 2033

Table 57: South Asia and Pacific Market Value (US$ Million) Forecast by Thickness Type, 2018 to 2033

Table 58: South Asia and Pacific Market Volume (Tons) Forecast by Thickness Type, 2018 to 2033

Table 59: South Asia and Pacific Market Value (US$ Million) Forecast by End Use Industry, 2018 to 2033

Table 60: South Asia and Pacific Market Volume (Tons) Forecast by End Use Industry, 2018 to 2033

Table 61: East Asia Market Value (US$ Million) Forecast by Country, 2018 to 2033

Table 62: East Asia Market Volume (Tons) Forecast by Country, 2018 to 2033

Table 63: East Asia Market Value (US$ Million) Forecast by Film Type, 2018 to 2033

Table 64: East Asia Market Volume (Tons) Forecast by Film Type, 2018 to 2033

Table 65: East Asia Market Value (US$ Million) Forecast by Material, 2018 to 2033

Table 66: East Asia Market Volume (Tons) Forecast by Material, 2018 to 2033

Table 67: East Asia Market Value (US$ Million) Forecast by Thickness Type, 2018 to 2033

Table 68: East Asia Market Volume (Tons) Forecast by Thickness Type, 2018 to 2033

Table 69: East Asia Market Value (US$ Million) Forecast by End Use Industry, 2018 to 2033

Table 70: East Asia Market Volume (Tons) Forecast by End Use Industry, 2018 to 2033

Table 71: Middle East and Africa Market Value (US$ Million) Forecast by Country, 2018 to 2033

Table 72: Middle East and Africa Market Volume (Tons) Forecast by Country, 2018 to 2033

Table 73: Middle East and Africa Market Value (US$ Million) Forecast by Film Type, 2018 to 2033

Table 74: Middle East and Africa Market Volume (Tons) Forecast by Film Type, 2018 to 2033

Table 75: Middle East and Africa Market Value (US$ Million) Forecast by Material, 2018 to 2033

Table 76: Middle East and Africa Market Volume (Tons) Forecast by Material, 2018 to 2033

Table 77: Middle East and Africa Market Value (US$ Million) Forecast by Thickness Type, 2018 to 2033

Table 78: Middle East and Africa Market Volume (Tons) Forecast by Thickness Type, 2018 to 2033

Table 79: Middle East and Africa Market Value (US$ Million) Forecast by End Use Industry, 2018 to 2033

Table 80: Middle East and Africa Market Volume (Tons) Forecast by End Use Industry, 2018 to 2033

List of Figures

Figure 1: Global Market Value (US$ Million) by Film Type, 2023 to 2033

Figure 2: Global Market Value (US$ Million) by Material, 2023 to 2033

Figure 3: Global Market Value (US$ Million) by Thickness Type, 2023 to 2033

Figure 4: Global Market Value (US$ Million) by End Use Industry, 2023 to 2033

Figure 5: Global Market Value (US$ Million) by Region, 2023 to 2033

Figure 6: Global Market Value (US$ Million) Analysis by Region, 2018 to 2033

Figure 7: Global Market Volume (Tons) Analysis by Region, 2018 to 2033

Figure 8: Global Market Value Share (%) and BPS Analysis by Region, 2023 to 2033

Figure 9: Global Market Y-o-Y Growth (%) Projections by Region, 2023 to 2033

Figure 10: Global Market Value (US$ Million) Analysis by Film Type, 2018 to 2033

Figure 11: Global Market Volume (Tons) Analysis by Film Type, 2018 to 2033

Figure 12: Global Market Value Share (%) and BPS Analysis by Film Type, 2023 to 2033

Figure 13: Global Market Y-o-Y Growth (%) Projections by Film Type, 2023 to 2033

Figure 14: Global Market Value (US$ Million) Analysis by Material, 2018 to 2033

Figure 15: Global Market Volume (Tons) Analysis by Material, 2018 to 2033

Figure 16: Global Market Value Share (%) and BPS Analysis by Material, 2023 to 2033

Figure 17: Global Market Y-o-Y Growth (%) Projections by Material, 2023 to 2033

Figure 18: Global Market Value (US$ Million) Analysis by Thickness Type, 2018 to 2033

Figure 19: Global Market Volume (Tons) Analysis by Thickness Type, 2018 to 2033

Figure 20: Global Market Value Share (%) and BPS Analysis by Thickness Type, 2023 to 2033

Figure 21: Global Market Y-o-Y Growth (%) Projections by Thickness Type, 2023 to 2033

Figure 22: Global Market Value (US$ Million) Analysis by End Use Industry, 2018 to 2033

Figure 23: Global Market Volume (Tons) Analysis by End Use Industry, 2018 to 2033

Figure 24: Global Market Value Share (%) and BPS Analysis by End Use Industry, 2023 to 2033

Figure 25: Global Market Y-o-Y Growth (%) Projections by End Use Industry, 2023 to 2033

Figure 26: Global Market Attractiveness by Film Type, 2023 to 2033

Figure 27: Global Market Attractiveness by Material, 2023 to 2033

Figure 28: Global Market Attractiveness by Thickness Type, 2023 to 2033

Figure 29: Global Market Attractiveness by End Use Industry, 2023 to 2033

Figure 30: Global Market Attractiveness by Region, 2023 to 2033

Figure 31: North America Market Value (US$ Million) by Film Type, 2023 to 2033

Figure 32: North America Market Value (US$ Million) by Material, 2023 to 2033

Figure 33: North America Market Value (US$ Million) by Thickness Type, 2023 to 2033

Figure 34: North America Market Value (US$ Million) by End Use Industry, 2023 to 2033

Figure 35: North America Market Value (US$ Million) by Country, 2023 to 2033

Figure 36: North America Market Value (US$ Million) Analysis by Country, 2018 to 2033

Figure 37: North America Market Volume (Tons) Analysis by Country, 2018 to 2033

Figure 38: North America Market Value Share (%) and BPS Analysis by Country, 2023 to 2033

Figure 39: North America Market Y-o-Y Growth (%) Projections by Country, 2023 to 2033

Figure 40: North America Market Value (US$ Million) Analysis by Film Type, 2018 to 2033

Figure 41: North America Market Volume (Tons) Analysis by Film Type, 2018 to 2033

Figure 42: North America Market Value Share (%) and BPS Analysis by Film Type, 2023 to 2033

Figure 43: North America Market Y-o-Y Growth (%) Projections by Film Type, 2023 to 2033

Figure 44: North America Market Value (US$ Million) Analysis by Material, 2018 to 2033

Figure 45: North America Market Volume (Tons) Analysis by Material, 2018 to 2033

Figure 46: North America Market Value Share (%) and BPS Analysis by Material, 2023 to 2033

Figure 47: North America Market Y-o-Y Growth (%) Projections by Material, 2023 to 2033

Figure 48: North America Market Value (US$ Million) Analysis by Thickness Type, 2018 to 2033

Figure 49: North America Market Volume (Tons) Analysis by Thickness Type, 2018 to 2033

Figure 50: North America Market Value Share (%) and BPS Analysis by Thickness Type, 2023 to 2033

Figure 51: North America Market Y-o-Y Growth (%) Projections by Thickness Type, 2023 to 2033

Figure 52: North America Market Value (US$ Million) Analysis by End Use Industry, 2018 to 2033

Figure 53: North America Market Volume (Tons) Analysis by End Use Industry, 2018 to 2033

Figure 54: North America Market Value Share (%) and BPS Analysis by End Use Industry, 2023 to 2033

Figure 55: North America Market Y-o-Y Growth (%) Projections by End Use Industry, 2023 to 2033

Figure 56: North America Market Attractiveness by Film Type, 2023 to 2033

Figure 57: North America Market Attractiveness by Material, 2023 to 2033

Figure 58: North America Market Attractiveness by Thickness Type, 2023 to 2033

Figure 59: North America Market Attractiveness by End Use Industry, 2023 to 2033

Figure 60: North America Market Attractiveness by Country, 2023 to 2033

Figure 61: Latin America Market Value (US$ Million) by Film Type, 2023 to 2033

Figure 62: Latin America Market Value (US$ Million) by Material, 2023 to 2033

Figure 63: Latin America Market Value (US$ Million) by Thickness Type, 2023 to 2033

Figure 64: Latin America Market Value (US$ Million) by End Use Industry, 2023 to 2033

Figure 65: Latin America Market Value (US$ Million) by Country, 2023 to 2033

Figure 66: Latin America Market Value (US$ Million) Analysis by Country, 2018 to 2033

Figure 67: Latin America Market Volume (Tons) Analysis by Country, 2018 to 2033

Figure 68: Latin America Market Value Share (%) and BPS Analysis by Country, 2023 to 2033

Figure 69: Latin America Market Y-o-Y Growth (%) Projections by Country, 2023 to 2033

Figure 70: Latin America Market Value (US$ Million) Analysis by Film Type, 2018 to 2033

Figure 71: Latin America Market Volume (Tons) Analysis by Film Type, 2018 to 2033

Figure 72: Latin America Market Value Share (%) and BPS Analysis by Film Type, 2023 to 2033

Figure 73: Latin America Market Y-o-Y Growth (%) Projections by Film Type, 2023 to 2033

Figure 74: Latin America Market Value (US$ Million) Analysis by Material, 2018 to 2033

Figure 75: Latin America Market Volume (Tons) Analysis by Material, 2018 to 2033

Figure 76: Latin America Market Value Share (%) and BPS Analysis by Material, 2023 to 2033

Figure 77: Latin America Market Y-o-Y Growth (%) Projections by Material, 2023 to 2033

Figure 78: Latin America Market Value (US$ Million) Analysis by Thickness Type, 2018 to 2033

Figure 79: Latin America Market Volume (Tons) Analysis by Thickness Type, 2018 to 2033

Figure 80: Latin America Market Value Share (%) and BPS Analysis by Thickness Type, 2023 to 2033

Figure 81: Latin America Market Y-o-Y Growth (%) Projections by Thickness Type, 2023 to 2033

Figure 82: Latin America Market Value (US$ Million) Analysis by End Use Industry, 2018 to 2033

Figure 83: Latin America Market Volume (Tons) Analysis by End Use Industry, 2018 to 2033

Figure 84: Latin America Market Value Share (%) and BPS Analysis by End Use Industry, 2023 to 2033

Figure 85: Latin America Market Y-o-Y Growth (%) Projections by End Use Industry, 2023 to 2033

Figure 86: Latin America Market Attractiveness by Film Type, 2023 to 2033

Figure 87: Latin America Market Attractiveness by Material, 2023 to 2033

Figure 88: Latin America Market Attractiveness by Thickness Type, 2023 to 2033

Figure 89: Latin America Market Attractiveness by End Use Industry, 2023 to 2033

Figure 90: Latin America Market Attractiveness by Country, 2023 to 2033

Figure 91: Western Europe Market Value (US$ Million) by Film Type, 2023 to 2033

Figure 92: Western Europe Market Value (US$ Million) by Material, 2023 to 2033

Figure 93: Western Europe Market Value (US$ Million) by Thickness Type, 2023 to 2033

Figure 94: Western Europe Market Value (US$ Million) by End Use Industry, 2023 to 2033

Figure 95: Western Europe Market Value (US$ Million) by Country, 2023 to 2033

Figure 96: Western Europe Market Value (US$ Million) Analysis by Country, 2018 to 2033

Figure 97: Western Europe Market Volume (Tons) Analysis by Country, 2018 to 2033

Figure 98: Western Europe Market Value Share (%) and BPS Analysis by Country, 2023 to 2033

Figure 99: Western Europe Market Y-o-Y Growth (%) Projections by Country, 2023 to 2033

Figure 100: Western Europe Market Value (US$ Million) Analysis by Film Type, 2018 to 2033

Figure 101: Western Europe Market Volume (Tons) Analysis by Film Type, 2018 to 2033

Figure 102: Western Europe Market Value Share (%) and BPS Analysis by Film Type, 2023 to 2033

Figure 103: Western Europe Market Y-o-Y Growth (%) Projections by Film Type, 2023 to 2033

Figure 104: Western Europe Market Value (US$ Million) Analysis by Material, 2018 to 2033

Figure 105: Western Europe Market Volume (Tons) Analysis by Material, 2018 to 2033

Figure 106: Western Europe Market Value Share (%) and BPS Analysis by Material, 2023 to 2033

Figure 107: Western Europe Market Y-o-Y Growth (%) Projections by Material, 2023 to 2033

Figure 108: Western Europe Market Value (US$ Million) Analysis by Thickness Type, 2018 to 2033

Figure 109: Western Europe Market Volume (Tons) Analysis by Thickness Type, 2018 to 2033

Figure 110: Western Europe Market Value Share (%) and BPS Analysis by Thickness Type, 2023 to 2033

Figure 111: Western Europe Market Y-o-Y Growth (%) Projections by Thickness Type, 2023 to 2033

Figure 112: Western Europe Market Value (US$ Million) Analysis by End Use Industry, 2018 to 2033

Figure 113: Western Europe Market Volume (Tons) Analysis by End Use Industry, 2018 to 2033

Figure 114: Western Europe Market Value Share (%) and BPS Analysis by End Use Industry, 2023 to 2033

Figure 115: Western Europe Market Y-o-Y Growth (%) Projections by End Use Industry, 2023 to 2033

Figure 116: Western Europe Market Attractiveness by Film Type, 2023 to 2033

Figure 117: Western Europe Market Attractiveness by Material, 2023 to 2033

Figure 118: Western Europe Market Attractiveness by Thickness Type, 2023 to 2033

Figure 119: Western Europe Market Attractiveness by End Use Industry, 2023 to 2033

Figure 120: Western Europe Market Attractiveness by Country, 2023 to 2033

Figure 121: Eastern Europe Market Value (US$ Million) by Film Type, 2023 to 2033

Figure 122: Eastern Europe Market Value (US$ Million) by Material, 2023 to 2033

Figure 123: Eastern Europe Market Value (US$ Million) by Thickness Type, 2023 to 2033

Figure 124: Eastern Europe Market Value (US$ Million) by End Use Industry, 2023 to 2033

Figure 125: Eastern Europe Market Value (US$ Million) by Country, 2023 to 2033

Figure 126: Eastern Europe Market Value (US$ Million) Analysis by Country, 2018 to 2033

Figure 127: Eastern Europe Market Volume (Tons) Analysis by Country, 2018 to 2033

Figure 128: Eastern Europe Market Value Share (%) and BPS Analysis by Country, 2023 to 2033

Figure 129: Eastern Europe Market Y-o-Y Growth (%) Projections by Country, 2023 to 2033

Figure 130: Eastern Europe Market Value (US$ Million) Analysis by Film Type, 2018 to 2033

Figure 131: Eastern Europe Market Volume (Tons) Analysis by Film Type, 2018 to 2033

Figure 132: Eastern Europe Market Value Share (%) and BPS Analysis by Film Type, 2023 to 2033

Figure 133: Eastern Europe Market Y-o-Y Growth (%) Projections by Film Type, 2023 to 2033

Figure 134: Eastern Europe Market Value (US$ Million) Analysis by Material, 2018 to 2033

Figure 135: Eastern Europe Market Volume (Tons) Analysis by Material, 2018 to 2033

Figure 136: Eastern Europe Market Value Share (%) and BPS Analysis by Material, 2023 to 2033

Figure 137: Eastern Europe Market Y-o-Y Growth (%) Projections by Material, 2023 to 2033

Figure 138: Eastern Europe Market Value (US$ Million) Analysis by Thickness Type, 2018 to 2033

Figure 139: Eastern Europe Market Volume (Tons) Analysis by Thickness Type, 2018 to 2033

Figure 140: Eastern Europe Market Value Share (%) and BPS Analysis by Thickness Type, 2023 to 2033

Figure 141: Eastern Europe Market Y-o-Y Growth (%) Projections by Thickness Type, 2023 to 2033

Figure 142: Eastern Europe Market Value (US$ Million) Analysis by End Use Industry, 2018 to 2033

Figure 143: Eastern Europe Market Volume (Tons) Analysis by End Use Industry, 2018 to 2033

Figure 144: Eastern Europe Market Value Share (%) and BPS Analysis by End Use Industry, 2023 to 2033

Figure 145: Eastern Europe Market Y-o-Y Growth (%) Projections by End Use Industry, 2023 to 2033

Figure 146: Eastern Europe Market Attractiveness by Film Type, 2023 to 2033

Figure 147: Eastern Europe Market Attractiveness by Material, 2023 to 2033

Figure 148: Eastern Europe Market Attractiveness by Thickness Type, 2023 to 2033

Figure 149: Eastern Europe Market Attractiveness by End Use Industry, 2023 to 2033

Figure 150: Eastern Europe Market Attractiveness by Country, 2023 to 2033

Figure 151: South Asia and Pacific Market Value (US$ Million) by Film Type, 2023 to 2033

Figure 152: South Asia and Pacific Market Value (US$ Million) by Material, 2023 to 2033

Figure 153: South Asia and Pacific Market Value (US$ Million) by Thickness Type, 2023 to 2033

Figure 154: South Asia and Pacific Market Value (US$ Million) by End Use Industry, 2023 to 2033

Figure 155: South Asia and Pacific Market Value (US$ Million) by Country, 2023 to 2033

Figure 156: South Asia and Pacific Market Value (US$ Million) Analysis by Country, 2018 to 2033

Figure 157: South Asia and Pacific Market Volume (Tons) Analysis by Country, 2018 to 2033

Figure 158: South Asia and Pacific Market Value Share (%) and BPS Analysis by Country, 2023 to 2033

Figure 159: South Asia and Pacific Market Y-o-Y Growth (%) Projections by Country, 2023 to 2033

Figure 160: South Asia and Pacific Market Value (US$ Million) Analysis by Film Type, 2018 to 2033

Figure 161: South Asia and Pacific Market Volume (Tons) Analysis by Film Type, 2018 to 2033

Figure 162: South Asia and Pacific Market Value Share (%) and BPS Analysis by Film Type, 2023 to 2033

Figure 163: South Asia and Pacific Market Y-o-Y Growth (%) Projections by Film Type, 2023 to 2033

Figure 164: South Asia and Pacific Market Value (US$ Million) Analysis by Material, 2018 to 2033

Figure 165: South Asia and Pacific Market Volume (Tons) Analysis by Material, 2018 to 2033

Figure 166: South Asia and Pacific Market Value Share (%) and BPS Analysis by Material, 2023 to 2033

Figure 167: South Asia and Pacific Market Y-o-Y Growth (%) Projections by Material, 2023 to 2033

Figure 168: South Asia and Pacific Market Value (US$ Million) Analysis by Thickness Type, 2018 to 2033

Figure 169: South Asia and Pacific Market Volume (Tons) Analysis by Thickness Type, 2018 to 2033

Figure 170: South Asia and Pacific Market Value Share (%) and BPS Analysis by Thickness Type, 2023 to 2033

Figure 171: South Asia and Pacific Market Y-o-Y Growth (%) Projections by Thickness Type, 2023 to 2033

Figure 172: South Asia and Pacific Market Value (US$ Million) Analysis by End Use Industry, 2018 to 2033

Figure 173: South Asia and Pacific Market Volume (Tons) Analysis by End Use Industry, 2018 to 2033

Figure 174: South Asia and Pacific Market Value Share (%) and BPS Analysis by End Use Industry, 2023 to 2033

Figure 175: South Asia and Pacific Market Y-o-Y Growth (%) Projections by End Use Industry, 2023 to 2033

Figure 176: South Asia and Pacific Market Attractiveness by Film Type, 2023 to 2033

Figure 177: South Asia and Pacific Market Attractiveness by Material, 2023 to 2033

Figure 178: South Asia and Pacific Market Attractiveness by Thickness Type, 2023 to 2033

Figure 179: South Asia and Pacific Market Attractiveness by End Use Industry, 2023 to 2033

Figure 180: South Asia and Pacific Market Attractiveness by Country, 2023 to 2033

Figure 181: East Asia Market Value (US$ Million) by Film Type, 2023 to 2033

Figure 182: East Asia Market Value (US$ Million) by Material, 2023 to 2033

Figure 183: East Asia Market Value (US$ Million) by Thickness Type, 2023 to 2033

Figure 184: East Asia Market Value (US$ Million) by End Use Industry, 2023 to 2033

Figure 185: East Asia Market Value (US$ Million) by Country, 2023 to 2033

Figure 186: East Asia Market Value (US$ Million) Analysis by Country, 2018 to 2033

Figure 187: East Asia Market Volume (Tons) Analysis by Country, 2018 to 2033

Figure 188: East Asia Market Value Share (%) and BPS Analysis by Country, 2023 to 2033

Figure 189: East Asia Market Y-o-Y Growth (%) Projections by Country, 2023 to 2033

Figure 190: East Asia Market Value (US$ Million) Analysis by Film Type, 2018 to 2033

Figure 191: East Asia Market Volume (Tons) Analysis by Film Type, 2018 to 2033

Figure 192: East Asia Market Value Share (%) and BPS Analysis by Film Type, 2023 to 2033

Figure 193: East Asia Market Y-o-Y Growth (%) Projections by Film Type, 2023 to 2033

Figure 194: East Asia Market Value (US$ Million) Analysis by Material, 2018 to 2033

Figure 195: East Asia Market Volume (Tons) Analysis by Material, 2018 to 2033

Figure 196: East Asia Market Value Share (%) and BPS Analysis by Material, 2023 to 2033

Figure 197: East Asia Market Y-o-Y Growth (%) Projections by Material, 2023 to 2033

Figure 198: East Asia Market Value (US$ Million) Analysis by Thickness Type, 2018 to 2033

Figure 199: East Asia Market Volume (Tons) Analysis by Thickness Type, 2018 to 2033

Figure 200: East Asia Market Value Share (%) and BPS Analysis by Thickness Type, 2023 to 2033

Figure 201: East Asia Market Y-o-Y Growth (%) Projections by Thickness Type, 2023 to 2033

Figure 202: East Asia Market Value (US$ Million) Analysis by End Use Industry, 2018 to 2033

Figure 203: East Asia Market Volume (Tons) Analysis by End Use Industry, 2018 to 2033

Figure 204: East Asia Market Value Share (%) and BPS Analysis by End Use Industry, 2023 to 2033

Figure 205: East Asia Market Y-o-Y Growth (%) Projections by End Use Industry, 2023 to 2033

Figure 206: East Asia Market Attractiveness by Film Type, 2023 to 2033

Figure 207: East Asia Market Attractiveness by Material, 2023 to 2033

Figure 208: East Asia Market Attractiveness by Thickness Type, 2023 to 2033

Figure 209: East Asia Market Attractiveness by End Use Industry, 2023 to 2033

Figure 210: East Asia Market Attractiveness by Country, 2023 to 2033

Figure 211: Middle East and Africa Market Value (US$ Million) by Film Type, 2023 to 2033

Figure 212: Middle East and Africa Market Value (US$ Million) by Material, 2023 to 2033

Figure 213: Middle East and Africa Market Value (US$ Million) by Thickness Type, 2023 to 2033

Figure 214: Middle East and Africa Market Value (US$ Million) by End Use Industry, 2023 to 2033

Figure 215: Middle East and Africa Market Value (US$ Million) by Country, 2023 to 2033

Figure 216: Middle East and Africa Market Value (US$ Million) Analysis by Country, 2018 to 2033

Figure 217: Middle East and Africa Market Volume (Tons) Analysis by Country, 2018 to 2033

Figure 218: Middle East and Africa Market Value Share (%) and BPS Analysis by Country, 2023 to 2033

Figure 219: Middle East and Africa Market Y-o-Y Growth (%) Projections by Country, 2023 to 2033

Figure 220: Middle East and Africa Market Value (US$ Million) Analysis by Film Type, 2018 to 2033

Figure 221: Middle East and Africa Market Volume (Tons) Analysis by Film Type, 2018 to 2033

Figure 222: Middle East and Africa Market Value Share (%) and BPS Analysis by Film Type, 2023 to 2033

Figure 223: Middle East and Africa Market Y-o-Y Growth (%) Projections by Film Type, 2023 to 2033

Figure 224: Middle East and Africa Market Value (US$ Million) Analysis by Material, 2018 to 2033

Figure 225: Middle East and Africa Market Volume (Tons) Analysis by Material, 2018 to 2033

Figure 226: Middle East and Africa Market Value Share (%) and BPS Analysis by Material, 2023 to 2033

Figure 227: Middle East and Africa Market Y-o-Y Growth (%) Projections by Material, 2023 to 2033

Figure 228: Middle East and Africa Market Value (US$ Million) Analysis by Thickness Type, 2018 to 2033

Figure 229: Middle East and Africa Market Volume (Tons) Analysis by Thickness Type, 2018 to 2033

Figure 230: Middle East and Africa Market Value Share (%) and BPS Analysis by Thickness Type, 2023 to 2033

Figure 231: Middle East and Africa Market Y-o-Y Growth (%) Projections by Thickness Type, 2023 to 2033

Figure 232: Middle East and Africa Market Value (US$ Million) Analysis by End Use Industry, 2018 to 2033

Figure 233: Middle East and Africa Market Volume (Tons) Analysis by End Use Industry, 2018 to 2033

Figure 234: Middle East and Africa Market Value Share (%) and BPS Analysis by End Use Industry, 2023 to 2033

Figure 235: Middle East and Africa Market Y-o-Y Growth (%) Projections by End Use Industry, 2023 to 2033

Figure 236: Middle East and Africa Market Attractiveness by Film Type, 2023 to 2033

Figure 237: Middle East and Africa Market Attractiveness by Material, 2023 to 2033

Figure 238: Middle East and Africa Market Attractiveness by Thickness Type, 2023 to 2033

Figure 239: Middle East and Africa Market Attractiveness by End Use Industry, 2023 to 2033

Figure 240: Middle East and Africa Market Attractiveness by Country, 2023 to 2033

Frequently Asked Questions

What was the overall size of the Technical Films industry in 2025?

The overall industry size for the Technical Films industry was USD 42.69 Billion in 2025.

How big is the Biodegradable Technical Films industry expected to be in 2035?

The Technical Films industry is expected to reach USD 71.55 Billion in 2035.

What will drive the demand for the Technical Films industry during the forecast period?

The industry will be driven by increasing demand from electronics, automotive, and packaging industries. Sustainability trends, innovations in high-barrier films, and improvements in material durability will further propel industry expansion.

What are the key challenges facing the Technical Films industry?

Key challenges include high production costs, environmental concerns related to plastic waste, and regulatory compliance issues. However, advancements in recyclable materials and biodegradable films are helping to mitigate these challenges.

Explore Similar Insights

Future Market Insights

Technical Films Market