The sales of MDO-PE films are estimated to be worth USD 844.2 million in 2025 and anticipated to reach a value of USD 1,310.9 million by 2035. Sales are projected to rise at a CAGR of 4.5% over the forecast period between 2025 and 2035. The revenue generated by MDO-PE films in 2024 was USD 820.4 million. The industry is anticipated to exhibit a Y-o-Y growth of 4.3% in 2025.
Demand in MDO-PE (Machine Direction Orientation Polyethylene) films by the food sector is rising, as their increased packaging solutions present higher strength and durability while increasing flexibility to hold freshness. In food packaging, high clarity and moisture resistance, along with excellent barrier properties, are demanded.
For these requirements, MDO-PE films are gaining market share in applications such as snack foods, dairy, frozen foods, and ready-to-eat meals. Demand in Flexible Packaging Formats Such as Pouches and Wraps Due to their extended shelf life and better food safety, these films are increasingly in demand in flexible packaging formats such as pouches and wraps. The food segment is expected to rise as high as USD 239.7 million by 2025 and accounts for over 25% of the total market share for MDO-PE films.
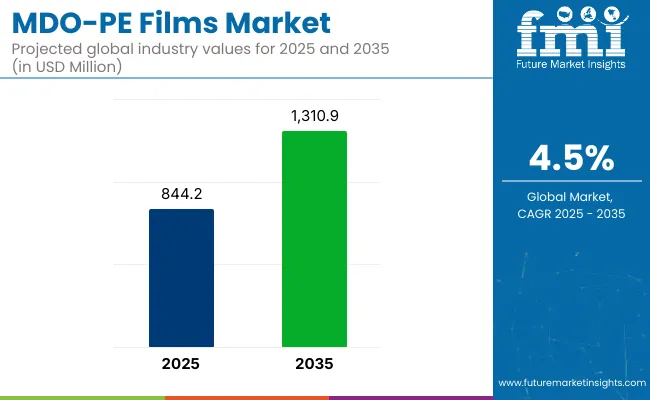
| Metric | Value |
|---|---|
| Industry Size (2025E) | USD 844.2 million |
| Industry Value (2035F) | USD 1,310.9 million |
| CAGR (2025 to 2035) | 4.5% |
Pouches, of late, have become very popular in the packaging industry. Convenient and cost-effective, this packaging method with the right kind of versatility has been hailed as a boon for the food and beverage industry. These are used in ready-to-eat meals, snacks, sauces, liquid products such as juices and beverages, and even pet food.
Lightweight, preservative freshness and full utilization of space have taken the advantage out of shelf as well as convenience of consumption of products. This pouch is mainly suitable for these products which needs tamper evidential seal as well as need reclosability. Pouch packaging market shall reach up to USD 216.1 Million by 2025 and also increase with rise in demand from flexible consumerfriendly solutions.
Machine Direction Oriented Polyethylene (MDO-PE) films are subject to regulatory oversight to ensure environmental compliance, material safety, and suitability for food and medical applications. These films, widely used in packaging due to their recyclability and mechanical strength, must meet national and international standards related to chemical composition, recyclability, and end-use safety.
Food Contact and Packaging Compliance
MDO-PE films used in food packaging must comply with food safety regulations such as the U.S. Food and Drug Administration (FDA) 21 CFR and the European Commission Regulation (EU) No 10/2011. These laws govern the use of plastic materials intended to come into contact with food and require that materials do not transfer harmful substances into food under intended conditions of use.
Recyclability and Circular Economy Standards
Governments in the European Union and North America promote the use of recyclable mono-material films like MDO-PE under circular economy initiatives. The EU’s Packaging and Packaging Waste Directive encourages the use of single-material solutions to improve post-consumer recycling efficiency. Similarly, organizations such as the Ellen MacArthur Foundation support guidelines for designing packaging that meets recyclability criteria.
Chemical Safety and Additive Restrictions
MDO-PE films must comply with chemical safety regulations including REACH (Registration, Evaluation, Authorisation, and Restriction of Chemicals) in the EU and TSCA (Toxic Substances Control Act) in the U.S.
Trade Scenario for MDO-PE Films
The global trade of Machine Direction Oriented Polyethylene (MDO-PE) films is growing steadily as manufacturers and brand owners shift toward recyclable, mono-material packaging solutions. Driven by environmental regulations and increasing demand for sustainable alternatives to multi-layer films, MDO-PE films are being widely adopted across food, personal care, medical, and industrial packaging sectors.
Major Exporting Countries
Key exporters of MDO-PE films include Germany, the United States, China, South Korea, and Japan. Germany and the U.S. lead in supplying high-performance MDO-PE films with superior optical and barrier properties tailored for food and hygiene packaging. China and South Korea provide cost-effective solutions for global markets, while Japan focuses on high-precision, specialty-grade films for electronics and healthcare applications.
Major Importing Countries
Top importers include India, Brazil, Indonesia, Mexico, and several Eastern European nations. These markets are rapidly adopting MDO-PE films as part of their transition to recyclable and sustainable packaging formats. Government mandates on plastic waste reduction and increased investment in local packaging industries are driving demand for imported MDO-PE materials and technologies.
The below table presents the expected CAGR for the global MDO-PE films market over several semi-annual periods spanning from 2025 to 2035. In the first half (H1) of the decade from 2024 to 2034, the business is predicted to surge at a CAGR of 4.6%, followed by a low growth rate of 4.4% in the second half (H2) of the same decade.
| Particular | Value CAGR |
|---|---|
| H1(2024 to 2034) | 4.6% |
| H2(2024 to 2034) | 4.4% |
| H1(2025 to 2035) | 5.5% |
| H2(2025 to 2035) | 3.6% |
Moving into the subsequent period, from H1 2024 to H2 2035, the CAGR is projected to increase to 5.5% in the first half and decrease to 3.6% in the second half. In the first half (H1) the market witnessed an increase of 90 BPS while in the second half (H2), the market witnessed a decrease of 80 BPS.
The market is segmented based on packaging format, manufacturing process, material, end use, and region. By packaging format, the market includes pouches, bags & sacks, tubes, liners and lidding films, sachets & stick packs, tapes & labels, and wraps/rolls. In terms of manufacturing process, the market is categorized into cast films and blown films.
Based on material, it is segmented into high-density polyethylene (HDPE), low-density polyethylene (LDPE), and linear-low density polyethylene (LLDPE). By end use, the market is classified into food, hygiene, beverages, homecare, personal care, healthcare, and electronics & electricals. Regionally, the market covers North America, Latin America, East Asia, South Asia & Pacific, Eastern Europe, Western Europe, and the Middle East & Africa.
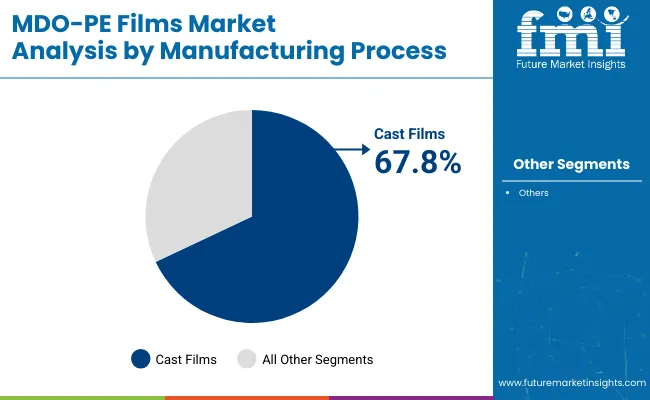
| Manufacturing Process Segment | Market Share (2025) |
|---|---|
| Cast Films | 67.8% |
Cast films are expected to account for the largest share of 67.8% in 2025 within the MDO-PE films market, driven by their superior clarity, sealability, and consistency. Unlike blown films, cast films offer better gauge control and optical properties, making them ideal for high-performance packaging in food, pharmaceuticals, and hygiene applications. Their smoother surfaces and uniform thickness allow for enhanced printability and barrier integration critical for aesthetic and protective packaging solutions.
Food packaging manufacturers particularly favor cast films for applications in snack packs, frozen meals, and pouch laminates due to the formability and sealing strength they provide. The process also enables higher production speeds, improving operational efficiency and output capacity. As a result, cost per unit is reduced, further strengthening their adoption in cost-sensitive sectors.
Sustainability also plays a key role in driving demand. Cast films are increasingly compatible with mono-material recycling goals and eco-friendly formulations. Leading players such as Amcor and Mondi are investing in cast film extrusion lines to support circular packaging formats and reduce carbon emissions.
The combination of performance, production efficiency, and recyclability positions cast films as the most sought-after manufacturing process in the evolving MDO-PE films landscape.
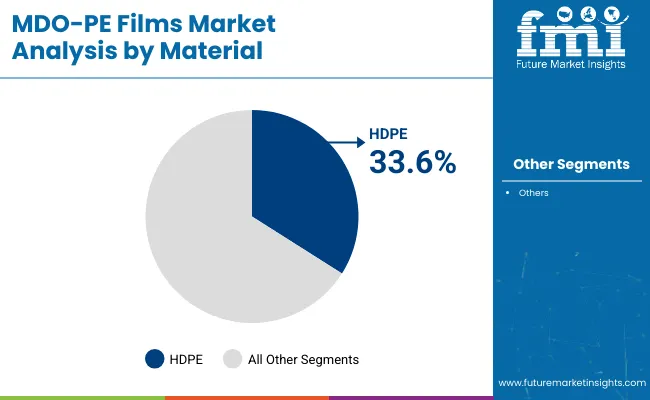
| Material Segment | Market Share (2025) |
|---|---|
| HDPE | 33.6% |
High-density polyethylene (HDPE) is projected to dominate the MDO-PE films market by material, capturing a significant 33.6% market share in 2025. HDPE stands out due to its superior strength, rigidity, and exceptional resistance to chemicals and moisture attributes critical to applications in food, healthcare, and hygiene packaging.
In pharmaceutical and laboratory settings, HDPE-based films are extensively used for labeling specimen containers, diagnostic kits, and reagent bottles, ensuring labels remain intact even under sterilization, refrigeration, or exposure to harsh substances. The popularity of HDPE in food packaging stems from its barrier properties, which extend shelf life and enhance safety for products like frozen foods and snacks. Leading producers such as SABIC, ExxonMobil, and Borealis are continuously innovating high-performance HDPE grades to meet stringent regulatory standards for both medical and food-grade applications.
These advancements also support recyclability and integration into circular economy initiatives, addressing sustainability concerns while maintaining performance. HDPE’s compatibility with both cast and blown film manufacturing processes further boosts its versatility in multilayer packaging formats. Additionally, its lower cost relative to specialty polymers makes it an attractive choice for manufacturers seeking a balance of performance, compliance, and cost efficiency in large-scale production.
| Packaging Format Segment | CAGR (2025 to 2035) |
|---|---|
| Pouches | 4.41% |
Pouches are expected to grow at the highest CAGR of 4.41% from 2025 to 2035 among all packaging formats in the MDO-PE films market. Their popularity stems from superior flexibility, lightweight design, and reduced material usage compared to rigid formats.
Pouches are widely used across food, personal care, and pharmaceutical products due to their sealability, tamper-evidence, and excellent printability. MDO-PE films enable pouches to offer high mechanical strength and clarity while ensuring cost-effective and sustainable packaging. Leading players like Berry Global and Amcor are innovating high-barrier MDO-PE films tailored for retort and vacuum packaging formats. These films enhance pouch performance in heat-sealing, moisture protection, and shelf visibility.
The rise in e-commerce and on-the-go consumption is further accelerating the adoption of stand-up and spouted pouch formats, especially in snacks, sauces, and pet food. Moreover, regulations pushing for recyclable and mono-material packaging are favoring MDO-PE-based pouch structures.
As converters seek to replace multilayer laminates with single-material alternatives, MDO-PE pouches offer both functionality and sustainability. Their compatibility with digital printing also supports small-batch customization and branding, which adds further traction among premium and startup brands.
| End Use Segment | CAGR (2025 to 2035) |
|---|---|
| Healthcare | 3.57% |
The healthcare segment is projected to register the highest CAGR of 3.57% from 2025 to 2035 in the MDO-PE films market, driven by stringent requirements for sterility, safety, and traceability. MDO-PE films are widely used in the packaging of diagnostic kits, pharmaceuticals, surgical tools, and IV bags due to their clarity, durability, and excellent printability.
Their resistance to chemicals, sterilization processes, and mechanical stress makes them ideal for medical packaging applications. Regulatory compliance with FDA, EMA, and ISO standards ensures that MDO-PE films meet the critical demands of medical-grade packaging. The segment’s growth is further bolstered by rising global healthcare expenditure, increased demand for at-home diagnostics, and the expansion of biopharmaceutical cold chain logistics.
Companies such as Sealed Air and Coveris are focusing on MDO-PE innovations that deliver peelable seals, puncture resistance, and anti-contamination features for sterile barrier packaging. Additionally, growing emphasis on recyclable medical packaging is fueling adoption of mono-material MDO-PE films over traditional multilayer options.
As the healthcare sector continues digitizing and expanding into remote care and personalized medicine, demand for reliable and sustainable medical packaging formats is expected to rise steadily, securing the healthcare segment’s position as a high-growth area.
Consumer Demand for Convenience Fuels Growth in Flexible Food Packaging
The key driver for this trend to adopt the flexible packaging formats like pouches, sachets, and stick packs is mainly driven by the convenience and portability requirement of consumers, particularly for food and beverage products. Busy lifestyles combined with an increasing demand for a consumer product that is consumable on-the-go make packaging one that carries and consumes a product easily.
Third, pouches are light-weight and compact and available with the option of reclosable seal. These are suitable for snack, ready-to-eat meal, or beverage products. Also, sachets and stick packs have been developed for one serving, which motivates the consumers to the better convenience of easy opening for their favorite products.
Apart from the convenience of portability, these formats ensure that the product is fresh and protected, but more than anything else, they also provide barrier properties that help in sustaining food quality over time. There exists an ever-increasing consumer interest in consuming food and beverages on the go.
Because of this reason, pouches and all other formats which are in its likeness will continue to rise up in demand. In the next times, probably it will build more flexible solutions for packaging.
Rising Demand for Shelf-Stable Food Drives Innovation in Packaging Solutions
Consumer demand for shelf-stable products, mainly in the food and beverage segments, has sharply increased and necessitated the rise in the use of packaging formats such as liners, wraps, and films. Consumers now demand longer-lasting products that do not require refrigeration before they can be consumed; hence packaging solutions that enhance product protection are critical.
High-barrier packaging films and wraps are in sore need in markets such as meat, poultry, dairy, and ready-to-eat meals. This is because such materials will protect the contents from moisture and oxygen as well as contaminants, thus diminishing spoilage and thereby increasing shelf life. Shrink packaging saves on ease of storing and transporting; this reduces waste, which is easier on consumers and manufacturers alike.
With this, food products-easy-to-use, long-lasting and safe-will continue to dominate markets, only now they will be allied with demand for innovative, non-refrigerated packagings that preserve the health of the product.
Eco-Friendly Alternatives Challenge Traditional Polyethylene Packaging in Consumer Markets
New and sustainable packaging formats are directly challenging the traditional polyethylene-based packaging formats, such as tubes, bags, and sacks, due to compostable or reusable bags, boxes, and biodegradable materials. Consumer pressure and growing awareness of businesses about ecological concerns put demand for green and eco-friendly options in verticals like personal care and food products.
Today, many consumers are looking for sustainable brands. This has shifted the trend of adoption of packaging solutions that are reducing plastic packaging waste and seeking either recyclability or reuse. Compostables present a way to reduce impact through biodegradation. Reusable bags and boxes ensure lesser usage of single-use plastic.
This emerging preference for environmentally-friendly alternatives is pushing manufacturers to innovate and introduce greener packaging alternatives. In such a scenario, the companies based on conventional polyethylene-based packaging face higher competition from such eco-friendly alternatives that might constrain long-term market growth.
Tier 1 company leaders are distinguished by their extensive portfolio and use of advanced production technology. These market leaders are stand out because of their extensive expertise in manufacturing and reconditioning across multiple packaging formats and a broad geographical reach, underpinned by a robust consumer base.
They offer a wide range of series including reconditioning, recycling, and manufacturing utilizing the latest technology and meeting the regulatory standards providing the highest quality. Prominent companies within Tier 1 include Coveris Holdings Inc, Avery Dennison Corporation, Klockner Pentaplast Group, RKW Group.
Tier 2 companies are defined by a strong presence overseas and in-depth market knowledge. These market players have good technology and ensure regulatory compliance but may not have advanced technology and wide global reach. Prominent companies in Tier 2 include Saes Coated Films S.P.A, Lenzing Plastics GmbH & Co KG, Nowofol, Camvac Limited, Plasbel Plásticos S.A.U., Novel Packaging Inc, Polysack Flexible Packaging Ltd, Polythene UK Ltd, Longdapac.
Tier 3 includes the majority of small-scale companies operating at the local presence and serving niche markets. These companies are notably oriented towards fulfilling local market demands and are consequently classified within the tier 3 share segment.
They are small-scale players and have limited geographical reach. Tier 3, within this context, is recognized as an unorganized market, denoting a sector characterized by a lack of extensive structure and formalization when compared to organized competitors.
The section below covers the industry analysis for the MDO-PE films market for different countries. Market demand analysis on key countries in several regions of the globe, including North America, Asia Pacific, Europe, and others, is provided. USA is anticipated to remain at the forefront in North America, with a CAGR of 3.5% through 2035. In South Asia & Pacific, India is projected to witness a CAGR of 6.1% by 2035.
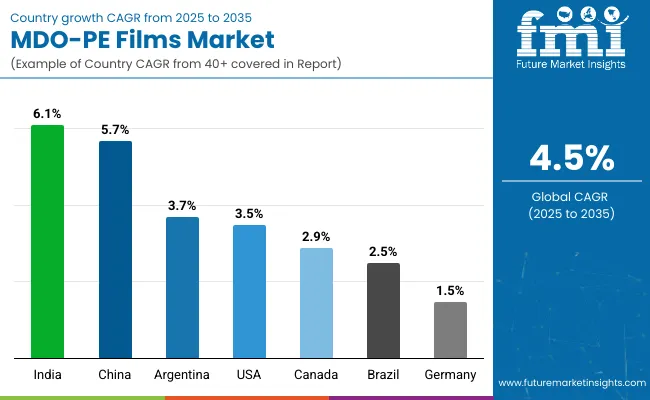
| Countries | Value CAGR (2025 to 2035) |
|---|---|
| USA | 3.5% |
| Canada | 2.9% |
| Brazil | 2.5% |
| Argentina | 3.7% |
| Germany | 1.5% |
| China | 5.7% |
| India | 6.1% |
This growing demand for sustainable and innovation-based packaging solutions in the read-to-eat meal segment has been one of the major drivers for this market in the food sector of the USA. Food manufacturers are seeking MDO-PE films due to the increasing demand from consumers for easy and shelf-stable meal options, providing optimal barrier properties to ensure freshness and extended shelf life without refrigeration.
More and more films are being used in packaging microwaveable meals, frozen foods, and meal kits because they are easy to use, strong, and flexible. Also, MDO-PE films have excellent sealing properties, so they are excellent for food products that require tamper-evident packaging. As the wave of sustainability gains even more ground, food manufacturers within the USA embrace recyclable MDO-PE films.
They do this primarily because this happens to be an answer to a demand that most consumers make from the industry that greener packaging is necessary. This shift to more sustainable convenient packaging by food manufacturers accounts for the most dramatic growth in market share of MDO-PE films.
One of the driving forces for MDO-PE films in Germany is the packaging demand in the organic and plant-based food market. Consumers, especially, have grown to make more health-conscious choices, but sustainability and ecological living are on top of this. Plant-based meat alternatives, dairy-free food items, and organic snacks, therefore, gain fast-growing market share.
The highest-performance properties MDO-PE films offer are in barrier systems that prevent moisture and oxygen from promoting spoilage and lowering the overall quality of plant-based and organic foods. Additionally, these films can maintain product integrity while being very lightweight and flexible, making them suitable for packaging different types of formats, including pouches, stand-up bags, and wraps.
Moreover, due to Germany's increasingly stringent environmental conditions and consumer desires for sustainable packagings, MDO-PE films offer the benefits of recyclability coupled with lower environmentally damaging effects of traditional plastic-based films. For this reason and more, organic food is attracting a growing requirement for MDO-PE in Germany.
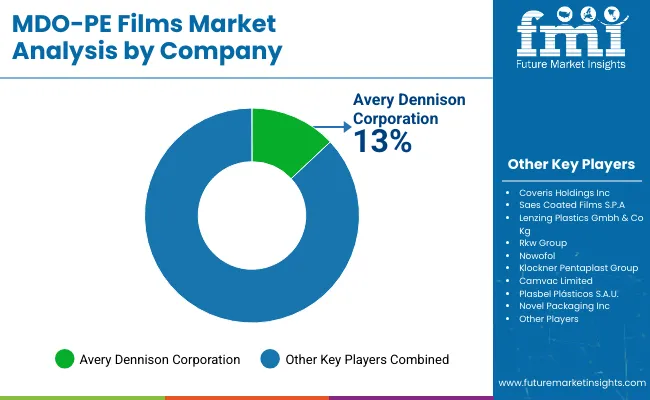
Key players operating in the MDO-PE films market are investing in the development of innovative sustainable solutions and also entering into partnerships. Key MDO-PE films providers have also been acquiring smaller players to grow their presence to further penetrate the MDO-PE films market across multiple regions
In terms of packaging format, the industry is divided into pouches, bags & sacks, tubes, liners and lidding films, sachets & stick packs, tapes & labels, wraps/rolls.
In terms of manufacturing process, the industry is segregated into cast films and blown films.
By material, the market is divided into high-density polyethylene (HDPE), low-density polyethylene (LDPE), linear-low density polyethylene (LLDPE).
The market is classified by end use such as food, hygiene, beverages, homecare, personal care, healthcare, electronics & electricals.
Key countries of North America, Latin America, East Asia, South Asia & Pacific, Western Europe, Eastern Europe, and the Middle East & Africa have been covered in the report.
The MDO-PE films market is expected to grow from USD 844.2 million in 2025 to USD 1,310.9 million by 2035.
The market is projected to expand at a compound annual growth rate (CAGR) of 4.5% during the forecast period.
Cast films are expected to dominate with a market share of 67.8% in 2025, due to superior clarity, sealability, and process efficiency.
High-density polyethylene (HDPE) is projected to lead the material segment with a 33.6% share in 2025.
The healthcare segment is projected to grow at the highest CAGR of 3.57% from 2025 to 2035, owing to rising demand for sterile and high-barrier medical packaging.


Our Research Products

The "Full Research Suite" delivers actionable market intel, deep dives on markets or technologies, so clients act faster, cut risk, and unlock growth.

The Leaderboard benchmarks and ranks top vendors, classifying them as Established Leaders, Leading Challengers, or Disruptors & Challengers.

Locates where complements amplify value and substitutes erode it, forecasting net impact by horizon

We deliver granular, decision-grade intel: market sizing, 5-year forecasts, pricing, adoption, usage, revenue, and operational KPIs—plus competitor tracking, regulation, and value chains—across 60 countries broadly.

Spot the shifts before they hit your P&L. We track inflection points, adoption curves, pricing moves, and ecosystem plays to show where demand is heading, why it is changing, and what to do next across high-growth markets and disruptive tech

Real-time reads of user behavior. We track shifting priorities, perceptions of today’s and next-gen services, and provider experience, then pace how fast tech moves from trial to adoption, blending buyer, consumer, and channel inputs with social signals (#WhySwitch, #UX).

Partner with our analyst team to build a custom report designed around your business priorities. From analysing market trends to assessing competitors or crafting bespoke datasets, we tailor insights to your needs.
Supplier Intelligence
Discovery & Profiling
Capacity & Footprint
Performance & Risk
Compliance & Governance
Commercial Readiness
Who Supplies Whom
Scorecards & Shortlists
Playbooks & Docs
Category Intelligence
Definition & Scope
Demand & Use Cases
Cost Drivers
Market Structure
Supply Chain Map
Trade & Policy
Operating Norms
Deliverables
Buyer Intelligence
Account Basics
Spend & Scope
Procurement Model
Vendor Requirements
Terms & Policies
Entry Strategy
Pain Points & Triggers
Outputs
Pricing Analysis
Benchmarks
Trends
Should-Cost
Indexation
Landed Cost
Commercial Terms
Deliverables
Brand Analysis
Positioning & Value Prop
Share & Presence
Customer Evidence
Go-to-Market
Digital & Reputation
Compliance & Trust
KPIs & Gaps
Outputs
Full Research Suite comprises of:
Market outlook & trends analysis
Interviews & case studies
Strategic recommendations
Vendor profiles & capabilities analysis
5-year forecasts
8 regions and 60+ country-level data splits
Market segment data splits
12 months of continuous data updates
DELIVERED AS:
PDF EXCEL ONLINE
TPE Films and Sheets Market Size and Share Forecast Outlook 2025 to 2035
Breaking Down PCR Films Market Share & Industry Positioning
PCR Films Market Analysis by PET, PS, PVC Through 2035
LDPE Films Market
Card Films Market
Mulch Films Market Size and Share Forecast Outlook 2025 to 2035
Nylon Films for Liquid Packaging Market from 2024 to 2034
Vinyl Films Market
Edible Films and Coatings Market Growth - Trends & Forecast 2025 to 2035
Market Share Breakdown of Edible Films and Coatings
Retort Films Market
Tobacco Films Market Size and Share Forecast Outlook 2025 to 2035
Gelatin Films Market Size and Share Forecast Outlook 2025 to 2035
Lidding Films Market Size and Share Forecast Outlook 2025 to 2035
Optical Films Market Size and Share Forecast Outlook 2025 to 2035
Stretch Films Market Outlook - Size, Demand & Industry Trends 2025 to 2035
Protein Films Market from 2024 to 2034
PE Foam Films Market
Sealant Films Market
Formable Films Market Size and Share Forecast Outlook 2025 to 2035

Thank you!
You will receive an email from our Business Development Manager. Please be sure to check your SPAM/JUNK folder too.
Chat With
MaRIA