Reports

- Global Locations -

Headquarters

Future Market Insights, Inc.

Christiana Corporate, 200
Continental Drive, Suite 401,
Newark, Delaware - 19713,
United States

T: +1-845-579-5705

Americas

Future Market Insights, Inc.

616 Corporate Way, Suite 2-9018,
Valley Cottage, NY 10989, United States

T: +1-347-918-3531

MEA

Future Market Insights

1602-6 Jumeirah Bay X2 Tower, Plot No: JLT-PH2-X2A,
Jumeirah Lakes Towers, Dubai,
United Arab Emirates

Europe

Future Market Insights

3rd Floor, 207 Regent Street,
W1B 3HH London
United Kingdom

T: + 44 (0) 20 8123 9659
D: +44 (0) 20 3287 4268

Asia Pacific

Future Market Insights

IndiaLand Global Tech Park, Unit UG-1, Behind Grand HighStreet, Phase 1, Hinjawadi, MH, Pune – 411057, India

High Barrier Packaging Films Market Outlook (2023 to 2033)

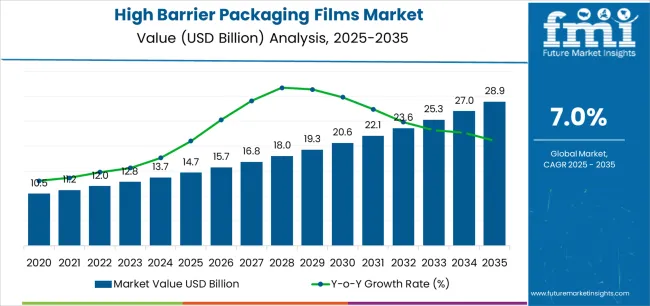
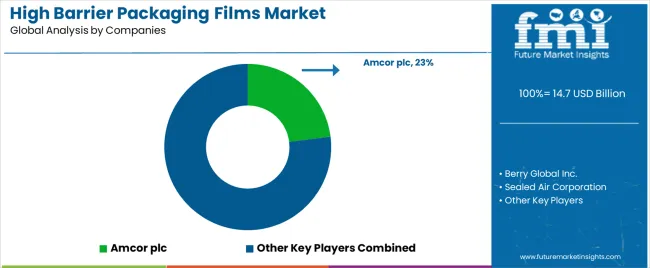
The global high barrier packaging films market is expected to surpass US$ 18.5 billion in 2023, and is likely to witness a moderate CAGR of 3.9% in the estimated time frame (2023 to 2033). The market is projected to be valued at US$ 33.6 billion by 2033. Sales of high barrier packaging films are likely to skyrocket amid surging demand for processed food items, thereby enabling top 5 manufacturers to hold around 29% of the global market share in 2023.

Burgeoning demand for meat across the globe is anticipated to drive sales of high-performing films made of polyethylene. These films are considered to be suitable for meat, poultry, and fish packaging as they are heat resistant, durable, and have an excellent oxygen barrier.

Pharmaceutical companies are also anticipated to propel demand for numerous packaging solutions that can provide cost-effectiveness, insulation from external surroundings, ease of handling, and high levels of protection. Blister base high packaging films are expected to be mainly used by these companies as they do not allow for the exchange of gases in the packaging.

As per Future Market Insights, by film type, organic coating films are projected to remain at the forefront and create an incremental opportunity of US$ 3.6 billion from 2023 to 2033. High barrier packaging films are expected to hold around 9% of the global packaging films market, which is expected to be worth US$ 209.7 billion in 2023.

The global market for high barrier packaging films generated a revenue of about US$ 17.6 billion in 2022. With propelling demand from the food & beverage industry, the market for high barrier packaging films is projected to expand 1.9x during the forecast period.

The market for high barrier packaging films is estimated to create an absolute dollar opportunity of US$ 9.9 billion between 2023 and 2033. Significantly rising demand for processed & ready-to-eat packaged food items and high focus of consumers toward buying hygienic & quality products would spur demand for high barrier packaging films.

Attributes Key Insights
High Barrier Packaging Films Market Estimated Size (2023E) US$ 18.5 billion
Projected Market Valuation (2033F) US$ 33.6 billion
Value-based CAGR (2023 to 2033) 3.9%
Collective Value Share: Top 3 Countries (2023E) 40% to 45%

Don't pay for what you don't need

Customize your report by selecting specific countries or regions and save 30%!

2015 to 2022 High Barrier Packaging Films Market Outlook Compared to 2023 to 2033 Demand Forecast

The global high barrier packaging films market witnessed a CAGR of 4.9% during the historical period between 2015 and 2022. The market stood at a valuation of US$ 12.5 billion in 2015 and reached around US$ 17.5 billion in 2022.

High barrier packaging films play a significant role in enhancing the shelf life of products as they provide excellent barrier properties such as moisture and preserve the aroma of food. High barrier packaging films demand is increasing as they enhance food quality, ensure food safety, extend the shelf life of products, convenient to use, and cost-effective.

They are used in various industries such as food & beverage, pharmaceutical, healthcare, and retail. High barrier packaging films are set to be an integral part of the supply chain in healthcare and food industries. Pharmaceutical industry has a unique requirement for packaging in terms of insulation from the outside environment. Hence, high barrier packaging films sales are anticipated to witness significant growth during the forecast period.

Comparative View of Adjacent High Barrier Packaging Films Market

High Barrier Packaging Films Market:

Attributes High Barrier Packaging Films Market
CAGR (2022 to 2032) 3.9%
Market Value (2023) US$ 18.5 billion
Growth Factor Ability of high barrier packaging films to prevent moisture, carbon dioxide, and oxygen to enter in food items would drive sales.
Key Trend Increasing demand for processed and packaged food items among working professionals would aid demand.

Packaging Barrier Films Market:

Attributes Packaging Barrier Films Market
CAGR (2022 to 2030) 3.4%
Market Value (2022) US$ 20.2 billion
Growth Factor Increasing use of collation shrink films based on low density polyethylene for food packaging application would fuel sales.
Key Trend Key players are projected to come up with transparent high barrier packaging films to provide barrier to oxygen, aroma, and oils.

Silicone Release Films Market:

Attributes Silicone Release Films Market
CAGR (2022 to 2032) 6.1%
Market Value (2022) US$ 9.12 billion
Growth Factor Increasing use of silicone release films for applications such as hologram, tapes, and labels would bode well for the industry.
Key Trend Leading silicone release films manufacturers are investing in reducing fossil-free silicone and platinum coating in the production of these films.
Ismail Sutaria
Ismail Sutaria

Principal Consultant

Talk to Analyst

Find your sweet spots for generating winning opportunities in this market.

Top Trends Pushing High Barrier Packaging Films Demand Worldwide

  • Need for Transparent High Barrier Thermoforming Films to Boom among Fruit and Vegetable Vendors

In food & beverage products, see-through and transparent packaging makes a broad impact. High barrier packaging films are manufactured by using functional materials that maintain the quality of food, as well as its aroma, taste, and texture. High barrier packaging films are extensively used to package food items such as dairy products, fruits, and vegetables.

Due to excellent oxygen barrier, durability, lightweight nature, and heat resistance of high barrier packaging films, their demand is projected to catapult throughout the assessment period. High meat consumption worldwide is another vital factor that would boost sales in the market.

Packaged food providers prefer transparent high barrier films to help consumers better understand about the content present inside the packaging to make a purchase decision. They are striving to provide fresh products. High visibility and aesthetic appeal are a couple of attributes preferred by modern consumers. Transparent barrier films are hence expected to continue to showcase steady growth during the forecast period.

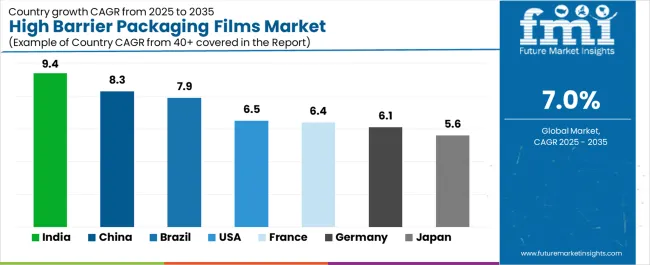
Country-wise Insights

Country USA
Market Share (2023) 11.9%
Market Share (2033) 10.9%
Basis Points (BPS) Analysis -110.0
Country Germany
Market Share (2023) 4.3%
Market Share (2033) 3.7%
Basis Points (BPS) Analysis -60.0
Country United Kingdom
Market Share (2023) 8.1%
Market Share (2033) 8.5%
Basis Points (BPS) Analysis 30.0
Country China
Market Share (2023) 3.2%
Market Share (2033) 3.2%
Basis Points (BPS) Analysis 10.0
Country India
Market Share (2023) 6.5%
Market Share (2033) 8.7%
Basis Points (BPS) Analysis 220.0

Why are Sales of High Barrier Packaging Films Booming across the United Kingdom?

Launch of Plastic Packaging Tax in the United Kingdom to Fuel Demand for High Barrier Food Packaging

The United Kingdom is set to be one of the leading manufacturers of high barrier films, as well as a prominent importer of organic coating films, which makes the country one of the global leaders in the high barrier packaging films industry. Rising demand for packaged and processed food products is projected to drive the market.

Rapid expansion of ready-to-eat meals services in the country will also bolster growth in the market. Several food & beverage companies in the United Kingdom are adopting sustainable packaging strategies by using less base plastic material and energy during production.

The United Kingdom government, on a mission to find out a way to reduce the use of commercial plastics, introduced a Plastic Packaging Tax in April 2022. This tax aims to provide a clear economy for businesses to use recycled plastic in the field of plastic film packaging. Due to this tax, numerous manufacturers are collaborating with eco-friendly material providers to develop new innovative packaging solutions.

How are High Barrier Packaging Films Manufacturers Escalating Sales in the USA?

Spurring Demand for Non-Durable Goods in the USA to Drive High Barrier Packaging Sales

High barrier packaging films are set to showcase excessive demand due to increasing consumption of packaged food items among the USA population. According to the Plastic Industry Organization, total plastic product consumption was 83.5% in 2020, in which, around 29.4% was used in the packaging of non-durable goods. Total plastic industry shipment in 2020 was US$ 394.7 billion. Demand for plastic in the USA is expected to surge rapidly, and it is further anticipated to boost high barrier packaging film sales.

Get the data you need at a Fraction of the cost

Personalize your report by choosing insights you need
and save 40%!

Category-wise Insights

Which is the Highly Preferred Material for Producing High Barrier Packaging Films?

Use of Plastic High Barrier Packaging to Skyrocket among Medical Device Manufacturers

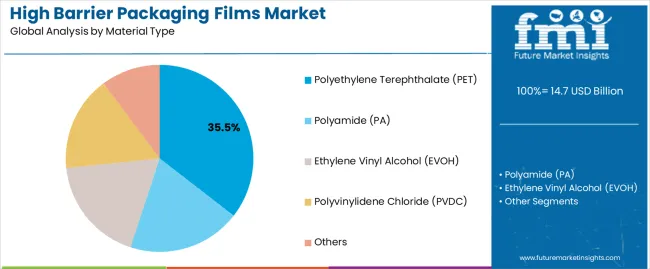
Plastic high barrier packaging films are set to be the most preferred material type. The segment is expected to reach a valuation of US$ 24.3 billion by 2033, says Future Market Insights. Growth is attributed to their cost-effective, lightweight, transparent, and durable nature.

They are mainly used to protect food products by retaining the food quality and its freshness. Plastic high barrier packaging films are extensively used to package medical devices as they have sharp edges, requiring a shield of protection. Demand for plastic high barrier films is hence set to increase at a CAGR of 6.4% during the forecast period.

Which End User Would Create Lucrative Growth Opportunities for High Barrier Packaging Films Companies?

High Demand for Processed Food Items to Boost Sales of Barrier Packaging Films

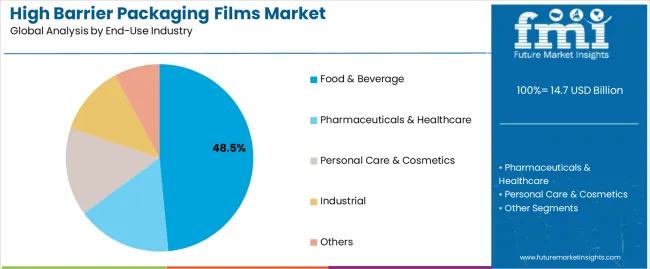
Increasing preference for processed and convenient packaged foods is projected to drive the food segment in terms of end user during the assessment period. The segment is expected to hold around 75% of the global high barrier packaging films market share.

Due to rising demand for prepared foods and microwave ovens, the high barrier packaging films industry is expanding at a rapid pace. Foods that have been processed begin to lose quality when moisture, chemicals, and environmental factors are involved. Shelf life of these food items can be increased while maintaining their freshness by using high barrier packaging films that maintain the taste and aroma of food products.

Competitive Landscape

Key players in the high barrier packaging films industry are aiming to boost their sales and revenues by introducing new capacities to satisfy the surging demand. Few of the leading players are attempting to implement a merger and acquisition strategy to increase their resources. They are also developing new products to satisfy high consumer demand. In order to meet this demand, these players are focusing on improving their manufacturing facilities.

For instance:

  • In December 2022, Amcor plc., a global leader in providing packaging solutions, developed China’s largest flexible packaging plant to strengthen its position and meet the accelerating demand for flexible packaging solutions in Asia Pacific.
  • In June 2022, Winpack Ltd., a manufacturer and supplier of high-quality packaging materials, received an International Sustainability and Carbon Certification (ISCC) award for use of recycled content in its products.
  • In March 2022, Cosmo Films Limited expanded its production line at Aurangabad, India with an annual rated capacity of 25,000 MT.

Scope of the Report

Attribute Details
Estimated Market Size (2023) US$ 18.5 billion
Projected Market Valuation (2033) US$ 33.6 billion
Value-based CAGR (2023 to 2033) 3.9%
Historical Data 2015 to 2022
Forecast Period 2023 to 2033
Market Analysis Value (US$ billion) and volume (tons)
Segments Covered
  • Film Type
  • Material Type
  • Packaging Type
  • End User
  • Region
Regions Covered
  • North America
  • Latin America
  • East Asia
  • South Asia & Pacific
  • Western Europe
  • Eastern Europe
  • Central Asia
  • Russia & Belarus
  • Balkan Countries
  • Baltic Countries
  • Middle East and Africa
Key Countries Covered
  • USA
  • Canada
  • Brazil
  • Mexico
  • Argentina
  • South Korea
  • China
  • Japan
  • India
  • ASEAN
  • Australia & New Zealand
  • Germany
  • France
  • Spain
  • Italy
  • BENELUX
  • Nordics
  • United Kingdom
  • Poland
  • Hungary
  • Romania
  • Czech Republic
  • Others
  • Gulf Cooperation Council Countries
  • Türkiye
  • Northern Africa
  • South Africa
  • Israel
  • Saudi Arabia
Key Companies Profiled
  • Amcor Plc
  • Sealed Air Corp
  • Glenroy, Inc.
  • Winpak Ltd.
  • Mondi Plc
  • Toray Plastics (America), Inc.
  • Berry Global, Inc.
  • Schur Flexibles GmbH
  • Huhtamaki Oyj
  • Jindal Poly Films Ltd.
  • Uflex Ltd.
  • Cosmo Films Ltd.
  • Bischof & Klein SE & Co. KG
  • Plastissimo Film Co., Ltd.
  • Celplast Metallized Products Ltd.
  • Dunmore Corporation
  • ProAmpac Intermediate, Inc.
  • Polyplex Corporation Limited
  • Shrinath Rotopack Pvt. Ltd.
  • ACG Worldwide Private Limited
Report Coverage Revenue Forecast, Volume Forecast, Company Ranking, Competitive Landscape, Growth Factors, Trends, and Pricing Analysis

High Barrier Packaging Films Market Outlook by Category

By Film Type:

  • Metalized Films
  • Clear Films
  • Organic Coating Films
  • Inorganic Oxide Coating Films

By Material Type:

  • Plastic
    • Polyethylene (PE)
    • Polypropylene (PP)
    • Ethylene Vinyl Alcohol (EVOH)
    • Polyethylene Terephthalate (PET)
    • Polyvinylidene Chloride (PVDC)
    • Polyamide (Nylon)
    • Polyethylene Naphthalate (PEN)
    • Others
  • Aluminium
  • Oxides
    • Aluminium Oxide
    • Silicon Oxide
  • Others

By Packaging Type:

  • Pouches
  • Bags
  • Lids
  • Shrink Films
  • Laminated Tubes
  • Others

By End User:

  • Food
    • Meat, Seafood, and Poultry
    • Baby Food
    • Snacks
    • Bakery and Confectionery
    • Pet Food
    • Dairy Food
    • Ready to Eat Meals
    • Other Food
  • Beverages
    • Alcoholic Beverages
    • Non Alcoholic Beverages
  • Pharmaceuticals
  • Electronic Devices
  • Medical Devices
  • Agriculture
  • Chemicals
  • Others

By Region:

  • North America
  • Latin America
  • East Asia
  • South Asia & Pacific
  • Western Europe
  • Eastern Europe
  • Central Asia
  • Russia & Belarus
  • Balkan Countries
  • Baltic Countries
  • Middle East and Africa

Frequently Asked Questions

What is the High Barrier Film Packaging Market Size?

The high-barrier film packaging market is estimated to capture a valuation of US$ 18.5 billion in 2023.

Which Marketing Strategies Are Adopted in the High Barrier Film Packaging Market?

High visibility and transparent packaging are the key marketing strategies.

What will be the Valuation of the Video Game Market by 2033?

The market is estimated to secure a valuation of US$ 33.6 billion by 2033.

What are the Trends in the High Barrier Film Packaging Market?

The increasing demand for packaged and processed food is the current market trend.

Which Material Type Holds Lucrative Opportunities?

Plastic holds a lucrative opportunity in the global market.

Table of Content

1. Executive Summary | High Barrier Packaging Films Market

    1.1. Global Market Outlook

    1.2. Demand–side Trends

    1.3. Supply–side Trends

    1.4. Technology Roadmap Analysis

    1.5. Analysis and Recommendations

2. Market Overview

    2.1. Market Coverage / Taxonomy

    2.2. Market Definition / Scope / Limitations

3. Market Background

    3.1. Market Dynamics

        3.1.1. Drivers

        3.1.2. Restraints

        3.1.3. Opportunity

        3.1.4. Trends

    3.2. Cased-based Scenario

        3.2.1. Demand in Optimistic Scenario

        3.2.2. Demand in Likely Scenario

        3.2.3. Demand in Conservative Scenario

    3.3. Macro Factors and Forecast Factors

    3.4. Value Chain Analysis

        3.4.1. Profit Margin Analysis

        3.4.2. Raw Material Suppliers

        3.4.3. Manufacturers, Wholesalers and Distributors

        3.4.4. End–user/ Customers

    3.5. Regional Parent Market Outlook

    3.6. Production and Consumption Statistics

    3.7. Global Average Pricing Analysis Benchmark

4. Global Market Analysis 2015 to 2022 and Forecast 2023 to 2033

    4.1. Historical Market Size Value (US$ billion) & Volume (tons) Analysis, 2015 to 2022

    4.2. Current and Future Market Size Value (US$ billion) & Volume (tons) Projections, 2023 to 2033

        4.2.1. Y–o–Y Growth Trend Analysis

        4.2.2. Absolute $ Opportunity Analysis

5. Global Market Analysis 2015 to 2022 and Forecast 2023 to 2033, by Film Type 

    5.1. Introduction / Key Findings

    5.2. Historical Market Size Value (US$ billion) & Volume (tons) Analysis by Film Type, 2015 to 2022

    5.3. Current and Future Market Size Value (US$ billion) & Volume (tons) Analysis and Forecast by Film Type, 2023 to 2033

        5.3.1. Metalized Films

        5.3.2. Clear Films

        5.3.3. Organic Coating Films

        5.3.4. Inorganic Oxide Coating Films

    5.4. Y–o–Y Growth Trend Analysis by Film Type, 2015 to 2022

    5.5. Absolute $ Opportunity Analysis by Film Type, 2023 to 2033

6. Global Market Analysis 2015 to 2022 and Forecast 2023 to 2033, by Material

    6.1. Introduction / Key Findings

    6.2. Historical Market Size Value (US$ billion) & Volume (tons) Analysis by Material, 2015 to 2022

    6.3. Current and Future Market Size Value (US$ billion) & Volume (tons) Analysis and Forecast by Material, 2023 to 2033

        6.3.1. Plastic

            6.3.1.1. Polyethylene (PE)

            6.3.1.2. Polypropylene (PP)

            6.3.1.3. Ethylene Vinyl Alcohol (EVOH)

            6.3.1.4. Polyethylene Terephthalate (PET)

            6.3.1.5. Polyvinylidene Chloride (PVDC)

            6.3.1.6. Polyamide (Nylon)

            6.3.1.7. Polyethylene Naphthalate (PEN)

            6.3.1.8. Others (LCD, PS, PVC, PLA, PA)

        6.3.2. Aluminum

        6.3.3. Oxides

            6.3.3.1. Aluminum Oxide

            6.3.3.2. Silicon Oxide

        6.3.4. Others

    6.4. Y–o–Y Growth Trend Analysis by Material, 2015 to 2022

    6.5. Absolute $ Opportunity Analysis by Material, 2023 to 2033

7. Global Market Analysis 2015 to 2022 and Forecast 2023 to 2033, by Packaging Type

    7.1. Introduction / Key Findings

    7.2. Historical Market Size Value (US$ billion) & Volume (tons) Analysis by Packaging Type, 2015 to 2022

    7.3. Current and Future Market Size Value (US$ billion) & Volume (tons) Analysis and Forecast by Packaging Type, 2023 to 2033

        7.3.1. Pouches

        7.3.2. Bags

        7.3.3. Lids

        7.3.4. Shrink Films

        7.3.5. Laminated Tubes

        7.3.6. Others

    7.4. Y–o–Y Growth Trend Analysis by Packaging Type, 2015 to 2022

    7.5. Absolute $ Opportunity Analysis by Packaging Type, 2023 to 2033

8. Global Market Analysis 2015 to 2022 and Forecast 2023 to 2033, by End User

    8.1. Introduction / Key Findings

    8.2. Historical Market Size Value (US$ billion) & Volume (tons) Analysis by Packaging Type, 2015 to 2022

    8.3. Current and Future Market Size Value (US$ billion) & Volume (tons) Analysis and Forecast by Packaging Type, 2023 to 2033

        8.3.1. Food

            8.3.1.1. Middle East and Africat, Seafood, and Poultry

            8.3.1.2. Baby Food

            8.3.1.3. Snacks

            8.3.1.4. Bakery and Confectionery

            8.3.1.5. Pet Food

            8.3.1.6. Dairy Food

            8.3.1.7. Ready to Eat Middle East and Africals

            8.3.1.8. Other Food

        8.3.2. Beverages

            8.3.2.1. Alcoholic Beverages

            8.3.2.2. Non Alcoholic Beverages

        8.3.3. Pharmaceuticals

        8.3.4. Electronic Devices

        8.3.5. Medical Devices

        8.3.6. Agriculture

        8.3.7. Chemicals

        8.3.8. Others

    8.4. Y–o–Y Growth Trend Analysis by Packaging Type, 2015 to 2022

    8.5. Absolute $ Opportunity Analysis by Packaging Type, 2023 to 2033

9. Global Market Analysis 2015 to 2022 and Forecast 2023 to 2033, by Region

    9.1. Introduction / Key Findings

    9.2. Historical Market Size Value (US$ billion) & Volume (tons) Analysis by Region, 2015 to 2022

    9.3. Current and Future Market Size Value (US$ billion) & Volume (tons) Analysis and Forecast by Region, 2023 to 2033

        9.3.1. North America

        9.3.2. Latin America

        9.3.3. East Asia

        9.3.4. South Asia & Pacific

        9.3.5. Western Europe

        9.3.6. Eastern Europe

        9.3.7. Central Asia

        9.3.8. Russia & Belarus

        9.3.9. Balkan Countries

        9.3.10. Baltic Countries

        9.3.11. Middle East and Africa (Middle East and Africa)

    9.4. Market Attractiveness Analysis, by Region

10. North America Market Analysis 2015 to 2022 and Forecast 2023 to 2033, by Country

    10.1. Historical Market Size Value (US$ billion) & Volume (tons) Trend Analysis by Market Taxonomy, 2015 to 2022

    10.2. Market Size Value (US$ billion) & Volume (tons) Forecast by Market Taxonomy, 2023 to 2033

        10.2.1. by Country

            10.2.1.1. USA

            10.2.1.2. Canada

        10.2.2. by Film Type

        10.2.3. by Material

        10.2.4. by Packaging Type

        10.2.5. by End User

    10.3. Market Attractiveness Analysis

        10.3.1. by Country

        10.3.2. by Film Type

        10.3.3. by Material

        10.3.4. by Packaging Type

        10.3.5. by End User

    10.4. Key Takeaways

11. Latin America Market Analysis 2015 to 2022 and Forecast 2023 to 2033, by Country

    11.1. Historical Market Size Value (US$ billion) & Volume (tons) Trend Analysis by Market Taxonomy, 2015 to 2022

    11.2. Market Size Value (US$ billion) & Volume (tons) Forecast by Market Taxonomy, 2023 to 2033

        11.2.1.       by Country

            11.2.1.1. Brazil

            11.2.1.2. Mexico

            11.2.1.3. Argentina

            11.2.1.4. Rest of Latin America

        11.2.2. by Film Type

        11.2.3. by Material

        11.2.4. by Packaging Type

        11.2.5. by End User

    11.3. Market Attractiveness Analysis

        11.3.1. by Country

        11.3.2. by Film Type

        11.3.3. by Material

        11.3.4. by Packaging Type

        11.3.5. by End User

    11.4. Key Takeaways

12. East Asia Market Analysis 2015 to 2022 and Forecast 2023 to 2033, by Country

    12.1. Historical Market Size Value (US$ billion) & Volume (tons) Trend Analysis by Market Taxonomy, 2015 to 2022

    12.2. Market Size Value (US$ billion) & Volume (tons) Forecast by Market Taxonomy, 2023 to 2033

        12.2.1. by Country

            12.2.1.1. China

            12.2.1.2. Japan

            12.2.1.3. South Korea

        12.2.2. by Film Type

        12.2.3. by Material

        12.2.4. by Packaging Type

        12.2.5. by End User

    12.3. Market Attractiveness Analysis

        12.3.1. by Country

        12.3.2. by Film Type

        12.3.3. by Material

        12.3.4. by Packaging Type

        12.3.5. by End User

    12.4. Key Takeaways

13. South Asia & Pacific Market Analysis 2015 to 2022 and Forecast 2023 to 2033, by Country

    13.1. Historical Market Size Value (US$ billion) & Volume (tons) Trend Analysis by Market Taxonomy, 2015 to 2022

    13.2. Market Size Value (US$ billion) & Volume (tons) Forecast by Market Taxonomy, 2023 to 2033

        13.2.1. by Country

            13.2.1.1. India

            13.2.1.2. Association of Southeast Asian Nations

            13.2.1.3. Australia & New Zealand

        13.2.2. by Film Type

        13.2.3. by Material

        13.2.4. by Packaging Type

        13.2.5. by End User

    13.3. Market Attractiveness Analysis

        13.3.1. by Country

        13.3.2. by Film Type

        13.3.3. by Material

        13.3.4. by Packaging Type

        13.3.5. by End User

    13.4. Key Takeaways

14. Western Europe Market Analysis 2015 to 2022 and Forecast 2023 to 2033, by Country

    14.1. Historical Market Size Value (US$ billion) & Volume (tons) Trend Analysis by Market Taxonomy, 2015 to 2022

    14.2. Market Size Value (US$ billion) & Volume (tons) Forecast by Market Taxonomy, 2023 to 2033

        14.2.1. by Country

            14.2.1.1. Germany

            14.2.1.2. Italy

            14.2.1.3. France

            14.2.1.4. United Kingdom

            14.2.1.5. Spain

            14.2.1.6. BENELUX

            14.2.1.7. Nordic

            14.2.1.8. Rest of Europe

        14.2.2. by Film Type

        14.2.3. by Material

        14.2.4. by Packaging Type

        14.2.5. by End User

    14.3. Market Attractiveness Analysis

        14.3.1. by Country

        14.3.2. by Film Type

        14.3.3. by Material

        14.3.4. by Packaging Type

        14.3.5. by End User

    14.4. Key Takeaways

15. Eastern Europe Market Analysis 2015 to 2022 and Forecast 2023 to 2033, by Country

    15.1. Historical Market Size Value (US$ billion) & Volume (tons) Trend Analysis by Market Taxonomy, 2015 to 2022

    15.2. Market Size Value (US$ billion) & Volume (tons) Forecast by Market Taxonomy, 2023 to 2033

        15.2.1. by Country

            15.2.1.1. Poland

            15.2.1.2. Hungary

            15.2.1.3. Romania

            15.2.1.4. Czech Republic

            15.2.1.5. Rest of Eastern Europe

        15.2.2. by Film Type

        15.2.3. by Material

        15.2.4. by Packaging Type

        15.2.5. by End User

    15.3. Market Attractiveness Analysis

        15.3.1. by Country

        15.3.2. by Film Type

        15.3.3. by Material

        15.3.4. by Packaging Type

        15.3.5. by End User

    15.4. Key Takeaways

16. Central Asia Market Analysis 2015 to 2022 and Forecast 2023 to 2033, by Country

    16.1. Historical Market Size Value (US$ billion) & Volume (tons) Trend Analysis by Market Taxonomy, 2015 to 2022

    16.2. Market Size Value (US$ billion) & Volume (tons) Forecast by Market Taxonomy, 2023 to 2033

        16.2.1. by Country

        16.2.2. by Film Type /p>

        16.2.3. by Material

        16.2.4. by Packaging Type

        16.2.5. by End User

    16.3. Market Attractiveness Analysis

        16.3.1. by Country

        16.3.2. by Film Type

        16.3.3. by Material

        16.3.4. by Packaging Type

        16.3.5. by End User

    16.4. Key Takeaways

17. Russia & Belarus Market Analysis 2015 to 2022 and Forecast 2023 to 2033, by Country

    17.1. Historical Market Size Value (US$ billion) & Volume (tons) Trend Analysis by Market Taxonomy, 2015 to 2022

    17.2. Market Size Value (US$ billion) & Volume (tons) Forecast by Market Taxonomy, 2023 to 2033

        17.2.1. by Country

        17.2.2. by Film Type

        17.2.3. by Material

        17.2.4. by Packaging Type

        17.2.5. by End User

    17.3. Market Attractiveness Analysis

        17.3.1. by Country

        17.3.2. by Film Type

        17.3.3. by Material

        17.3.4. by Packaging Type

        17.3.5. by End User

    17.4. Key Takeaways

18. Balkan Countries Market Analysis 2015 to 2022 and Forecast 2023 to 2033, by Country

    18.1. Historical Market Size Value (US$ billion) & Volume (tons) Trend Analysis by Market Taxonomy, 2015 to 2022

    18.2. Market Size Value (US$ billion) & Volume (tons) Forecast by Market Taxonomy, 2023 to 2033

        18.2.1. by Country

        18.2.2. by Film Type

        18.2.3. by Material

        18.2.4. by Packaging Type

        18.2.5. by End User

    18.3. Market Attractiveness Analysis

        18.3.1. by Country

        18.3.2. by Film Type

        18.3.3. by Material

        18.3.4. by Packaging Type

        18.3.5. by End User

    18.4. Key Takeaways

19. Baltic Countries Market Analysis 2015 to 2022 and Forecast 2023 to 2033, by Country

    19.1. Historical Market Size Value (US$ billion) & Volume (tons) Trend Analysis by Market Taxonomy, 2015 to 2022

    19.2. Market Size Value (US$ billion) & Volume (tons) Forecast by Market Taxonomy, 2023 to 2033

        19.2.1. by Country

        19.2.2. by Film Type

        19.2.3. by Material

        19.2.4. by Packaging Type

        19.2.5. by End User

    19.3. Market Attractiveness Analysis

        19.3.1. by Country

        19.3.2. by Film Type

        19.3.3. by Material

        19.3.4. by Packaging Type

        19.3.5. by End User

    19.4. Key Takeaways

20. Middle East & Africa Market Analysis 2015 to 2022 and Forecast 2023 to 2033, by Country

    20.1. Historical Market Size Value (US$ billion) & Volume (tons) Trend Analysis by Market Taxonomy, 2015 to 2022

    20.2. Market Size Value (US$ billion) & Volume (tons) Forecast by Market Taxonomy, 2023 to 2033

        20.2.1. by Country

            20.2.1.1. Gulf Cooperation Council Countries

            20.2.1.2. Türkiye

            20.2.1.3. Northern Africa

            20.2.1.4. South Africa

            20.2.1.5. Rest of Middle East and Africa

        20.2.2. by Film Type

        20.2.3. by Material

        20.2.4. by Packaging Type

        20.2.5. by End User

    20.3. Market Attractiveness Analysis

        20.3.1. by Country

        20.3.2. by Film Type

        20.3.3. by Material

        20.3.4. by Packaging Type

        20.3.5. by End User

    20.4. Key Takeaways

21. Country wise Market Analysis 

    21.1. USA

        21.1.1. Market Share Analysis, 2023

        21.1.2. by Film Type

        21.1.3. by Material

        21.1.4. by Packaging Type

        21.1.5. by End User

    21.2. Canada

        21.2.1. Market Share Analysis, 2023

        21.2.2. by Film Type

        21.2.3. by Material

        21.2.4. by Packaging Type

        21.2.5. by End User

    21.3. Brazil

        21.3.1. Market Share Analysis, 2023

        21.3.2. by Film Type

        21.3.3. by Material

        21.3.4. by Packaging Type

        21.3.5. by End User

    21.4. Mexico

        21.4.1. Market Share Analysis, 2023

        21.4.2. by Film Type

        21.4.3. by Material

        21.4.4. by Packaging Type

        21.4.5. by End User

    21.5. Germany

        21.5.1. Market Share Analysis, 2023

        21.5.2. by Film Type

        21.5.3. by Material

        21.5.4. by Packaging Type

        21.5.5. by End User

    21.6. Italy 

        21.6.1. Market Share Analysis, 2023

        21.6.2. by Film Type

        21.6.3. by Material

        21.6.4. by Packaging Type

        21.6.5. by End User

    21.7. France 

        21.7.1. Market Share Analysis, 2023

        21.7.2. by Film Type

        21.7.3. by Material

        21.7.4. by Packaging Type

        21.7.5. by End User

    21.8. Spain 

        21.8.1. Market Share Analysis, 2023

        21.8.2. by Film Type

        21.8.3. by Material

        21.8.4. by Packaging Type

        21.8.5. by End User

    21.9. United Kingdom

        21.9.1. Market Share Analysis, 2023

        21.9.2. by Film Type

        21.9.3. by Material

        21.9.4. by Packaging Type

        21.9.5. by End User

    21.10. China

        21.10.1. Market Share Analysis, 2023

        21.10.2. by Film Type

        21.10.3. by Material

        21.10.4. by Packaging Type

        21.10.5. by End User

    21.11. Japan

        21.11.1. Market Share Analysis, 2023

        21.11.2. by Film Type

        21.11.3. by Material

        21.11.4. by Packaging Type

        21.11.5. by End User

    21.12. India

        21.12.1. Market Share Analysis, 2023

        21.12.2. by Film Type

        21.12.3. by Material

        21.12.4. by Packaging Type

        21.12.5. by End User

    21.13. Australia & New Zealand

        21.13.1. Market Share Analysis, 2023

        21.13.2. by Film Type

        21.13.3. by Material

        21.13.4. by Packaging Type

        21.13.5. by End User

    21.14. Gulf Cooperation Council Countries

        21.14.1. Market Share Analysis, 2023

        21.14.2. by Film Type

        21.14.3. by Material

        21.14.4. by Packaging Type

        21.14.5. by End User

    21.15. South Africa

        21.15.1. Market Share Analysis, 2023

        21.15.2. by Film Type

        21.15.3. by Material

        21.15.4. by Packaging Type

        21.15.5. by End User

22. Market Structure Analysis

    22.1. Competition Dashboard

    22.2. Competition Benchmarking

    22.3. Market Share Analysis of Top Players

        22.3.1. by Region

        22.3.2. by Product Portfolio

23. Competition Analysis

    23.1. Competition Deep Dive

        23.1.1. Amcor Plc

            23.1.1.1. Overview

            23.1.1.2. Product Portfolio

            23.1.1.3. Profitability by Market Segments (Product/Channel/Region)

            23.1.1.4. Sales Footprint

            23.1.1.5. Strategy Overview

                23.1.1.5.1. Marketing Strategy

                23.1.1.5.2. Product Strategy

                23.1.1.5.3. Channel Strategy

        23.1.2. Sealed Air Corp

            23.1.2.1. Overview

            23.1.2.2. Product Portfolio

            23.1.2.3. Profitability by Market Segments (Product/Channel/Region)

            23.1.2.4. Sales Footprint

            23.1.2.5. Strategy Overview

                23.1.2.5.1. Marketing Strategy

                23.1.2.5.2. Product Strategy

                23.1.2.5.3. Channel Strategy

        23.1.3. Glenroy, Inc.

            23.1.3.1. Overview

            23.1.3.2. Product Portfolio

            23.1.3.3. Profitability by Market Segments (Product/Channel/Region)

            23.1.3.4. Sales Footprint

            23.1.3.5. Strategy Overview

                23.1.3.5.1. Marketing Strategy

                23.1.3.5.2. Product Strategy

                23.1.3.5.3. Channel Strategy

        23.1.4. Winpak Ltd.

            23.1.4.1. Overview

            23.1.4.2. Product Portfolio

            23.1.4.3. Profitability by Market Segments (Product/Channel/Region)

            23.1.4.4. Sales Footprint

            23.1.4.5. Strategy Overview

                23.1.4.5.1. Marketing Strategy

                23.1.4.5.2. Product Strategy

                23.1.4.5.3. Channel Strategy

        23.1.5. Mondi Plc

            23.1.5.1. Overview

            23.1.5.2. Product Portfolio

            23.1.5.3. Profitability by Market Segments (Product/Channel/Region)

            23.1.5.4. Sales Footprint

            23.1.5.5. Strategy Overview

                23.1.5.5.1. Marketing Strategy

                23.1.5.5.2. Product Strategy

                23.1.5.5.3. Channel Strategy

        23.1.6. Toray Plastics (America), Inc.

            23.1.6.1. Overview

            23.1.6.2. Product Portfolio

            23.1.6.3. Profitability by Market Segments (Product/Channel/Region)

            23.1.6.4. Sales Footprint

            23.1.6.5. Strategy Overview

                23.1.6.5.1. Marketing Strategy

                23.1.6.5.2. Product Strategy

                23.1.6.5.3. Channel Strategy

        23.1.7. Berry Global, Inc.

            23.1.7.1. Overview

            23.1.7.2. Product Portfolio

            23.1.7.3. Profitability by Market Segments (Product/Channel/Region)

            23.1.7.4. Sales Footprint

            23.1.7.5. Strategy Overview

                23.1.7.5.1. Marketing Strategy

                23.1.7.5.2. Product Strategy

                23.1.7.5.3. Channel Strategy

        23.1.8. Schur Flexibles GmbH

            23.1.8.1. Overview

            23.1.8.2. Product Portfolio

            23.1.8.3. Profitability by Market Segments (Product/Channel/Region)

            23.1.8.4. Sales Footprint

            23.1.8.5. Strategy Overview

                23.1.8.5.1. Marketing Strategy

                23.1.8.5.2. Product Strategy

                23.1.8.5.3. Channel Strategy

        23.1.9. Huhtamaki Oyj

            23.1.9.1. Overview

            23.1.9.2. Product Portfolio

            23.1.9.3. Profitability by Market Segments (Product/Channel/Region)

            23.1.9.4. Sales Footprint

            23.1.9.5. Strategy Overview

                23.1.9.5.1. Marketing Strategy

                23.1.9.5.2. Product Strategy

                23.1.9.5.3. Channel Strategy

        23.1.10. Jindal Poly Films Ltd.

            23.1.10.1. Overview

            23.1.10.2. Product Portfolio

            23.1.10.3. Profitability by Market Segments (Product/Channel/Region)

            23.1.10.4. Sales Footprint

            23.1.10.5. Strategy Overview

                23.1.10.5.1. Marketing Strategy

                23.1.10.5.2. Product Strategy

                23.1.10.5.3. Channel Strategy

        23.1.11. Uflex Ltd.

            23.1.11.1. Overview

            23.1.11.2. Product Portfolio

            23.1.11.3. Profitability by Market Segments (Product/Channel/Region)

            23.1.11.4. Sales Footprint

            23.1.11.5. Strategy Overview

                23.1.11.5.1. Marketing Strategy

                23.1.11.5.2. Product Strategy

                23.1.11.5.3. Channel Strategy

        23.1.12. Cosmo Films Ltd.

            23.1.12.1. Overview

            23.1.12.2. Product Portfolio

            23.1.12.3. Profitability by Market Segments (Product/Channel/Region)

            23.1.12.4. Sales Footprint

            23.1.12.5. Strategy Overview

                23.1.12.5.1. Marketing Strategy

                23.1.12.5.2. Product Strategy

                23.1.12.5.3. Channel Strategy

        23.1.13. Bischof & Klein SE & Co. KG

            23.1.13.1. Overview

            23.1.13.2. Product Portfolio

            23.1.13.3. Profitability by Market Segments (Product/Channel/Region)

            23.1.13.4. Sales Footprint

            23.1.13.5. Strategy Overview

                23.1.13.5.1. Marketing Strategy

                23.1.13.5.2. Product Strategy

                23.1.13.5.3. Channel Strategy

        23.1.14. Plastissimo Film Co., Ltd.

            23.1.14.1. Overview

            23.1.14.2. Product Portfolio

            23.1.14.3. Profitability by Market Segments (Product/Channel/Region)

            23.1.14.4. Sales Footprint

            23.1.14.5. Strategy Overview

                23.1.14.5.1. Marketing Strategy

                23.1.14.5.2. Product Strategy

                23.1.14.5.3. Channel Strategy

        23.1.15. Celplast Metallized Products Ltd.

            23.1.15.1. Overview

            23.1.15.2. Product Portfolio

            23.1.15.3. Profitability by Market Segments (Product/Channel/Region)

            23.1.15.4. Sales Footprint

            23.1.15.5. Strategy Overview

                23.1.15.5.1. Marketing Strategy

                23.1.15.5.2. Product Strategy

                23.1.15.5.3. Channel Strategy

        23.1.16. Dunmore Corporation

            23.1.16.1. Overview

            23.1.16.2. Product Portfolio

            23.1.16.3. Profitability by Market Segments (Product/Channel/Region)

            23.1.16.4. Sales Footprint

            23.1.16.5. Strategy Overview

                23.1.16.5.1. Marketing Strategy

                23.1.16.5.2. Product Strategy

                23.1.16.5.3. Channel Strategy

        23.1.17. ProAmpac Intermediate, Inc.

            23.1.17.1. Overview

            23.1.17.2. Product Portfolio

            23.1.17.3. Profitability by Market Segments (Product/Channel/Region)

            23.1.17.4. Sales Footprint

            23.1.17.5. Strategy Overview

                23.1.17.5.1. Marketing Strategy

                23.1.17.5.2. Product Strategy

                23.1.17.5.3. Channel Strategy

        23.1.18. Polyplex Corporation Limited

            23.1.18.1. Overview

            23.1.18.2. Product Portfolio

            23.1.18.3. Profitability by Market Segments (Product/Channel/Region)

            23.1.18.4. Sales Footprint

            23.1.18.5. Strategy Overview

                23.1.18.5.1. Marketing Strategy

                23.1.18.5.2. Product Strategy

                23.1.18.5.3. Channel Strategy

        23.1.19. Shrinath Rotopack Pvt. Ltd.

            23.1.19.1. Overview

            23.1.19.2. Product Portfolio

            23.1.19.3. Profitability by Market Segments (Product/Channel/Region)

            23.1.19.4. Sales Footprint

            23.1.19.5. Strategy Overview

                23.1.19.5.1. Marketing Strategy

                23.1.19.5.2. Product Strategy

                23.1.19.5.3. Channel Strategy

        23.1.20. ACG Worldwide Private Limited

            23.1.20.1. Overview

            23.1.20.2. Product Portfolio

            23.1.20.3. Profitability by Market Segments (Product/Channel/Region)

            23.1.20.4. Sales Footprint

            23.1.20.5. Strategy Overview

                23.1.20.5.1. Marketing Strategy

                23.1.20.5.2. Product Strategy

                23.1.20.5.3. Channel Strategy

24. Assumptions and Acronyms Used

25. Research Methodology

Don't pay for what you don't need

Customize your report by selecting specific countries or regions and save 30%!

List of Tables

Table 01: Global Market Value (US$ billion) Forecast by Region, 2015 to 2033

Table 02: Global Market Volume (tons) Forecast by Region, 2015 to 2033

Table 03: Global Market Value (US$ billion) Forecast by Film Type, 2015 to 2033

Table 04: Global Market Volume (tons) Forecast by Film Type, 2015 to 2033

Table 05: Global Market Value (US$ billion) Forecast by Material, 2015 to 2033

Table 06: Global Market Volume (tons) Forecast by Material, 2015 to 2033

Table 07: Global Market Value (US$ billion) Forecast by Packaging Type, 2015 to 2033

Table 08: Global Market Volume (tons) Forecast by Packaging Type, 2015 to 2033

Table 07: Global Market Value (US$ billion) Forecast by End User, 2015 to 2033

Table 08: Global Market Volume (tons) Forecast by End User, 2015 to 2033

Table 09: North America Market Value (US$ billion) Forecast by Country, 2015 to 2033

Table 10: North America Market Volume (tons) Forecast by Country, 2015 to 2033

Table 11: North America Market Value (US$ billion) Forecast by Film Type, 2015 to 2033

Table 12: North America Market Volume (tons) Forecast by Film Type, 2015 to 2033

Table 13: North America Market Value (US$ billion) Forecast by Material, 2015 to 2033

Table 14: North America Market Volume (tons) Forecast by Material, 2015 to 2033

Table 15: North America Market Value (US$ billion) Forecast by Packaging Type, 2015 to 2033

Table 16: North America Market Volume (tons) Forecast by Packaging Type, 2015 to 2033

Table 15: North America Market Value (US$ billion) Forecast by End User, 2015 to 2033

Table 16: North America Market Volume (tons) Forecast by End User, 2015 to 2033

Table 17: Latin America Market Value (US$ billion) Forecast by Country, 2015 to 2033

Table 18: Latin America Market Volume (tons) Forecast by Country, 2015 to 2033

Table 19: Latin America Market Value (US$ billion) Forecast by Film Type, 2015 to 2033

Table 20: Latin America Market Volume (tons) Forecast by Film Type, 2015 to 2033

Table 21: Latin America Market Value (US$ billion) Forecast by Material, 2015 to 2033

Table 22: Latin America Market Volume (tons) Forecast by Material, 2015 to 2033

Table 23: Latin America Market Value (US$ billion) Forecast by Packaging Type, 2015 to 2033

Table 24: Latin America Market Volume (tons) Forecast by Packaging Type, 2015 to 2033

Table 21: Latin America Market Value (US$ billion) Forecast by End User, 2015 to 2033

Table 22: Latin America Market Volume (tons) Forecast by End User, 2015 to 2033

Table 25: East Asia Market Value (US$ billion) Forecast by Country, 2015 to 2033

Table 26: East Asia Market Volume (tons) Forecast by Country, 2015 to 2033

Table 27: East Asia Market Value (US$ billion) Forecast by Film Type, 2015 to 2033

Table 28: East Asia Market Volume (tons) Forecast by Film Type, 2015 to 2033

Table 29: East Asia Market Value (US$ billion) Forecast by Material, 2015 to 2033

Table 30: East Asia Market Volume (tons) Forecast by Material, 2015 to 2033

Table 31: East Asia Market Value (US$ billion) Forecast by Packaging Type, 2015 to 2033

Table 32: East Asia Market Volume (tons) Forecast by Packaging Type, 2015 to 2033

Table 29: East Asia Market Value (US$ billion) Forecast by End User, 2015 to 2033

Table 30: East Asia Market Volume (tons) Forecast by End User, 2015 to 2033

Table 33: South Asia & Pacific Market Value (US$ billion) Forecast by Country, 2015 to 2033

Table 34: South Asia & Pacific Market Volume (tons) Forecast by Country, 2015 to 2033

Table 35: South Asia & Pacific Market Value (US$ billion) Forecast by Film Type, 2015 to 2033

Table 36: South Asia & Pacific Market Volume (tons) Forecast by Film Type, 2015 to 2033

Table 37: South Asia & Pacific Market Value (US$ billion) Forecast by Material, 2015 to 2033

Table 38: South Asia & Pacific Market Volume (tons) Forecast by Material, 2015 to 2033

Table 39: South Asia & Pacific Market Value (US$ billion) Forecast by Packaging Type, 2015 to 2033

Table 40: South Asia & Pacific Market Volume (tons) Forecast by Packaging Type, 2015 to 2033

Table 39: South Asia & Pacific Market Value (US$ billion) Forecast by End User, 2015 to 2033

Table 40: South Asia & Pacific Market Volume (tons) Forecast by End User, 2015 to 2033

Table 41: Western Europe Market Value (US$ billion) Forecast by Country, 2015 to 2033

Table 42: Western Europe Market Volume (tons) Forecast by Country, 2015 to 2033

Table 43: Western Europe Market Value (US$ billion) Forecast by Film Type, 2015 to 2033

Table 44: Western Europe Market Volume (tons) Forecast by Film Type, 2015 to 2033

Table 45: Western Europe Market Value (US$ billion) Forecast by Material, 2015 to 2033

Table 46: Western Europe Market Volume (tons) Forecast by Material, 2015 to 2033

Table 47: Western Europe Market Value (US$ billion) Forecast by Packaging Type, 2015 to 2033

Table 48: Western Europe Market Volume (tons) Forecast by Packaging Type, 2015 to 2033

Table 47: Western Europe Market Value (US$ billion) Forecast by End User, 2015 to 2033

Table 48: Western Europe Market Volume (tons) Forecast by End User, 2015 to 2033

Table 49: Eastern Europe Market Value (US$ billion) Forecast by Country, 2015 to 2033

Table 50: Eastern Europe Market Volume (tons) Forecast by Country, 2015 to 2033

Table 51: Eastern Europe Market Value (US$ billion) Forecast by Film Type, 2015 to 2033

Table 52: Eastern Europe Market Volume (tons) Forecast by Film Type, 2015 to 2033

Table 53: Eastern Europe Market Value (US$ billion) Forecast by Material, 2015 to 2033

Table 54: Eastern Europe Market Volume (tons) Forecast by Material, 2015 to 2033

Table 55: Eastern Europe Market Value (US$ billion) Forecast by Packaging Type, 2015 to 2033

Table 56: Eastern Europe Market Volume (tons) Forecast by Packaging Type, 2015 to 2033

Table 55: Eastern Europe Market Value (US$ billion) Forecast by End User, 2015 to 2033

Table 56: Eastern Europe Market Volume (tons) Forecast by End User, 2015 to 2033

Table 57: Central Asia Market Value (US$ billion) Forecast by Country, 2015 to 2033

Table 58: Central Asia Market Volume (tons) Forecast by Country, 2015 to 2033

Table 59: Central Asia Market Value (US$ billion) Forecast by Film Type, 2015 to 2033

Table 60: Central Asia Market Volume (tons) Forecast by Film Type, 2015 to 2033

Table 61: Central Asia Market Value (US$ billion) Forecast by Material, 2015 to 2033

Table 62: Central Asia Market Volume (tons) Forecast by Material, 2015 to 2033

Table 63: Central Asia Market Value (US$ billion) Forecast by Packaging Type, 2015 to 2033

Table 64: Central Asia Market Volume (tons) Forecast by Packaging Type, 2015 to 2033

Table 63: Central Asia Market Value (US$ billion) Forecast by End User, 2015 to 2033

Table 64: Central Asia Market Volume (tons) Forecast by End User, 2015 to 2033

Table 65: Russia & Belarus Market Value (US$ billion) Forecast by Country, 2015 to 2033

Table 66: Russia & Belarus Market Volume (tons) Forecast by Country, 2015 to 2033

Table 67: Russia & Belarus Market Value (US$ billion) Forecast by Film Type, 2015 to 2033

Table 68: Russia & Belarus Market Volume (tons) Forecast by Film Type, 2015 to 2033

Table 69: Russia & Belarus Market Value (US$ billion) Forecast by Material, 2015 to 2033

Table 70: Russia & Belarus Market Volume (tons) Forecast by Material, 2015 to 2033

Table 71: Russia & Belarus Market Value (US$ billion) Forecast by Packaging Type, 2015 to 2033

Table 72: Russia & Belarus Market Volume (tons) Forecast by Packaging Type, 2015 to 2033

Table 71: Russia & Belarus Market Value (US$ billion) Forecast by End User, 2015 to 2033

Table 72: Russia & Belarus Market Volume (tons) Forecast by End User, 2015 to 2033

Table 73: Balkan Countries Market Value (US$ billion) Forecast by Country, 2015 to 2033

Table 74: Balkan Countries Market Volume (tons) Forecast by Country, 2015 to 2033

Table 75: Balkan Countries Market Value (US$ billion) Forecast by Film Type, 2015 to 2033

Table 76: Balkan Countries Market Volume (tons) Forecast by Film Type, 2015 to 2033

Table 77: Balkan Countries Market Value (US$ billion) Forecast by Material, 2015 to 2033

Table 78: Balkan Countries Market Volume (tons) Forecast by Material, 2015 to 2033

Table 79: Balkan Countries Market Value (US$ billion) Forecast by Packaging Type, 2015 to 2033

Table 80: Balkan Countries Market Volume (tons) Forecast by Packaging Type, 2015 to 2033

Table 79: Balkan Countries Market Value (US$ billion) Forecast by End User, 2015 to 2033

Table 80: Balkan Countries Market Volume (tons) Forecast by End User, 2015 to 2033

Table 81: Baltic Countries Market Value (US$ billion) Forecast by Country, 2015 to 2033

Table 82: Baltic Countries Market Volume (tons) Forecast by Country, 2015 to 2033

Table 83: Baltic Countries Market Value (US$ billion) Forecast by Film Type, 2015 to 2033

Table 84: Baltic Countries Market Volume (tons) Forecast by Film Type, 2015 to 2033

Table 85: Baltic Countries Market Value (US$ billion) Forecast by Material, 2015 to 2033

Table 86: Baltic Countries Market Volume (tons) Forecast by Material, 2015 to 2033

Table 87: Baltic Countries Market Value (US$ billion) Forecast by Packaging Type, 2015 to 2033

Table 88: Baltic Countries Market Volume (tons) Forecast by Packaging Type, 2015 to 2033

Table 87: Baltic Countries Market Value (US$ billion) Forecast by End User, 2015 to 2033

Table 88: Baltic Countries Market Volume (tons) Forecast by End User, 2015 to 2033

Table 89: Middle East and Africa Market Value (US$ billion) Forecast by Country, 2015 to 2033

Table 90: Middle East and Africa Market Volume (tons) Forecast by Country, 2015 to 2033

Table 91: Middle East and Africa Market Value (US$ billion) Forecast by Film Type, 2015 to 2033

Table 92: Middle East and Africa Market Volume (tons) Forecast by Film Type, 2015 to 2033

Table 93: Middle East and Africa Market Value (US$ billion) Forecast by Material, 2015 to 2033

Table 94: Middle East and Africa Market Volume (tons) Forecast by Material, 2015 to 2033

Table 95: Middle East and Africa Market Value (US$ billion) Forecast by Packaging Type, 2015 to 2033

Table 96: Middle East and Africa Market Volume (tons) Forecast by Packaging Type, 2015 to 2033

Table 95: Middle East and Africa Market Value (US$ billion) Forecast by End User, 2015 to 2033

Table 96: Middle East and Africa Market Volume (tons) Forecast by End User, 2015 to 2033

Table 97: USA Market Value (US$ billion) Forecast by Film Type, Packaging, and End-user 2023 to 2033

Table 98: Canada Market Value (US$ billion) Forecast by Film Type, Packaging, and End-user 2023 to 2033

Table 99: Brazil Market Value (US$ billion) Forecast by Film Type, Packaging, and End-user 2023 to 2033

Table 100: Mexico Market Value (US$ billion) Forecast by Film Type, Packaging, and End-user 2023 to 2033

Table 101: Germany Market Value (US$ billion) Forecast by Film Type, Packaging, and End-user 2023 to 2033

Table 102: Italy Market Value (US$ billion) Forecast by Film Type, Packaging, and End-user 2023 to 2033

Table 103: France Market Value (US$ billion) Forecast by Film Type, Packaging, and End-user 2023 to 2033

Table 104: Spain Market Value (US$ billion) Forecast by Film Type, Packaging, and End-user 2023 to 2033

Table 105: United Kingdom Market Value (US$ billion) Forecast by Film Type, Packaging, and End-user 2023 to 2033

Table 106: China Market Value (US$ billion) Forecast by Film Type, Packaging, and End-user 2023 to 2033

Table 107: Japan Market Value (US$ billion) Forecast by Film Type, Packaging, and End-user 2023 to 2033

Table 108: India Market Value (US$ billion) Forecast by Film Type, Packaging, and End-user 2023 to 2033

Table 109: Australia & New Zealand Market Value (US$ billion) Forecast by Film Type, Packaging, and End-user 2023 to 2033

Table 110: Gulf Cooperation Council Countries Market Value (US$ billion) Forecast by Film Type, Packaging, and End-user 2023 to 2033

Table 111: South Africa Market Value (US$ billion) Forecast by Film Type, Packaging, and End-user 2023 to 2033
Ismail Sutaria
Ismail Sutaria

Principal Consultant

Talk to Analyst

Find your sweet spots for generating winning opportunities in this market.

List of Charts

Figure 01: Global Market Value (US$ billion) by Film Type, 2023 to 2033

Figure 02: Global Market Value (US$ billion) by Material, 2023 to 2033

Figure 03: Global Market Value (US$ billion) by Packaging Type, 2023 to 2033

Figure 02: Global Market Value (US$ billion) by End User, 2023 to 2033

Figure 04: Global Market Value (US$ billion) by Region, 2023 to 2033

Figure 05: Global Market Value (US$ billion) Analysis by Region, 2015 to 2022

Figure 06: Global Market Volume (tons) Analysis by Region, 2015 to 2033

Figure 07: Global Market Value Share (%) and BPS Analysis by Region, 2023 to 2033

Figure 08: Global Market Y-o-Y Growth (%) Projections by Region, 2023 to 2033

Figure 09: Global Market Value (US$ billion) Analysis by Film Type, 2015 to 2022

Figure 10: Global Market Volume (tons) Analysis by Film Type, 2015 to 2033

Figure 11: Global Market Value Share (%) and BPS Analysis by Film Type, 2023 to 2033

Figure 12: Global Market Y-o-Y Growth (%) Projections by Film Type, 2023 to 2033

Figure 13: Global Market Value (US$ billion) Analysis by Material, 2015 to 2022

Figure 14: Global Market Volume (tons) Analysis by Material, 2015 to 2033

Figure 15: Global Market Value Share (%) and BPS Analysis by Material, 2023 to 2033

Figure 16: Global Market Y-o-Y Growth (%) Projections by Material, 2023 to 2033

Figure 17: Global Market Value (US$ billion) Analysis by Packaging Type, 2015 to 2022

Figure 18: Global Market Volume (tons) Analysis by Packaging Type, 2015 to 2033

Figure 19: Global Market Value Share (%) and BPS Analysis by Packaging Type, 2023 to 2033

Figure 20: Global Market Y-o-Y Growth (%) Projections by Packaging Type, 2023 to 2033

Figure 13: Global Market Value (US$ billion) Analysis by End User, 2015 to 2022

Figure 14: Global Market Volume (tons) Analysis by End User, 2015 to 2033

Figure 15: Global Market Value Share (%) and BPS Analysis by End User, 2023 to 2033

Figure 16: Global Market Y-o-Y Growth (%) Projections by End User, 2023 to 2033

Figure 21: Global Market Attractiveness by Film Type, 2023 to 2033

Figure 22: Global Market Attractiveness by Material, 2023 to 2033

Figure 23: Global Market Attractiveness by Packaging Type, 2023 to 2033

Figure 24: Global Market Attractiveness by End User, 2023 to 2033

Figure 25: Global Market Attractiveness by Region, 2023 to 2033

Figure 26: North America Market Value (US$ billion) by Film Type, 2023 to 2033

Figure 27: North America Market Value (US$ billion) by Material, 2023 to 2033

Figure 28: North America Market Value (US$ billion) by Packaging Type, 2023 to 2033

Figure 27: North America Market Value (US$ billion) by End User, 2023 to 2033

Figure 29: North America Market Value (US$ billion) by Country, 2023 to 2033

Figure 30: North America Market Value (US$ billion) Analysis by Country, 2015 to 2022

Figure 31: North America Market Volume (tons) Analysis by Country, 2015 to 2033

Figure 32: North America Market Value Share (%) and BPS Analysis by Country, 2023 to 2033

Figure 33: North America Market Y-o-Y Growth (%) Projections by Country, 2023 to 2033

Figure 34: North America Market Value (US$ billion) Analysis by Film Type, 2015 to 2022

Figure 35: North America Market Volume (tons) Analysis by Film Type, 2015 to 2033

Figure 36: North America Market Value Share (%) and BPS Analysis by Film Type, 2023 to 2033

Figure 37: North America Market Y-o-Y Growth (%) Projections by Film Type, 2023 to 2033

Figure 38: North America Market Value (US$ billion) Analysis by Material, 2015 to 2022

Figure 39: North America Market Volume (tons) Analysis by Material, 2015 to 2033

Figure 40: North America Market Value Share (%) and BPS Analysis by Material, 2023 to 2033

Figure 41: North America Market Y-o-Y Growth (%) Projections by Material, 2023 to 2033

Figure 42: North America Market Value (US$ billion) Analysis by Packaging Type, 2015 to 2022

Figure 43: North America Market Volume (tons) Analysis by Packaging Type, 2015 to 2033

Figure 44: North America Market Value Share (%) and BPS Analysis by Packaging Type, 2023 to 2033

Figure 45: North America Market Y-o-Y Growth (%) Projections by Packaging Type, 2023 to 2033

Figure 38: North America Market Value (US$ billion) Analysis by End User, 2015 to 2022

Figure 39: North America Market Volume (tons) Analysis by End User, 2015 to 2033

Figure 40: North America Market Value Share (%) and BPS Analysis by End User, 2023 to 2033

Figure 41: North America Market Y-o-Y Growth (%) Projections by End User, 2023 to 2033

Figure 46: North America Market Attractiveness by Film Type, 2023 to 2033

Figure 47: North America Market Attractiveness by Material, 2023 to 2033

Figure 48: North America Market Attractiveness by Packaging Type, 2023 to 2033

Figure 47: North America Market Attractiveness by End User, 2023 to 2033

Figure 49: North America Market Attractiveness by Country, 2023 to 2033

Figure 50: Latin America Market Value (US$ billion) by Film Type, 2023 to 2033

Figure 51: Latin America Market Value (US$ billion) by Film Type, 2023 to 2033

Figure 52: Latin America Market Value (US$ billion) by Packaging Type, 2023 to 2033

Figure 52: Latin America Market Value (US$ billion) by End User, 2023 to 2033

Figure 53: Latin America Market Value (US$ billion) by Country, 2023 to 2033

Figure 54: Latin America Market Value (US$ billion) Analysis by Country, 2015 to 2022

Figure 55: Latin America Market Volume (tons) Analysis by Country, 2015 to 2033

Figure 56: Latin America Market Value Share (%) and BPS Analysis by Country, 2023 to 2033

Figure 57: Latin America Market Y-o-Y Growth (%) Projections by Country, 2023 to 2033

Figure 58: Latin America Market Value (US$ billion) Analysis by Film Type, 2015 to 2022

Figure 59: Latin America Market Volume (tons) Analysis by Film Type, 2015 to 2033

Figure 60: Latin America Market Value Share (%) and BPS Analysis by Film Type, 2023 to 2033

Figure 61: Latin America Market Y-o-Y Growth (%) Projections by Film Type, 2023 to 2033

Figure 62: Latin America Market Value (US$ billion) Analysis by Film Type, 2015 to 2022

Figure 63: Latin America Market Volume (tons) Analysis by Film Type, 2015 to 2033

Figure 64: Latin America Market Value Share (%) and BPS Analysis by Film Type, 2023 to 2033

Figure 65: Latin America Market Y-o-Y Growth (%) Projections by Film Type, 2023 to 2033

Figure 66: Latin America Market Value (US$ billion) Analysis by Packaging Type, 2015 to 2022

Figure 67: Latin America Market Volume (tons) Analysis by Packaging Type, 2015 to 2033

Figure 68: Latin America Market Value Share (%) and BPS Analysis by Packaging Type, 2023 to 2033

Figure 69: Latin America Market Y-o-Y Growth (%) Projections by Packaging Type, 2023 to 2033

Figure 66: Latin America Market Value (US$ billion) Analysis by End User, 2015 to 2022

Figure 67: Latin America Market Volume (tons) Analysis by End User, 2015 to 2033

Figure 68: Latin America Market Value Share (%) and BPS Analysis by End User, 2023 to 2033

Figure 69: Latin America Market Y-o-Y Growth (%) Projections by End User, 2023 to 2033

Figure 70: Latin America Market Attractiveness by Film Type, 2023 to 2033

Figure 71: Latin America Market Attractiveness by Film Type, 2023 to 2033

Figure 72: Latin America Market Attractiveness by Packaging Type, 2023 to 2033

Figure 72: Latin America Market Attractiveness by End User, 2023 to 2033

Figure 73: Latin America Market Attractiveness by Country, 2023 to 2033

Figure 74: East Asia Market Value (US$ billion) by Film Type, 2023 to 2033

Figure 75: East Asia Market Value (US$ billion) by Film Type, 2023 to 2033

Figure 76: East Asia Market Value (US$ billion) by Packaging Type, 2023 to 2033

Figure 76: East Asia Market Value (US$ billion) by End User, 2023 to 2033

Figure 77: East Asia Market Value (US$ billion) by Country, 2023 to 2033

Figure 78: East Asia Market Value (US$ billion) Analysis by Country, 2015 to 2022

Figure 79: East Asia Market Volume (tons) Analysis by Country, 2015 to 2033

Figure 80: East Asia Market Value Share (%) and BPS Analysis by Country, 2023 to 2033

Figure 81: East Asia Market Y-o-Y Growth (%) Projections by Country, 2023 to 2033

Figure 82: East Asia Market Value (US$ billion) Analysis by Film Type, 2015 to 2022

Figure 83: East Asia Market Volume (tons) Analysis by Film Type, 2015 to 2033

Figure 84: East Asia Market Value Share (%) and BPS Analysis by Film Type, 2023 to 2033

Figure 85: East Asia Market Y-o-Y Growth (%) Projections by Film Type, 2023 to 2033

Figure 86: East Asia Market Value (US$ billion) Analysis by Film Type, 2015 to 2022

Figure 87: East Asia Market Volume (tons) Analysis by Film Type, 2015 to 2033

Figure 88: East Asia Market Value Share (%) and BPS Analysis by Film Type, 2023 to 2033

Figure 89: East Asia Market Y-o-Y Growth (%) Projections by Film Type, 2023 to 2033

Figure 90: East Asia Market Value (US$ billion) Analysis by Packaging Type, 2015 to 2022

Figure 91: East Asia Market Volume (tons) Analysis by Packaging Type, 2015 to 2033

Figure 92: East Asia Market Value Share (%) and BPS Analysis by Packaging Type, 2023 to 2033

Figure 93: East Asia Market Y-o-Y Growth (%) Projections by Packaging Type, 2023 to 2033

Figure 90: East Asia Market Value (US$ billion) Analysis by End User, 2015 to 2022

Figure 91: East Asia Market Volume (tons) Analysis by End User, 2015 to 2033

Figure 92: East Asia Market Value Share (%) and BPS Analysis by End User, 2023 to 2033

Figure 93: East Asia Market Y-o-Y Growth (%) Projections by End User, 2023 to 2033

Figure 94: East Asia Market Attractiveness by Film Type, 2023 to 2033

Figure 96: East Asia Market Attractiveness by Packaging Type, 2023 to 2033

Figure 95: East Asia Market Attractiveness by End User, 2023 to 2033

Figure 97: East Asia Market Attractiveness by Country, 2023 to 2033

Figure 98: South Asia & Pacific Market Value (US$ billion) by Film Type, 2023 to 2033

Figure 99: South Asia & Pacific Market Value (US$ billion) by Material, 2023 to 2033

Figure 100: South Asia & Pacific Market Value (US$ billion) by Packaging Type, 2023 to 2033

Figure 99: South Asia & Pacific Market Value (US$ billion) by End User, 2023 to 2033

Figure 101: South Asia & Pacific Market Value (US$ billion) by Country, 2023 to 2033

Figure 102: South Asia & Pacific Market Value (US$ billion) Analysis by Country, 2015 to 2022

Figure 103: South Asia & Pacific Market Volume (tons) Analysis by Country, 2015 to 2033

Figure 104: South Asia & Pacific Market Value Share (%) and BPS Analysis by Country, 2023 to 2033

Figure 105: South Asia & Pacific Market Y-o-Y Growth (%) Projections by Country, 2023 to 2033

Figure 106: South Asia & Pacific Market Value (US$ billion) Analysis by Film Type, 2015 to 2022

Figure 107: South Asia & Pacific Market Volume (tons) Analysis by Film Type, 2015 to 2033

Figure 108: South Asia & Pacific Market Value Share (%) and BPS Analysis by Film Type, 2023 to 2033

Figure 109: South Asia & Pacific Market Y-o-Y Growth (%) Projections by Film Type, 2023 to 2033

Figure 110: South Asia & Pacific Market Value (US$ billion) Analysis by Material, 2015 to 2022

Figure 111: South Asia & Pacific Market Volume (tons) Analysis by Material, 2015 to 2033

Figure 112: South Asia & Pacific Market Value Share (%) and BPS Analysis by Material, 2023 to 2033

Figure 113: South Asia & Pacific Market Y-o-Y Growth (%) Projections by Material, 2023 to 2033

Figure 114: South Asia & Pacific Market Value (US$ billion) Analysis by Packaging Type, 2015 to 2022

Figure 115: South Asia & Pacific Market Volume (tons) Analysis by Packaging Type, 2015 to 2033

Figure 116: South Asia & Pacific Market Value Share (%) and BPS Analysis by Packaging Type, 2023 to 2033

Figure 117: South Asia & Pacific Market Y-o-Y Growth (%) Projections by Packaging Type, 2023 to 2033

Figure 106: South Asia & Pacific Market Value (US$ billion) Analysis by End User, 2015 to 2022

Figure 107: South Asia & Pacific Market Volume (tons) Analysis by End User, 2015 to 2033

Figure 108: South Asia & Pacific Market Value Share (%) and BPS Analysis by End User, 2023 to 2033

Figure 109: South Asia & Pacific Market Y-o-Y Growth (%) Projections by End User, 2023 to 2033

Figure 118: South Asia & Pacific Market Attractiveness by Film Type, 2023 to 2033

Figure 119: South Asia & Pacific Market Attractiveness by Material, 2023 to 2033

Figure 120: South Asia & Pacific Market Attractiveness by Packaging Type, 2023 to 2033

Figure 119: South Asia & Pacific Market Attractiveness by End User, 2023 to 2033

Figure 121: South Asia & Pacific Market Attractiveness by Country, 2023 to 2033

Figure 123: Western Europe Market Value (US$ billion) by Film Type, 2023 to 2033

Figure 124: Western Europe Market Value (US$ billion) by Film Type, 2023 to 2033

Figure 125: Western Europe Market Value (US$ billion) by Packaging Type, 2023 to 2033

Figure 125: Western Europe Market Value (US$ billion) by End User, 2023 to 2033

Figure 126: Western Europe Market Value (US$ billion) by Country, 2023 to 2033

Figure 127: Western Europe Market Value (US$ billion) Analysis by Country, 2015 to 2022

Figure 128: Western Europe Market Volume (tons) Analysis by Country, 2015 to 2033

Figure 129: Western Europe Market Value Share (%) and BPS Analysis by Country, 2023 to 2033

Figure 130: Western Europe Market Y-o-Y Growth (%) Projections by Country, 2023 to 2033

Figure 131: Western Europe Market Value (US$ billion) Analysis by Film Type, 2015 to 2022

Figure 132: Western Europe Market Volume (tons) Analysis by Film Type, 2015 to 2033

Figure 133: Western Europe Market Value Share (%) and BPS Analysis by Film Type, 2023 to 2033

Figure 134: Western Europe Market Y-o-Y Growth (%) Projections by Film Type, 2023 to 2033

Figure 135: Western Europe Market Value (US$ billion) Analysis by Film Type, 2015 to 2022

Figure 136: Western Europe Market Volume (tons) Analysis by Film Type, 2015 to 2033

Figure 137: Western Europe Market Value Share (%) and BPS Analysis by Film Type, 2023 to 2033

Figure 138: Western Europe Market Y-o-Y Growth (%) Projections by Film Type, 2023 to 2033

Figure 139: Western Europe Market Value (US$ billion) Analysis by Packaging Type, 2015 to 2022

Figure 140: Western Europe Market Volume (tons) Analysis by Packaging Type, 2015 to 2033

Figure 141: Western Europe Market Value Share (%) and BPS Analysis by Packaging Type, 2023 to 2033

Figure 142: Western Europe Market Y-o-Y Growth (%) Projections by Packaging Type, 2023 to 2033

Figure 139: Western Europe Market Value (US$ billion) Analysis by End User, 2015 to 2022

Figure 140: Western Europe Market Volume (tons) Analysis by End User, 2015 to 2033

Figure 141: Western Europe Market Value Share (%) and BPS Analysis by End User, 2023 to 2033

Figure 142: Western Europe Market Y-o-Y Growth (%) Projections by End User, 2023 to 2033

Figure 143: Western Europe Market Attractiveness by Film Type, 2023 to 2033

Figure 144: Western Europe Market Attractiveness by Film Type, 2023 to 2033

Figure 145: Western Europe Market Attractiveness by Packaging Type, 2023 to 2033

Figure 145: Western Europe Market Attractiveness by End User, 2023 to 2033

Figure 146: Western Europe Market Attractiveness by Country, 2023 to 2033

Figure 147: Eastern Europe Market Value (US$ billion) by Film Type, 2023 to 2033

Figure 148: Eastern Europe Market Value (US$ billion) by Film Type, 2023 to 2033

Figure 149: Eastern Europe Market Value (US$ billion) by Packaging Type, 2023 to 2033

Figure 149: Eastern Europe Market Value (US$ billion) by End User, 2023 to 2033

Figure 150: Eastern Europe Market Value (US$ billion) by Country, 2023 to 2033

Figure 151: Eastern Europe Market Value (US$ billion) Analysis by Country, 2015 to 2022

Figure 152: Eastern Europe Market Volume (tons) Analysis by Country, 2015 to 2033

Figure 153: Eastern Europe Market Value Share (%) and BPS Analysis by Country, 2023 to 2033

Figure 154: Eastern Europe Market Y-o-Y Growth (%) Projections by Country, 2023 to 2033

Figure 155: Eastern Europe Market Value (US$ billion) Analysis by Film Type, 2015 to 2022

Figure 156: Eastern Europe Market Volume (tons) Analysis by Film Type, 2015 to 2033

Figure 157: Eastern Europe Market Value Share (%) and BPS Analysis by Film Type, 2023 to 2033

Figure 158: Eastern Europe Market Y-o-Y Growth (%) Projections by Film Type, 2023 to 2033

Figure 159: Eastern Europe Market Value (US$ billion) Analysis by Film Type, 2015 to 2022

Figure 160: Eastern Europe Market Volume (tons) Analysis by Film Type, 2015 to 2033

Figure 161: Eastern Europe Market Value Share (%) and BPS Analysis by Film Type, 2023 to 2033

Figure 162: Eastern Europe Market Y-o-Y Growth (%) Projections by Film Type, 2023 to 2033

Figure 163: Eastern Europe Market Value (US$ billion) Analysis by Packaging Type, 2015 to 2022

Figure 164: Eastern Europe Market Volume (tons) Analysis by Packaging Type, 2015 to 2033

Figure 165: Eastern Europe Market Value Share (%) and BPS Analysis by Packaging Type, 2023 to 2033

Figure 166: Eastern Europe Market Y-o-Y Growth (%) Projections by Packaging Type, 2023 to 2033

Figure 163: Eastern Europe Market Value (US$ billion) Analysis by End User, 2015 to 2022

Figure 164: Eastern Europe Market Volume (tons) Analysis by End User, 2015 to 2033

Figure 165: Eastern Europe Market Value Share (%) and BPS Analysis by End User, 2023 to 2033

Figure 166: Eastern Europe Market Y-o-Y Growth (%) Projections by End User, 2023 to 2033

Figure 167: Eastern Europe Market Attractiveness by Film Type, 2023 to 2033

Figure 168: Eastern Europe Market Attractiveness by Film Type, 2023 to 2033

Figure 169: Eastern Europe Market Attractiveness by Packaging Type, 2023 to 2033

Figure 169: Eastern Europe Market Attractiveness by End User, 2023 to 2033

Figure 170: Eastern Europe Market Attractiveness by Country, 2023 to 2033

Figure 171: Central Asia Market Value (US$ billion) by Film Type, 2023 to 2033

Figure 172: Central Asia Market Value (US$ billion) by Film Type, 2023 to 2033

Figure 173: Central Asia Market Value (US$ billion) by Packaging Type, 2023 to 2033

Figure 174: Central Asia Market Value (US$ billion) by Country, 2023 to 2033

Figure 175: Central Asia Market Value (US$ billion) Analysis by Country, 2015 to 2022

Figure 176: Central Asia Market Volume (tons) Analysis by Country, 2015 to 2033

Figure 177: Central Asia Market Value Share (%) and BPS Analysis by Country, 2023 to 2033

Figure 178: Central Asia Market Y-o-Y Growth (%) Projections by Country, 2023 to 2033

Figure 179: Central Asia Market Value (US$ billion) Analysis by Film Type, 2015 to 2022

Figure 180: Central Asia Market Volume (tons) Analysis by Film Type, 2015 to 2033

Figure 181: Central Asia Market Value Share (%) and BPS Analysis by Film Type, 2023 to 2033

Figure 182: Central Asia Market Y-o-Y Growth (%) Projections by Film Type, 2023 to 2033

Figure 183: Central Asia Market Value (US$ billion) Analysis by Film Type, 2015 to 2022

Figure 184: Central Asia Market Volume (tons) Analysis by Film Type, 2015 to 2033

Figure 185: Central Asia Market Value Share (%) and BPS Analysis by Film Type, 2023 to 2033

Figure 186: Central Asia Market Y-o-Y Growth (%) Projections by Film Type, 2023 to 2033

Figure 187: Central Asia Market Value (US$ billion) Analysis by Packaging Type, 2015 to 2022

Figure 188: Central Asia Market Volume (tons) Analysis by Packaging Type, 2015 to 2033

Figure 189: Central Asia Market Value Share (%) and BPS Analysis by Packaging Type, 2023 to 2033

Figure 190: Central Asia Market Y-o-Y Growth (%) Projections by Packaging Type, 2023 to 2033

Figure 187: Central Asia Market Value (US$ billion) Analysis by End User, 2015 to 2022

Figure 188: Central Asia Market Volume (tons) Analysis by End User, 2015 to 2033

Figure 189: Central Asia Market Value Share (%) and BPS Analysis by End User, 2023 to 2033

Figure 190: Central Asia Market Y-o-Y Growth (%) Projections by End User, 2023 to 2033

Figure 191: Central Asia Market Attractiveness by Film Type, 2023 to 2033

Figure 192: Central Asia Market Attractiveness by Film Type, 2023 to 2033

Figure 193: Central Asia Market Attractiveness by Packaging Type, 2023 to 2033

Figure 193: Central Asia Market Attractiveness by End User, 2023 to 2033

Figure 194: Central Asia Market Attractiveness by Country, 2023 to 2033

Figure 195: Russia & Belarus Market Value (US$ billion) by Film Type, 2023 to 2033

Figure 196: Russia & Belarus Market Value (US$ billion) by Film Type, 2023 to 2033

Figure 197: Russia & Belarus Market Value (US$ billion) by Packaging Type, 2023 to 2033

Figure 198: Russia & Belarus Market Value (US$ billion) by Country, 2023 to 2033

Figure 199: Russia & Belarus Market Value (US$ billion) Analysis by Country, 2015 to 2022

Figure 200: Russia & Belarus Market Volume (tons) Analysis by Country, 2015 to 2033

Figure 201: Russia & Belarus Market Value Share (%) and BPS Analysis by Country, 2023 to 2033

Figure 202: Russia & Belarus Market Y-o-Y Growth (%) Projections by Country, 2023 to 2033

Figure 203: Russia & Belarus Market Value (US$ billion) Analysis by Film Type, 2015 to 2022

Figure 204: Russia & Belarus Market Volume (tons) Analysis by Film Type, 2015 to 2033

Figure 205: Russia & Belarus Market Value Share (%) and BPS Analysis by Film Type, 2023 to 2033

Figure 206: Russia & Belarus Market Y-o-Y Growth (%) Projections by Film Type, 2023 to 2033

Figure 207: Russia & Belarus Market Value (US$ billion) Analysis by Film Type, 2015 to 2022

Figure 208: Russia & Belarus Market Volume (tons) Analysis by Film Type, 2015 to 2033

Figure 209: Russia & Belarus Market Value Share (%) and BPS Analysis by Film Type, 2023 to 2033

Figure 210: Russia & Belarus Market Y-o-Y Growth (%) Projections by Film Type, 2023 to 2033

Figure 211: Russia & Belarus Market Value (US$ billion) Analysis by Packaging Type, 2015 to 2022

Figure 212: Russia & Belarus Market Volume (tons) Analysis by Packaging Type, 2015 to 2033

Figure 213: Russia & Belarus Market Value Share (%) and BPS Analysis by Packaging Type, 2023 to 2033

Figure 214: Russia & Belarus Market Y-o-Y Growth (%) Projections by Packaging Type, 2023 to 2033

Figure 211: Russia & Belarus Market Value (US$ billion) Analysis by End User, 2015 to 2022

Figure 212: Russia & Belarus Market Volume (tons) Analysis by End User, 2015 to 2033

Figure 213: Russia & Belarus Market Value Share (%) and BPS Analysis by End User, 2023 to 2033

Figure 214: Russia & Belarus Market Y-o-Y Growth (%) Projections by End User, 2023 to 2033

Figure 215: Russia & Belarus Market Attractiveness by Film Type, 2023 to 2033

Figure 216: Russia & Belarus Market Attractiveness by Film Type, 2023 to 2033

Figure 217: Russia & Belarus Market Attractiveness by Packaging Type, 2023 to 2033

Figure 217: Russia & Belarus Market Attractiveness by End User, 2023 to 2033

Figure 218: Russia & Belarus Market Attractiveness by Country, 2023 to 2033

Figure 219: Balkan Countries Market Value (US$ billion) by Film Type, 2023 to 2033

Figure 220: Balkan Countries Market Value (US$ billion) by Film Type, 2023 to 2033

Figure 221: Balkan Countries Market Value (US$ billion) by Packaging Type, 2023 to 2033

Figure 222: Balkan Countries Market Value (US$ billion) by Country, 2023 to 2033

Figure 223: Balkan Countries Market Value (US$ billion) Analysis by Country, 2015 to 2022

Figure 224: Balkan Countries Market Volume (tons) Analysis by Country, 2015 to 2033

Figure 225: Balkan Countries Market Value Share (%) and BPS Analysis by Country, 2023 to 2033

Figure 226: Balkan Countries Market Y-o-Y Growth (%) Projections by Country, 2023 to 2033

Figure 227: Balkan Countries Market Value (US$ billion) Analysis by Film Type, 2015 to 2022

Figure 228: Balkan Countries Market Volume (tons) Analysis by Film Type, 2015 to 2033

Figure 229: Balkan Countries Market Value Share (%) and BPS Analysis by Film Type, 2023 to 2033

Figure 230: Balkan Countries Market Y-o-Y Growth (%) Projections by Film Type, 2023 to 2033

Figure 231: Balkan Countries Market Value (US$ billion) Analysis by Film Type, 2015 to 2022

Figure 232: Balkan Countries Market Volume (tons) Analysis by Film Type, 2015 to 2033

Figure 233: Balkan Countries Market Value Share (%) and BPS Analysis by Film Type, 2023 to 2033

Figure 234: Balkan Countries Market Y-o-Y Growth (%) Projections by Film Type, 2023 to 2033

Figure 235: Balkan Countries Market Value (US$ billion) Analysis by Packaging Type, 2015 to 2022

Figure 236: Balkan Countries Market Volume (tons) Analysis by Packaging Type, 2015 to 2033

Figure 237: Balkan Countries Market Value Share (%) and BPS Analysis by Packaging Type, 2023 to 2033

Figure 238: Balkan Countries Market Y-o-Y Growth (%) Projections by Packaging Type, 2023 to 2033

Figure 235: Balkan Countries Market Value (US$ billion) Analysis by End User, 2015 to 2022

Figure 236: Balkan Countries Market Volume (tons) Analysis by End User, 2015 to 2033

Figure 237: Balkan Countries Market Value Share (%) and BPS Analysis by End User, 2023 to 2033

Figure 238: Balkan Countries Market Y-o-Y Growth (%) Projections by End User, 2023 to 2033

Figure 239: Balkan Countries Market Attractiveness by Film Type, 2023 to 2033

Figure 240: Balkan Countries Market Attractiveness by Film Type, 2023 to 2033

Figure 241: Balkan Countries Market Attractiveness by Packaging Type, 2023 to 2033

Figure 241: Balkan Countries Market Attractiveness by End User, 2023 to 2033

Figure 242: Balkan Countries Market Attractiveness by Country, 2023 to 2033

Figure 243: Baltic Countries Market Value (US$ billion) by Film Type, 2023 to 2033

Figure 244: Baltic Countries Market Value (US$ billion) by Film Type, 2023 to 2033

Figure 245: Baltic Countries Market Value (US$ billion) by Packaging Type, 2023 to 2033

Figure 245: Baltic Countries Market Value (US$ billion) by End User, 2023 to 2033

Figure 246: Baltic Countries Market Value (US$ billion) by Country, 2023 to 2033

Figure 247: Baltic Countries Market Value (US$ billion) Analysis by Country, 2015 to 2022

Figure 248: Baltic Countries Market Volume (tons) Analysis by Country, 2015 to 2033

Figure 249: Baltic Countries Market Value Share (%) and BPS Analysis by Country, 2023 to 2033

Figure 250: Baltic Countries Market Y-o-Y Growth (%) Projections by Country, 2023 to 2033

Figure 251: Baltic Countries Market Value (US$ billion) Analysis by Film Type, 2015 to 2022

Figure 252: Baltic Countries Market Volume (tons) Analysis by Film Type, 2015 to 2033

Figure 253: Baltic Countries Market Value Share (%) and BPS Analysis by Film Type, 2023 to 2033

Figure 254: Baltic Countries Market Y-o-Y Growth (%) Projections by Film Type, 2023 to 2033

Figure 255: Baltic Countries Market Value (US$ billion) Analysis by Film Type, 2015 to 2022

Figure 256: Baltic Countries Market Volume (tons) Analysis by Film Type, 2015 to 2033

Figure 257: Baltic Countries Market Value Share (%) and BPS Analysis by Film Type, 2023 to 2033

Figure 258: Baltic Countries Market Y-o-Y Growth (%) Projections by Film Type, 2023 to 2033

Figure 259: Baltic Countries Market Value (US$ billion) Analysis by Packaging Type, 2015 to 2022

Figure 260: Baltic Countries Market Volume (tons) Analysis by Packaging Type, 2015 to 2033

Figure 261: Baltic Countries Market Value Share (%) and BPS Analysis by Packaging Type, 2023 to 2033

Figure 262: Baltic Countries Market Y-o-Y Growth (%) Projections by Packaging Type, 2023 to 2033

Figure 259: Baltic Countries Market Value (US$ billion) Analysis by End User, 2015 to 2022

Figure 260: Baltic Countries Market Volume (tons) Analysis by End User, 2015 to 2033

Figure 261: Baltic Countries Market Value Share (%) and BPS Analysis End User, 2023 to 2033

Figure 262: Baltic Countries Market Y-o-Y Growth (%) Projections by End User, 2023 to 2033

Figure 263: Baltic Countries Market Attractiveness by Film Type, 2023 to 2033

Figure 264: Baltic Countries Market Attractiveness by Film Type, 2023 to 2033

Figure 265: Baltic Countries Market Attractiveness by Packaging Type, 2023 to 2033

Figure 266: Baltic Countries Market Attractiveness by Country, 2023 to 2033

Figure 267: Middle East and Africa Market Value (US$ billion) by Film Type, 2023 to 2033

Figure 268: Middle East and Africa Market Value (US$ billion) by Material, 2023 to 2033

Figure 269: Middle East and Africa Market Value (US$ billion) by Packaging Type, 2023 to 2033

Figure 269: Middle East and Africa Market Value (US$ billion) by End User, 2023 to 2033

Figure 270: Middle East and Africa Market Value (US$ billion) by Country, 2023 to 2033

Figure 271: Middle East and Africa Market Value (US$ billion) Analysis by Country, 2015 to 2022

Figure 272: Middle East and Africa Market Volume (tons) Analysis by Country, 2015 to 2033

Figure 273: Middle East and Africa Market Value Share (%) and BPS Analysis by Country, 2023 to 2033

Figure 274: Middle East and Africa Market Y-o-Y Growth (%) Projections by Country, 2023 to 2033

Figure 275: Middle East and Africa Market Value (US$ billion) Analysis by Film Type, 2015 to 2022

Figure 276: Middle East and Africa Market Volume (tons) Analysis by Film Type, 2015 to 2033

Figure 277: Middle East and Africa Market Value Share (%) and BPS Analysis by Film Type, 2023 to 2033

Figure 278: Middle East and Africa Market Y-o-Y Growth (%) Projections by Film Type, 2023 to 2033

Figure 279: Middle East and Africa Market Value (US$ billion) Analysis by Material, 2015 to 2022

Figure 280: Middle East and Africa Market Volume (tons) Analysis by Material, 2015 to 2033

Figure 281: Middle East and Africa Market Value Share (%) and BPS Analysis by Material, 2023 to 2033

Figure 282: Middle East and Africa Market Y-o-Y Growth (%) Projections by Material, 2023 to 2033

Figure 283: Middle East and Africa Market Value (US$ billion) Analysis by Packaging Type, 2015 to 2022

Figure 284: Middle East and Africa Market Volume (tons) Analysis by Packaging Type, 2015 to 2033

Figure 285: Middle East and Africa Market Value Share (%) and BPS Analysis by Packaging Type, 2023 to 2033

Figure 286: Middle East and Africa Market Y-o-Y Growth (%) Projections by Packaging Type, 2023 to 2033

Figure 283: Middle East and Africa Market Value (US$ billion) Analysis by End User, 2015 to 2022

Figure 284: Middle East and Africa Market Volume (tons) Analysis by End User, 2015 to 2033

Figure 285: Middle East and Africa Market Value Share (%) and BPS Analysis by End User, 2023 to 2033

Figure 286: Middle East and Africa Market Y-o-Y Growth (%) Projections by End User, 2023 to 2033

Figure 287: Middle East and Africa Market Attractiveness by Film Type, 2023 to 2033

Figure 288: Middle East and Africa Market Attractiveness by Material, 2023 to 2033

Figure 289: Middle East and Africa Market Attractiveness by Packaging Type, 2023 to 2033

Figure 290: Middle East and Africa Market Attractiveness by Country, 2023 to 2033

Recommendations

Packaging

High Barrier Lidding Film Market

Published : October 2023

Packaging

High Performance Barrier Films Market

Published : July 2023

Packaging

High Barrier Packaging Films Market

Published : January 2023

Explore Packaging Insights

View Reports

High Barrier Packaging Films Market