The global high barrier packaging films for pharmaceuticals market is valued at USD 8.9 billion in 2025 and is set to reach USD 21.3 billion by 2035, recording an absolute increase of USD 12.4 billion over the forecast period. Based on Future Market Insights (FMI)’s verified data on biopolymer, flexible, and rigid packaging adoption, this translates into a total growth of 139.3%, with the market forecast to expand at a compound annual growth rate (CAGR) of 9.10% between 2025 and 2035.
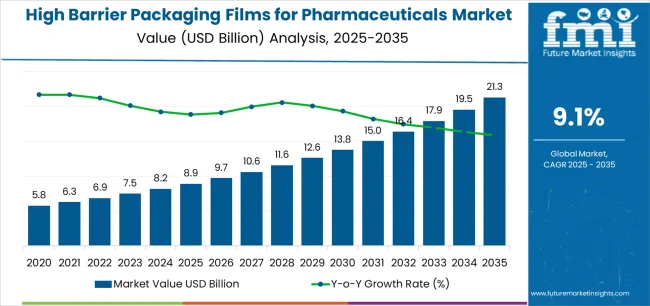
The overall market size is expected to grow by approximately 2.4X during the same period, supported by increasing demand for advanced drug protection solutions, growing adoption of biologics and sensitive formulations, and rising requirements for extended shelf life across oral solids, injectable products, and specialized pharmaceutical applications.
Between 2025 and 2030, the high barrier packaging films for pharmaceuticals market is projected to expand from USD 8.9 billion to USD 13.8 billion, resulting in a value increase of USD 4.9 billion, which represents 39.5% of the total forecast growth for the decade.
This phase of development will be shaped by increasing demand for moisture-sensitive drug protection, rising biosimilar commercialization patterns enabling advanced therapeutic delivery, and growing availability of multi-layer extrusion technologies across pharmaceutical manufacturing operations and contract packaging facilities.
Between 2030 and 2035, the market is forecast to grow from USD 13.8 billion to USD 21.3 billion, adding another USD 7.5 billion, which constitutes 60.5% of the overall ten-year expansion. This period is expected to be characterized by the advancement of ultra-high barrier formulations, the integration of active packaging technologies for enhanced stability, and the development of child-resistant film systems across diverse therapeutic categories.
The growing emphasis on patient compliance and serialization requirements will drive demand for advanced film varieties with enhanced barrier properties, improved processability credentials, and superior protection characteristics.
Between 2020 and 2024, the high barrier packaging films for pharmaceuticals market experienced robust growth, driven by increasing pharmaceutical innovation and growing recognition of barrier films' effectiveness in supporting drug stability across temperature-sensitive biologics and moisture-sensitive formulations.
The market developed as manufacturers recognized the potential for barrier films to deliver product integrity while meeting modern requirements for oxygen transmission rates and cost-effective production patterns. Technological advancement in coating technologies and lamination practices began emphasizing the critical importance of maintaining barrier performance while enhancing converting efficiency and improving material utilization.
From 2030 to 2035, the market is forecast to grow from USD 13.8 billion to USD 21.3 billion, adding another USD 7.5 billion, which constitutes 60.5% of the overall ten-year expansion. This period is expected to be characterized by the advancement of transparent barrier coatings, the integration of smart packaging indicators for authenticity verification, and the development of compostable barrier solutions for environmental compliance applications.
The growing emphasis on regulatory harmonization and global supply chain security will drive demand for premium varieties with enhanced counterfeit-resistance credentials, improved track-and-trace capabilities, and superior performance characteristics.
Between 2020 and 2024, the high barrier packaging films for pharmaceuticals market experienced significant growth, driven by increasing awareness of drug stability requirements and growing recognition of barrier films' effectiveness in supporting pharmaceutical distribution across emerging markets and temperature-variable supply chains.
The market developed as users recognized the potential for barrier films to deliver therapeutic efficacy while meeting modern requirements for moisture vapor transmission rates and reliable sealing practices. Technological advancement in vacuum deposition processes and quality control systems began emphasizing the critical importance of maintaining barrier uniformity while extending product shelf life and improving patient safety across diverse pharmaceutical categories.
| Metric | Value |
|---|---|
| Estimated Market Value (2025E) | USD 8.9 Billion |
| Forecast Market Value (2035F) | USD 21.3 Billion |
| Forecast CAGR (2025–2035) | 9.10% |
Market expansion is being supported by the increasing global demand for advanced pharmaceutical protection and the corresponding shift toward specialized packaging materials that can provide superior barrier characteristics while meeting regulatory requirements for drug stability and material-efficient production processes.
Modern pharmaceutical companies are increasingly focused on incorporating packaging formats that can enhance therapeutic efficacy while satisfying demands for consistent, reliably performing films and optimized supply chain practices. High barrier films' proven ability to deliver moisture protection, oxygen barrier properties, and diverse application possibilities makes them essential packaging for drug manufacturers and quality-conscious pharmaceutical brands.
The growing emphasis on biologics packaging and temperature-sensitive formulations is driving demand for high-performance barrier film systems that can support distinctive product positioning and comprehensive brand protection across injectable drugs, oral solid dosages, and specialized therapeutic categories.
User preference for films that combine functional excellence with converting flexibility is creating opportunities for innovative implementations in both traditional and emerging pharmaceutical applications. The rising influence of regulatory compliance standards and global distribution requirements is also contributing to increased adoption of barrier films that can provide authentic performance benefits and reliable protection characteristics.
The market is segmented by material type, barrier level, application, thickness range, and region. By material type, the market is divided into metallized films, aluminum oxide coated films, silicon oxide coated films, and PVDC coated films. Based on barrier level, the market is categorized into ultra-high barrier, high barrier, medium barrier, and standard barrier.
By application, the market includes blister packaging, strip packaging, sachet packaging, and pouch packaging. By thickness range, the market encompasses below 50 microns, 50-100 microns, 100-200 microns, and above 200 microns. Regionally, the market is divided into North America, Europe, Asia Pacific, Latin America, Middle East & Africa, and other regions.
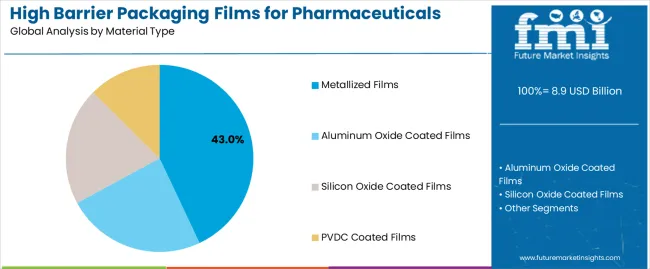
The metallized films segment is projected to account for 43% of the high barrier packaging films for pharmaceuticals market in 2025, reaffirming its position as the leading material category. Pharmaceutical manufacturers and packaging converters increasingly utilize metallized films for their superior moisture barrier characteristics, established processing compatibility, and essential functionality in protecting sensitive drug formulations across multiple therapeutic categories.
Metallized films' standardized barrier characteristics and proven cost-effectiveness directly address user requirements for reliable drug protection and optimal packaging value in pharmaceutical applications.
This material segment forms the foundation of modern pharmaceutical barrier packaging patterns, as it represents the format with the greatest commercial scalability potential and established compatibility across multiple packaging equipment systems. Business investments in vacuum metallization technology and quality standardization continue to strengthen adoption among compliance-conscious manufacturers.
With users prioritizing barrier performance and material optimization, metallized films align with both regulatory objectives and protection requirements, making them the central component of comprehensive pharmaceutical packaging strategies.
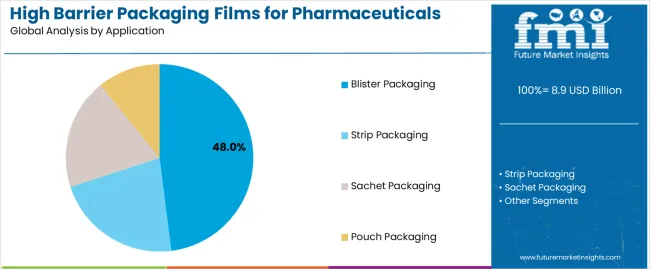
Blister packaging is projected to represent 48% of the high barrier packaging films for pharmaceuticals market in 2025, underscoring its critical role as the primary application for quality-focused manufacturers seeking superior product protection benefits and enhanced patient compliance credentials.
Pharmaceutical companies and contract packagers prefer blister packaging applications for their established dosing accuracy, proven tamper-evidence features, and ability to maintain exceptional stability profiles while supporting unit-dose dispensing during diverse treatment regimens. Positioned as essential applications for discerning manufacturers, blister packaging offerings provide both therapeutic protection excellence and patient adherence advantages.
The segment is supported by continuous improvement in cold-form technology and the widespread availability of established regulatory frameworks that enable pharmaceutical safety compliance and premium positioning at the pharmacy level.
Additionally, packaging companies are optimizing film structures to support product differentiation and accessible medication delivery strategies. As pharmaceutical technology continues to advance and patients seek convenient dosing formats, blister packaging applications will continue to drive market growth while supporting medication adherence and therapeutic outcome strategies.
The high barrier packaging films for pharmaceuticals market is advancing rapidly due to increasing drug stability consciousness and growing need for protective packaging choices that emphasize superior barrier performance outcomes across biologic formulations and specialty pharmaceutical applications.
However, the market faces challenges, including material cost pressures, regulatory complexity across global markets, and technical requirements for maintaining barrier properties during converting processes. Innovation in coating technology integration and advanced lamination systems continues to influence market development and expansion patterns.
The growing adoption of high barrier packaging films in biologics and biosimilar packaging is enabling manufacturers to develop protection patterns that provide distinctive stability preservation benefits while commanding regulatory compliance positioning and enhanced therapeutic effectiveness characteristics.
Biologic applications provide superior moisture protection properties while allowing more sophisticated serialization features across various drug categories. Users are increasingly recognizing the functional advantages of barrier film positioning for premium therapeutic protection and efficiency-conscious distribution integration.
Modern barrier film manufacturers are incorporating advanced active packaging technologies, moisture-scavenging systems, and intelligent indicators to enhance drug stability, improve patient safety outcomes, and meet commercial demands for comprehensive pharmaceutical protection solutions.
These systems improve therapeutic effectiveness while enabling new applications, including time-temperature monitoring and authenticity verification programs. Advanced active packaging integration also allows manufacturers to support patient safety leadership positioning and regulatory compliance beyond traditional packaging operations.
| Country | CAGR (2025–2035) |
|---|---|
| USA | 8.9% |
| Germany | 8.4% |
| UK | 8.1% |
| China | 11.2% |
| Japan | 7.8% |
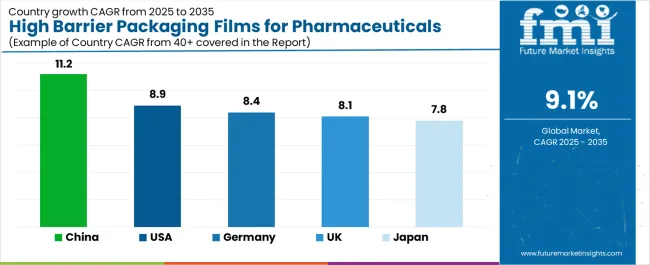
The high barrier packaging films for pharmaceuticals market is experiencing robust growth globally, with China leading at an 11.2% CAGR through 2035, driven by the expanding pharmaceutical manufacturing sector, growing generic drug production, and increasing adoption of advanced packaging technologies.
The USA follows at 8.9%, supported by rising biologics commercialization, expanding specialty pharmaceutical applications, and growing acceptance of innovative barrier solutions. Germany shows growth at 8.4%, emphasizing established pharmaceutical excellence and comprehensive packaging development.
The UK records 8.1%, focusing on premium drug delivery systems and regulatory compliance expansion. Japan demonstrates 7.8% growth, prioritizing quality pharmaceutical solutions and technological advancement.
The report covers an in-depth analysis of 40+ countries top-performing countries are highlighted below.
Revenue from high barrier packaging films for pharmaceuticals consumption and sales in the USA is projected to exhibit exceptional growth with a CAGR of 8.9% through 2035, driven by the country's rapidly expanding biologics sector, favorable regulatory environment for innovative drug delivery, and initiatives promoting advanced packaging optimization across major pharmaceutical regions.
The USA's position as a leading pharmaceutical innovation market and increasing focus on specialized therapeutic development are creating substantial demand for high-quality barrier films in both commercial and clinical markets. Major pharmaceutical companies and contract manufacturers are establishing comprehensive packaging capabilities to serve growing demand and emerging therapeutic opportunities.
Revenue from high barrier packaging films for pharmaceuticals products in Germany is expanding at a CAGR of 8.4%, supported by rising pharmaceutical sophistication, growing biosimilar production requirements, and expanding packaging infrastructure.
The country's developing technical capabilities and increasing commercial investment in advanced barrier technologies are driving demand for pharmaceutical films across both imported and domestically produced applications. International pharmaceutical companies and domestic packagers are establishing comprehensive operational networks to address growing market demand for quality barrier films and efficient protection solutions.
Revenue from high barrier packaging films for pharmaceuticals products in the UK is projected to grow at a CAGR of 8.1% through 2035, supported by the country's mature pharmaceutical market, established regulatory culture, and leadership in packaging standards.
Britain's sophisticated pharmaceutical infrastructure and strong support for innovation are creating steady demand for both traditional and innovative barrier film varieties. Leading pharmaceutical brands and specialty packagers are establishing comprehensive operational strategies to serve both domestic markets and growing export opportunities.
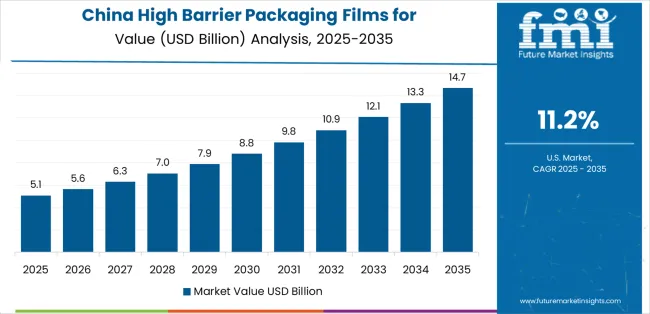
Revenue from high barrier packaging films for pharmaceuticals products in China is projected to grow at a CAGR of 11.2% through 2035, driven by the country's emphasis on pharmaceutical expansion, manufacturing leadership, and sophisticated production capabilities for films requiring specialized barrier varieties.
Chinese manufacturers and pharmaceutical companies consistently seek commercial-grade packaging that enhances product differentiation and supports distribution operations for both traditional and innovative therapeutic applications. The country's position as an Asian manufacturing leader continues to drive innovation in specialty barrier film applications and commercial production standards.
Revenue from high barrier packaging films for pharmaceuticals products in Japan is projected to grow at a CAGR of 7.8% through 2035, supported by the country's emphasis on quality pharmaceutical manufacturing, packaging standards, and advanced technology integration requiring efficient protection solutions.
Japanese pharmaceutical companies and drug brands prioritize barrier performance and manufacturing precision, making barrier films essential packaging for both traditional and modern therapeutic applications. The country's comprehensive quality excellence and advancing pharmaceutical patterns support continued market expansion.
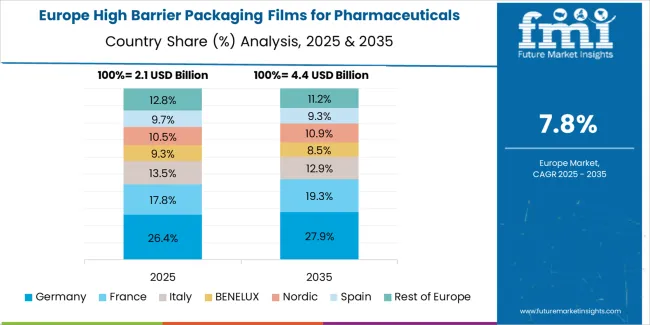
The Europe high barrier packaging films for pharmaceuticals market is projected to grow from USD 3.1 billion in 2025 to USD 7.2 billion by 2035, recording a CAGR of 8.8% over the forecast period. Germany leads the region with a 34.0% share in 2025, moderating slightly to 33.5% by 2035, supported by its strong pharmaceutical manufacturing base and demand for premium, technically advanced barrier solutions.
The United Kingdom follows with 20.0% in 2025, easing to 19.5% by 2035, driven by a sophisticated pharmaceutical market and emphasis on regulatory compliance and barrier performance standards. France accounts for 17.0% in 2025, rising to 17.5% by 2035, reflecting steady adoption of advanced barrier technologies and pharmaceutical innovation.
Italy holds 13.0% in 2025, expanding to 13.5% by 2035 as specialty pharmaceutical applications and contract manufacturing grow. Spain contributes 8.5% in 2025, growing to 9.0% by 2035, supported by expanding generic pharmaceutical sector and packaging modernization.
The Nordic countries rise from 4.5% in 2025 to 4.8% by 2035 on the back of strong pharmaceutical innovation and advanced barrier technologies. BENELUX declines from 3.0% in 2025 to 2.2% by 2035, reflecting market maturity and consolidation trends.
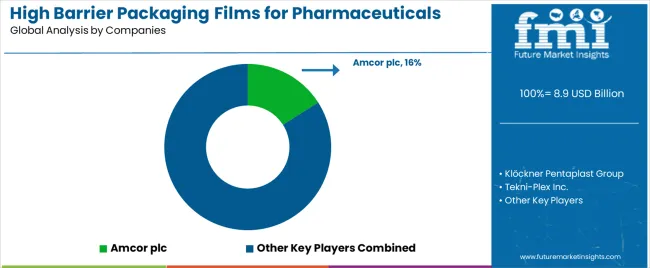
The high barrier packaging films for pharmaceuticals market is characterized by competition among established packaging manufacturers, specialized film producers, and integrated material solution companies. Companies are investing in coating technologies, advanced lamination systems, product innovation capabilities, and comprehensive converting networks to deliver consistent, high-quality, and reliable barrier film systems. Innovation in barrier enhancement, moisture protection methods, and application-specific product development is central to strengthening market position and customer satisfaction.
Amcor plc leads the market with a strong focus on pharmaceutical innovation and comprehensive barrier film solutions, offering commercial packaging systems with emphasis on regulatory excellence and technological heritage.
Klöckner Pentaplast Group provides specialized pharmaceutical capabilities with a focus on global market applications and barrier engineering networks. Tekni-Plex Inc. delivers integrated rigid and flexible solutions with a focus on pharmaceutical positioning and operational efficiency.
Constantia Flexibles specializes in comprehensive pharmaceutical packaging with an emphasis on commercial applications. Wipak Group focuses on comprehensive medical and pharmaceutical films with advanced barrier design and premium positioning capabilities.
The success of high barrier packaging films in meeting pharmaceutical protection demands, patient-driven safety requirements, and regulatory integration will not only enhance therapeutic outcomes but also strengthen global pharmaceutical packaging capabilities.
It will consolidate emerging regions' positions as hubs for efficient pharmaceutical production and align advanced economies with commercial packaging systems. This calls for a concerted effort by all stakeholders - governments, industry bodies, manufacturers, distributors, and investors. Each can be a crucial enabler in preparing the market for its next phase of growth.
| Item | Value |
|---|---|
| Quantitative Units (2025) | USD 8.9 Billion |
| Material Type | Metallized Films; Aluminum Oxide Coated Films; Silicon Oxide Coated Films; PVDC Coated Films |
| Barrier Level | Ultra-High Barrier; High Barrier; Medium Barrier; Standard Barrier |
| Application | Blister Packaging; Strip Packaging; Sachet Packaging; Pouch Packaging |
| Thickness Range | Below 50 Microns; 50–100 Microns; 100–200 Microns; Above 200 Microns |
| Regions | North America; Europe; Asia Pacific; Latin America; Middle East & Africa; Other Regions |
| Key Countries | United States; Germany; United Kingdom; China; Japan; and 40+ additional countries |
| Key Companies | Amcor plc; Klöckner Pentaplast Group; Tekni-Plex Inc.; Constantia Flexibles; Wipak Group; other leading barrier film companies |
| Additional Attributes | Dollar sales by material type, barrier level, application, thickness range, and region; Regional demand trends; Competitive landscape; Technological advancements in coating engineering; Barrier enhancement initiatives; Moisture protection programs; Premium product development strategies |
The global high barrier packaging films for pharmaceuticals market is estimated to be valued at USD 8.9 billion in 2025.
The market size for the high barrier packaging films for pharmaceuticals market is projected to reach USD 21.3 billion by 2035.
The high barrier packaging films for pharmaceuticals market is expected to grow at a 9.1% CAGR between 2025 and 2035.
The key product types in high barrier packaging films for pharmaceuticals market are metallized films, aluminum oxide coated films, silicon oxide coated films and pvdc coated films.
In terms of application, blister packaging segment to command 48.0% share in the high barrier packaging films for pharmaceuticals market in 2025.


Full Research Suite comprises of:
Market outlook & trends analysis
Interviews & case studies
Strategic recommendations
Vendor profiles & capabilities analysis
5-year forecasts
8 regions and 60+ country-level data splits
Market segment data splits
12 months of continuous data updates
DELIVERED AS:
PDF EXCEL ONLINE
Competitive Landscape of High Barrier Packaging Films for Pharmaceuticals
High Voltage Equipment Market Forecast and Outlook 2025 to 2035
High Clear Film Market Size and Share Forecast Outlook 2025 to 2035
High Precision Microfluidic Pump Market Size and Share Forecast Outlook 2025 to 2035
High Temperature Heat Pump Dryers Market Size and Share Forecast Outlook 2025 to 2035
High Temperature Fiberglass Filter Media Market Size and Share Forecast Outlook 2025 to 2035
High Purity Tungsten Hexachloride Market Size and Share Forecast Outlook 2025 to 2035
High Purity Nano Aluminum Oxide Powder Market Size and Share Forecast Outlook 2025 to 2035
High Mast Lighting Market Forecast and Outlook 2025 to 2035
High-Protein Pudding Market Forecast and Outlook 2025 to 2035
High Voltage Ceramic Zinc Oxide Surge Arrester Market Size and Share Forecast Outlook 2025 to 2035
High-Power Microwave Source Market Size and Share Forecast Outlook 2025 to 2035
High Molecular Ammonium Polyphosphate Market Size and Share Forecast Outlook 2025 to 2035
High Throughput Screening Market Size and Share Forecast Outlook 2025 to 2035
High Purity Carbonyl Iron Powder (CIP) Market Size and Share Forecast Outlook 2025 to 2035
High Voltage PTC Heater Market Size and Share Forecast Outlook 2025 to 2035
High Temperature Grease Market Size and Share Forecast Outlook 2025 to 2035
High Frequency Chest-Wall Oscillation Devices Market Size and Share Forecast Outlook 2025 to 2035
High-purity Fluoropolymer Valves Market Size and Share Forecast Outlook 2025 to 2035
High Current Ion Implanter Market Size and Share Forecast Outlook 2025 to 2035

Thank you!
You will receive an email from our Business Development Manager. Please be sure to check your SPAM/JUNK folder too.
Chat With
MaRIA