High Pressure Seal Market Outlook 2025 to 2035

The global high pressure seal market is projected to reach a value of USD 5,612.6 million in 2025 and grow to USD 9,352.3 million by 2035, expanding at a CAGR of 5.3% during the forecast period.
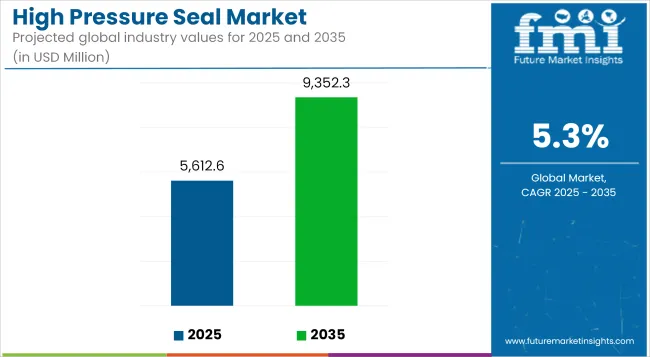
Quick Stats for Global High Pressure Seal Market

  • Industry Value (2025): USD 5,612.6 million
  • Forecast Value (2035): USD 9,352.3 million
  • Forecast CAGR (2025-2035): 5.3%
  • Leading Segment in 2025: Oil & Gas (32% share)
  • Key Growth Regions: Asia Pacific, North America, Western Europe, Middle East
  • Top Key Players: Parker Hannifin Corp, SKF Group, Flowserve Corporation, James Walker & Co., Freudenberg Sealing Technologies, Trelleborg AB, John Crane, EagleBurgmann, Garlock Sealing Technologies, and Bal Seal Engineering.

High Pressure Seal Market   Industry Value Analysis

Market Metrics Value
Industry Size (2025E) USD 5,612.6 million
Industry Value (2035F) UD 9,352.3 million
CAGR (2025 to 2035) 5.3%

High pressure seals are critical components used in machinery and equipment operating under extreme pressure conditions, offering leak-proof performance in industrial, oil & gas, aerospace, chemical, and power generation applications.

Asia Pacific is projected to hold the largest share of the global high pressure seal market by 2025, driven by expanding manufacturing output, energy infrastructure upgrades, and strong automotive and chemical processing sectors in China, India, and Southeast Asia. Rapid industrialization and increased investment in oil & gas refineries and power generation facilities are creating favorable demand conditions for high-pressure sealing solutions.

Governments in the region are heavily investing in infrastructure, contributing to rising demand for hydraulic and pneumatic systems, which rely on high pressure seals. Additionally, the growing aerospace and marine equipment manufacturing sector in countries like South Korea and Japan adds to the region’s leading position.

Manufacturers are increasingly using advanced materials like PTFE, PEEK, and metal-polymer composites to enhance seal durability under extreme pressure and temperature. These materials offer superior resistance to corrosion, wear, and aggressive chemicals, making them ideal for aerospace, oil & gas, and nuclear applications.

The trend toward low-maintenance, high-performance sealing systems is also driving adoption of self-lubricating and multi-lip seal designs, which extend equipment life and reduce operational downtime.

With the global shift toward clean energy, high pressure seals are seeing increased use in hydrogen systems, wind turbines, and carbon capture units. These applications require precise, leak-proof seals to operate under high pressure with zero emissions.

Manufacturers are innovating seals that withstand hydrogen embrittlement and extreme cyclic loads, aligning with rising investments in green hydrogen and offshore wind projects. This trend is opening new revenue streams for seal producers.

A significant trend in the high pressure seal market is the ongoing innovation in sealing materials and design. The shift toward composite seals, elastomers, thermoplastics (PTFE, PEEK), and metallic hybrid designs is allowing manufacturers to meet increasingly demanding pressure, temperature, and chemical resistance requirements.

Advanced designs featuring multi-lip geometries and self-lubricating properties are being deployed in critical systems such as hydraulic cylinders, turbo machinery, and compressors.

Companies are also integrating smart seals with embedded sensors for real-time pressure and wear monitoring. These developments are improving seal performance, lifespan, and safety in high-load applications. Adoption is especially high in aerospace, oil & gas, and power generation.

Analyzing Global High Pressure Seal Market by Top Investing Segments

Oil & Gas Segment Leads Market by Application

The oil & gas segment is forecasted to hold the largest share of 32% in the global high pressure seal market in 2025 and is expected to grow at a CAGR of 4.9% through 2035. High pressure seals are vital in upstream and downstream processes, including drilling, well completion, pumps, and compressors.

With rising energy demand and increased investments in deep-water and ultra-deep-water exploration, high-performance sealing systems are essential for operational safety and efficiency.

The Middle East, USA, and offshore Africa are key regions driving oilfield equipment demand. Enhanced exploration activity, along with the revival of delayed refinery projects post-pandemic, continues to stimulate demand for reliable sealing solutions in this sector.
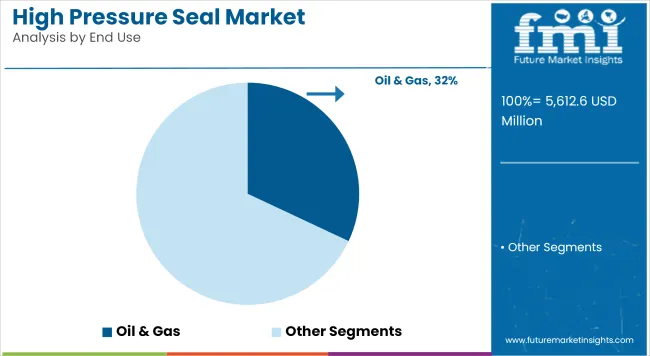
High Pressure Seal Market   Analysis By End Use

Metal Seals to Dominate Market by Material Type

Metal seals are projected to dominate the high pressure seal market, holding a market share of 38% in 2025, expanding at a CAGR of 4.7% over the forecast period. Their superior pressure, temperature, and chemical resistance make them ideal for use in harsh environments such as nuclear power plants, aerospace propulsion systems, and petrochemical units. Compared to elastomer-based seals, metal seals offer longer operational life, improved stability, and zero leakage in extreme conditions.

Companies are focusing on alloy innovation, including Inconel, stainless steel, and Hastelloy-based designs, to enhance performance. With increasing industrial automation and stringent safety regulations, the demand for robust metal seals is steadily rising across global markets.
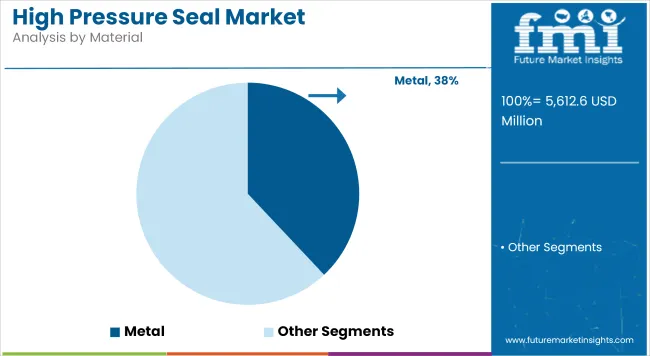
High Pressure Seal Market   Analysis By Material

Country-Wise Analysis (2025 to 2035)

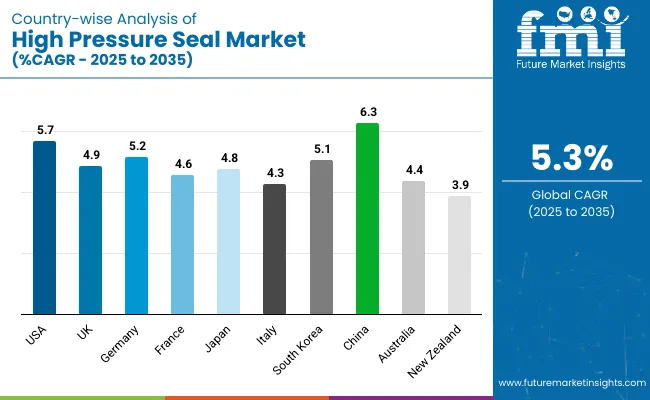
High Pressure Seal Market Country Wise

Countries CAGR (2025 to 2035)
USA 5.7%
UK 4.9%
France 4.6%
Germany 5.2%
Italy 4.3%
South Korea 5.1%
Japan 4.8%
China 6.3%
Australia 4.4%
New Zealand 3.9%

USA

The USA industry is anticipated to expand steadily through 2035 due to continued investment in the oil and gas, aerospace, and power generation industries. The nation's industrial base is sophisticated but dynamic, and demand for high-performance sealing technology will continue to grow, especially in offshore drilling platforms and nuclear plants.

The trend in the industry is driven by the application of high-performance materials that are resistant to extreme conditions, resulting in enhanced operation reliability and lifespan.

Some of the key players in the USA are Parker Hannifin Corporation, John Crane, and Flowserve Corporation, which keep refining their product offerings through R&D and acquisition strategy. Regulatory needs for environment safety and minimizing emissions are also compelling industrial divisions to shift from conventional sealing arrangements to better high pressure seals. Such an ecosystem encourages innovation and product differentiation, resulting in enhanced industry competitiveness.

UK

UK’sindustry is all set to expand with ongoing innovation in the defense, marine engineering, and energy industries. The decarbonization process and development of clean energy in the nation have opened up more demand for high pressure seals in hydrogen storage units and newer windmills. Heavy industry equipment relocation also favors the inclusion of efficient and long-lasting sealing systems.

Industry leaders include James Walker Group and Trelleborg Sealing Solutions, both of which are heavily investing in engineered seal technologies. Growth is also augmented by extensive cooperation between material research institutes specializing in advanced materials and industrial manufacturing companies. Through automation and digitalization, while the UK retains its industrial power, demand for reliable sealing solutions is predicted to grow during the forecast period.

France

French industry is projected to see modest growth in the period until 2035 as the nation has a leadership role in nuclear energy, chemical processing, and aircraft production. Machines' dependence on highly precise devices gives push to the increasing requirement for seals against extreme pressure and temperature fluctuations. Aerospace specifically benefits from sealing components that are lightweight yet tough enough to optimize engine efficiency.

Industry leaders like Hutchinson SA and Saint-Gobain Performance Plastics are increasing manufacturing capacity with an emphasis on sustainability and lifecycle efficiency. The use of fluoropolymer-based and elastomeric seals in high-value applications is gaining wider ground. Government-supported innovation policies also facilitate industry growth with the aim of enhancing industrial competitiveness.

Germany

Germany's industry will experience strong growth due to its highly sophisticated manufacturing base and the presence of a highly sophisticated mechanical engineering industry. Higher demand by the automobile, energy, and process industries supports more use of precision seals, especially in gas turbines and high-pressure hydraulic equipment. The policy of energy transition (Energiewende) also promotes investment in efficient sealing technology on renewable equipment.

Industry leaders like Freudenberg Sealing Technologies and SKF GmbH are out to create high-performance, low-emission sealing systems, especially for high-load applications. Focus on digitization and Industry 4.0 is driving the move towards predictive maintenance, with seals of high pressure playing a central role in keeping systems offline for as little time as possible while achieving optimum performance. These pressures make Germany a technological powerhouse in the European industry.

Italy

Italian industry is likely to grow incrementally on the back of industrial requirements in the petrochemical, energy, and water treatment segment of applications. With Italian infrastructure still being refurbished, most importantly pipeline infrastructure and power plant equipment, requirements for leak-proof and high-durability sealing increase. The use of fluid-handling equipment and pressurized vessels continues to be at the core of the industry's growth prospects.

Companies like Tenute Srl and Guarnitec are capitalizing on advancements in material science to develop seals with enhanced abrasion and chemical resistance. The general shift towards environmentally friendly industrial practices has also prompted the use of the next generation of sealing materials. Increasingly strict safety specifications for industrial processes mean that high pressure seals will continue to play a key role in process-based industries.

South Korea

South Korea's industry is expected to expand at a significant rate, driven by increased demand from shipbuilding, electronics production, and energy infrastructure. Highly precise seals are increasingly being used because of strong domestic investment in semiconductor manufacturing units that have tight environmental requirements. South Korea's shipbuilding sector also heavily depends on high-pressure parts for propulsion and fluid control systems.

Industry leaders like Samsung Engineering and Sealtech Korea are enhancing their capability to address high-performance requirements. Technology innovation is also receiving government support in the form of industrial automation and clean energy transition policy. As South Korea continues to modernize heavy industries increasingly, long-lasting, efficient high pressure seal applications are sure to become more prevalent.

Japan

Japan's industry will continue to increase steadily, pushed by technological growth in the precision engineering, aerospace, and automobile industries. Product quality, reliability, and energy efficiency are promoted in the country, which leads to the usage of seals that guarantee consistent performance in high-load and high-temperature applications. Usage is most prominent in robots and industrial automation systems, where consistent sealing under dynamic conditions is required.

Industry trends are led by industry leaders such as NOK Corporation and Eagle Industry Co., Ltd., which are highly committed to investing in high-quality polymer and composite seal technologies. Japan's research-oriented innovation bias guarantees ongoing seal design enhancement that minimizes friction and maximizes operating life. The emphasis on high-value engineering solutions sustains Japan's industry resilience, and it is anindustry leader in the Asia-Pacific region.

China

The Chinese industry is also expected to exhibit the highest CAGR among researched countries, fueled by rapid industrialization, growing energy infrastructure, and moving manufacturing processes. Huge investment in petrochemicals, aircraft, and high-speed rail sectors is creating colossal demand for performance-enhanced sealing technologies. Specifically, oil and gas explorations by native activities necessitate advanced seal solutions under unfavorable pressure conditions.

Local producers such as Zhongding Group and DSH Seals are fast developing their technological capability and export performances. Industrial upgrades and environmental protection policies are fostering the implementation of effective and long-term seal systems. As greater attention is paid to quality and reliability, China is increasingly turning into an essential driver of worldwide industry growth.

Australia

Australian industry is poised to expand steadily with backing from investment in mining, oil and gas, and water management companies. Conditions of deep drilling mining operations and operational conditions of onshore and offshore drilling rigs necessitate the application of seals that are resistant to abrasive conditions and extreme hydraulic pressure. Continued infrastructure development, especially in remote locations, continues to generate demand for tough sealing solutions for mobile equipment and energy equipment.

Key industry players in this industry include Australian Seals and Seal Innovations, which are concentrating on application-specific sealing solutions. Composite material development and design optimization are improving product performance and value lifecycle. The country's continued emphasis on operational safety and environmental compliance is also driving the industry outlook during the forecast period.

New Zealand

New Zealand's industry is expected to grow moderately, as it is led by infrastructure development, farm processing, and environmental engineering use. Increased use of high-performance seals in water treatment plants, geothermal energy production, and food processing equipment due to the country's focus on green industrial processes has created the impetus for growth. While smaller in magnitude, the industry has sound prospects for specialty sealing products.

Other local manufacturers and suppliers are interfacing with international providers to provide improved sealing technologies appropriate for remote and extreme duty conditions. Dependability, lower maintenance requirements, and sustained performance are influencing buying behavior. Greater infrastructure development and industrial upgrades underway will result in consistent growth in the industry for advanced technical high pressure seals.

Competitive Outlook

The global high pressure seal market is highly competitive and moderately consolidated, with leading companies focusing on R&D, material innovation, and global expansion strategies. Players like Parker Hannifin, Trelleborg, Freudenberg, and SKF are continuously investing in high-performance materials and customized sealing solutions for mission-critical operations.

Strategic initiatives such as acquisitions, product line expansions, and regional manufacturing hubs are being deployed to serve industry-specific needs. The growing demand for eco-friendly, leak-free, and maintenance-free seals is prompting companies to prioritize sustainable design.

Emerging players, particularly in Asia Pacific and Latin America, are gaining traction through cost-effective offerings. Overall, technological leadership, product durability, and compliance with industry certifications will remain key competitive differentiators.
  • In January 2025: Launched the Stefa® high‑pressure radial shaft seal (HPRSS) portfolio, including HP20, HP20S, SPS‑HP20, SPV, and upgraded TRP models. These seals accommodate pressures up to 20 MPa and speeds up to 17 m/s, with advanced geometries for misalignment and pressure spikes
  • In October 2024 Garlock Sealing Technologies LLC: Launched the PS-SEAL® family, a new line of high-performance PTFE/GYLON® shaft seals designed for high circumferential speeds and extreme pressure-temperature conditions. These seals are suited for demanding applications in food processing, pharmaceuticals, chemicals, and vacuum systems.

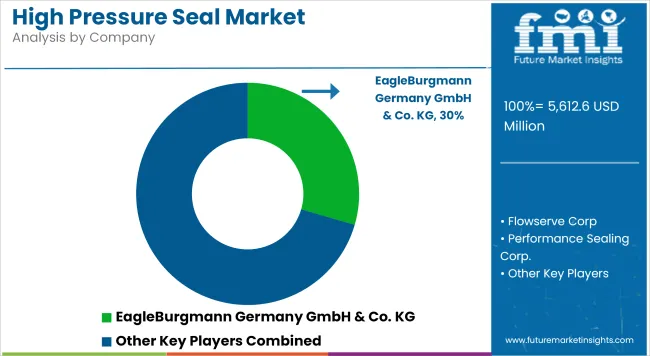
High Pressure Seal Market   Analysis By Company

Companies

  • EagleBurgmann Germany GmbH & Co. KG
  • Flowserve Corp
  • Performance Sealing Corp.
  • Parker Hannifin Corporation
  • James Walker & Co
  • AB SKF
  • Garlock Sealing Technologies LLC
  • Smiths Group plc. ( John Crane)
  • Trelleborg Sealing Solutions
  • Bal Seal Engineering

Segmentation

By Material:

By material, the industry is segmented into various materials including metal, Thermoplastic Polyurethane (TPU), Hydrogenated Nitrile Butadiene Rubber (HBR), fluorocarbon-based synthetic rubber, and Ethylene Propylene Diene Monomer (EPDM).

By End Use:

By end use, the industry serves a wide range of industries such as oil & gas, chemicals, automotive, mining, aerospace, power generation, healthcare, and others.

By Region:

By region, the industry is analyzed across several regions including North America, Latin America, Western Europe, Eastern Europe, South Asia and Pacific, East Asia, and the Middle East & Africa.

Table of Content

  1. Executive Summary
  2. Market Overview
  3. Market Background
  4. Global Market Analysis 2020 to 2024 and Forecast, 2025 to 2035
  5. Global Market Analysis 2020 to 2024 and Forecast 2025 to 2035, By Material
    • Metal
    • Thermoplastic Polyurethane (TPU)
    • Hydrogenated Nitrile Butadiene Rubber (HBR)
    • Fluorocarbon-based Synthetic Rubber
    • Ethylene propylene dyne terpolymer (EPDM)
  6. Global Market Analysis 2020 to 2024 and Forecast 2025 to 2035, By End Use
    • Oil & Gas
    • Chemicals
    • Automotive
    • Mining
    • Aerospace
    • Power Generation
    • Healthcare
    • Others
  7. Global Market Analysis 2020 to 2024 and Forecast 2025 to 2035, By Region
    • North America
    • Latin America
    • Western Europe
    • Eastern Europe
    • South Asia and Pacific
    • East Asia
    • Middle East and Africa
  8. North America Market Analysis 2020 to 2024 and Forecast 2025 to 2035, By Country
  9. Latin America Market Analysis 2020 to 2024 and Forecast 2025 to 2035, By Country
  10. Western Europe Market Analysis 2020 to 2024 and Forecast 2025 to 2035, By Country
  11. Eastern Europe Market Analysis 2020 to 2024 and Forecast 2025 to 2035, By Country
  12. South Asia and Pacific Market Analysis 2020 to 2024 and Forecast 2025 to 2035, By Country
  13. East Asia Market Analysis 2020 to 2024 and Forecast 2025 to 2035, By Country
  14. Middle East and Africa Market Analysis 2020 to 2024 and Forecast 2025 to 2035, By Country
  15. Key Countries Market Analysis
  16. Market Structure Analysis
  17. Competition Analysis
    • AES Corporation
    • Smith’s Group Plc.
    • Garlock Sealing Technologies LLC
    • AB SKF
    • James Walker & Co
    • Parker Hannifin Corporation
    • EagleBurgmann Germany GmbH & Co. KG
    • Flowserve Corp.
    • Performance Sealing Corp.
    • EI du Pont de Nemours & Co.
  18. Assumptions & Acronyms Used
  19. Research Methodology

List of Tables

  • Table 1: Global Market Value (USD Million) Forecast by Region, 2020 to 2035
  • Table 2: Global Market Volume (Units) Forecast by Region, 2020 to 2035
  • Table 3: Global Market Value (USD Million) Forecast by Material, 2020 to 2035
  • Table 4: Global Market Volume (Units) Forecast by Material, 2020 to 2035
  • Table 5: Global Market Value (USD Million) Forecast by End Use, 2020 to 2035
  • Table 6: Global Market Volume (Units) Forecast by End Use, 2020 to 2035
  • Table 7: North America Market Value (USD Million) Forecast by Country, 2020 to 2035
  • Table 8: North America Market Volume (Units) Forecast by Country, 2020 to 2035
  • Table 9: North America Market Value (USD Million) Forecast by Material, 2020 to 2035
  • Table 10: North America Market Volume (Units) Forecast by Material, 2020 to 2035
  • Table 11: North America Market Value (USD Million) Forecast by End Use, 2020 to 2035
  • Table 12: North America Market Volume (Units) Forecast by End Use, 2020 to 2035
  • Table 13: Latin America Market Value (USD Million) Forecast by Country, 2020 to 2035
  • Table 14: Latin America Market Volume (Units) Forecast by Country, 2020 to 2035
  • Table 15: Latin America Market Value (USD Million) Forecast by Material, 2020 to 2035
  • Table 16: Latin America Market Volume (Units) Forecast by Material, 2020 to 2035
  • Table 17: Latin America Market Value (USD Million) Forecast by End Use, 2020 to 2035
  • Table 18: Latin America Market Volume (Units) Forecast by End Use, 2020 to 2035
  • Table 19: Western Europe Market Value (USD Million) Forecast by Country, 2020 to 2035
  • Table 20: Western Europe Market Volume (Units) Forecast by Country, 2020 to 2035
  • Table 21: Western Europe Market Value (USD Million) Forecast by Material, 2020 to 2035
  • Table 22: Western Europe Market Volume (Units) Forecast by Material, 2020 to 2035
  • Table 23: Western Europe Market Value (USD Million) Forecast by End Use, 2020 to 2035
  • Table 24: Western Europe Market Volume (Units) Forecast by End Use, 2020 to 2035
  • Table 25: Eastern Europe Market Value (USD Million) Forecast by Country, 2020 to 2035
  • Table 26: Eastern Europe Market Volume (Units) Forecast by Country, 2020 to 2035
  • Table 27: Eastern Europe Market Value (USD Million) Forecast by Material, 2020 to 2035
  • Table 28: Eastern Europe Market Volume (Units) Forecast by Material, 2020 to 2035
  • Table 29: Eastern Europe Market Value (USD Million) Forecast by End Use, 2020 to 2035
  • Table 30: Eastern Europe Market Volume (Units) Forecast by End Use, 2020 to 2035
  • Table 31: South Asia and Pacific Market Value (USD Million) Forecast by Country, 2020 to 2035
  • Table 32: South Asia and Pacific Market Volume (Units) Forecast by Country, 2020 to 2035
  • Table 33: South Asia and Pacific Market Value (USD Million) Forecast by Material, 2020 to 2035
  • Table 34: South Asia and Pacific Market Volume (Units) Forecast by Material, 2020 to 2035
  • Table 35: South Asia and Pacific Market Value (USD Million) Forecast by End Use, 2020 to 2035
  • Table 36: South Asia and Pacific Market Volume (Units) Forecast by End Use, 2020 to 2035
  • Table 37: East Asia Market Value (USD Million) Forecast by Country, 2020 to 2035
  • Table 38: East Asia Market Volume (Units) Forecast by Country, 2020 to 2035
  • Table 39: East Asia Market Value (USD Million) Forecast by Material, 2020 to 2035
  • Table 40: East Asia Market Volume (Units) Forecast by Material, 2020 to 2035
  • Table 41: East Asia Market Value (USD Million) Forecast by End Use, 2020 to 2035
  • Table 42: East Asia Market Volume (Units) Forecast by End Use, 2020 to 2035
  • Table 43: Middle East and Africa Market Value (USD Million) Forecast by Country, 2020 to 2035
  • Table 44: Middle East and Africa Market Volume (Units) Forecast by Country, 2020 to 2035
  • Table 45: Middle East and Africa Market Value (USD Million) Forecast by Material, 2020 to 2035
  • Table 46: Middle East and Africa Market Volume (Units) Forecast by Material, 2020 to 2035
  • Table 47: Middle East and Africa Market Value (USD Million) Forecast by End Use, 2020 to 2035
  • Table 48: Middle East and Africa Market Volume (Units) Forecast by End Use, 2020 to 2035

List of Figures

  • Figure 1: Global Market Value (USD Million) by Material, 2025 to 2035
  • Figure 2: Global Market Value (USD Million) by End Use, 2025 to 2035
  • Figure 3: Global Market Value (USD Million) by Region, 2025 to 2035
  • Figure 4: Global Market Value (USD Million) Analysis by Region, 2020 to 2035
  • Figure 5: Global Market Volume (Units) Analysis by Region, 2020 to 2035
  • Figure 6: Global Market Value Share (%) and BPS Analysis by Region, 2025 to 2035
  • Figure 7: Global Market Y-o-Y Growth (%) Projections by Region, 2025 to 2035
  • Figure 8: Global Market Value (USD Million) Analysis by Material, 2020 to 2035
  • Figure 9: Global Market Volume (Units) Analysis by Material, 2020 to 2035
  • Figure 10: Global Market Value Share (%) and BPS Analysis by Material, 2025 to 2035
  • Figure 11: Global Market Y-o-Y Growth (%) Projections by Material, 2025 to 2035
  • Figure 12: Global Market Value (USD Million) Analysis by End Use, 2020 to 2035
  • Figure 13: Global Market Volume (Units) Analysis by End Use, 2020 to 2035
  • Figure 14: Global Market Value Share (%) and BPS Analysis by End Use, 2025 to 2035
  • Figure 15: Global Market Y-o-Y Growth (%) Projections by End Use, 2025 to 2035
  • Figure 16: Global Market Attractiveness by Material, 2025 to 2035
  • Figure 17: Global Market Attractiveness by End Use, 2025 to 2035
  • Figure 18: Global Market Attractiveness by Region, 2025 to 2035
  • Figure 19: North America Market Value (USD Million) by Material, 2025 to 2035
  • Figure 20: North America Market Value (USD Million) by End Use, 2025 to 2035
  • Figure 21: North America Market Value (USD Million) by Country, 2025 to 2035
  • Figure 22: North America Market Value (USD Million) Analysis by Country, 2020 to 2035
  • Figure 23: North America Market Volume (Units) Analysis by Country, 2020 to 2035
  • Figure 24: North America Market Value Share (%) and BPS Analysis by Country, 2025 to 2035
  • Figure 25: North America Market Y-o-Y Growth (%) Projections by Country, 2025 to 2035
  • Figure 26: North America Market Value (USD Million) Analysis by Material, 2020 to 2035
  • Figure 27: North America Market Volume (Units) Analysis by Material, 2020 to 2035
  • Figure 28: North America Market Value Share (%) and BPS Analysis by Material, 2025 to 2035
  • Figure 29: North America Market Y-o-Y Growth (%) Projections by Material, 2025 to 2035
  • Figure 30: North America Market Value (USD Million) Analysis by End Use, 2020 to 2035
  • Figure 31: North America Market Volume (Units) Analysis by End Use, 2020 to 2035
  • Figure 32: North America Market Value Share (%) and BPS Analysis by End Use, 2025 to 2035
  • Figure 33: North America Market Y-o-Y Growth (%) Projections by End Use, 2025 to 2035
  • Figure 34: North America Market Attractiveness by Material, 2025 to 2035
  • Figure 35: North America Market Attractiveness by End Use, 2025 to 2035
  • Figure 36: North America Market Attractiveness by Country, 2025 to 2035
  • Figure 37: Latin America Market Value (USD Million) by Material, 2025 to 2035
  • Figure 38: Latin America Market Value (USD Million) by End Use, 2025 to 2035
  • Figure 39: Latin America Market Value (USD Million) by Country, 2025 to 2035
  • Figure 40: Latin America Market Value (USD Million) Analysis by Country, 2020 to 2035
  • Figure 41: Latin America Market Volume (Units) Analysis by Country, 2020 to 2035
  • Figure 42: Latin America Market Value Share (%) and BPS Analysis by Country, 2025 to 2035
  • Figure 43: Latin America Market Y-o-Y Growth (%) Projections by Country, 2025 to 2035
  • Figure 44: Latin America Market Value (USD Million) Analysis by Material, 2020 to 2035
  • Figure 45: Latin America Market Volume (Units) Analysis by Material, 2020 to 2035
  • Figure 46: Latin America Market Value Share (%) and BPS Analysis by Material, 2025 to 2035
  • Figure 47: Latin America Market Y-o-Y Growth (%) Projections by Material, 2025 to 2035
  • Figure 48: Latin America Market Value (USD Million) Analysis by End Use, 2020 to 2035
  • Figure 49: Latin America Market Volume (Units) Analysis by End Use, 2020 to 2035
  • Figure 50: Latin America Market Value Share (%) and BPS Analysis by End Use, 2025 to 2035
  • Figure 51: Latin America Market Y-o-Y Growth (%) Projections by End Use, 2025 to 2035
  • Figure 52: Latin America Market Attractiveness by Material, 2025 to 2035
  • Figure 53: Latin America Market Attractiveness by End Use, 2025 to 2035
  • Figure 54: Latin America Market Attractiveness by Country, 2025 to 2035
  • Figure 55: Western Europe Market Value (USD Million) by Material, 2025 to 2035
  • Figure 56: Western Europe Market Value (USD Million) by End Use, 2025 to 2035
  • Figure 57: Western Europe Market Value (USD Million) by Country, 2025 to 2035
  • Figure 58: Western Europe Market Value (USD Million) Analysis by Country, 2020 to 2035
  • Figure 59: Western Europe Market Volume (Units) Analysis by Country, 2020 to 2035
  • Figure 60: Western Europe Market Value Share (%) and BPS Analysis by Country, 2025 to 2035
  • Figure 61: Western Europe Market Y-o-Y Growth (%) Projections by Country, 2025 to 2035
  • Figure 62: Western Europe Market Value (USD Million) Analysis by Material, 2020 to 2035
  • Figure 63: Western Europe Market Volume (Units) Analysis by Material, 2020 to 2035
  • Figure 64: Western Europe Market Value Share (%) and BPS Analysis by Material, 2025 to 2035
  • Figure 65: Western Europe Market Y-o-Y Growth (%) Projections by Material, 2025 to 2035
  • Figure 66: Western Europe Market Value (USD Million) Analysis by End Use, 2020 to 2035
  • Figure 67: Western Europe Market Volume (Units) Analysis by End Use, 2020 to 2035
  • Figure 68: Western Europe Market Value Share (%) and BPS Analysis by End Use, 2025 to 2035
  • Figure 69: Western Europe Market Y-o-Y Growth (%) Projections by End Use, 2025 to 2035
  • Figure 70: Western Europe Market Attractiveness by Material, 2025 to 2035
  • Figure 71: Western Europe Market Attractiveness by End Use, 2025 to 2035
  • Figure 72: Western Europe Market Attractiveness by Country, 2025 to 2035
  • Figure 73: Eastern Europe Market Value (USD Million) by Material, 2025 to 2035
  • Figure 74: Eastern Europe Market Value (USD Million) by End Use, 2025 to 2035
  • Figure 75: Eastern Europe Market Value (USD Million) by Country, 2025 to 2035
  • Figure 76: Eastern Europe Market Value (USD Million) Analysis by Country, 2020 to 2035
  • Figure 77: Eastern Europe Market Volume (Units) Analysis by Country, 2020 to 2035
  • Figure 78: Eastern Europe Market Value Share (%) and BPS Analysis by Country, 2025 to 2035
  • Figure 79: Eastern Europe Market Y-o-Y Growth (%) Projections by Country, 2025 to 2035
  • Figure 80: Eastern Europe Market Value (USD Million) Analysis by Material, 2020 to 2035
  • Figure 81: Eastern Europe Market Volume (Units) Analysis by Material, 2020 to 2035
  • Figure 82: Eastern Europe Market Value Share (%) and BPS Analysis by Material, 2025 to 2035
  • Figure 83: Eastern Europe Market Y-o-Y Growth (%) Projections by Material, 2025 to 2035
  • Figure 84: Eastern Europe Market Value (USD Million) Analysis by End Use, 2020 to 2035
  • Figure 85: Eastern Europe Market Volume (Units) Analysis by End Use, 2020 to 2035
  • Figure 86: Eastern Europe Market Value Share (%) and BPS Analysis by End Use, 2025 to 2035
  • Figure 87: Eastern Europe Market Y-o-Y Growth (%) Projections by End Use, 2025 to 2035
  • Figure 88: Eastern Europe Market Attractiveness by Material, 2025 to 2035
  • Figure 89: Eastern Europe Market Attractiveness by End Use, 2025 to 2035
  • Figure 90: Eastern Europe Market Attractiveness by Country, 2025 to 2035
  • Figure 91: South Asia and Pacific Market Value (USD Million) by Material, 2025 to 2035
  • Figure 92: South Asia and Pacific Market Value (USD Million) by End Use, 2025 to 2035
  • Figure 93: South Asia and Pacific Market Value (USD Million) by Country, 2025 to 2035
  • Figure 94: South Asia and Pacific Market Value (USD Million) Analysis by Country, 2020 to 2035
  • Figure 95: South Asia and Pacific Market Volume (Units) Analysis by Country, 2020 to 2035
  • Figure 96: South Asia and Pacific Market Value Share (%) and BPS Analysis by Country, 2025 to 2035
  • Figure 97: South Asia and Pacific Market Y-o-Y Growth (%) Projections by Country, 2025 to 2035
  • Figure 98: South Asia and Pacific Market Value (USD Million) Analysis by Material, 2020 to 2035
  • Figure 99: South Asia and Pacific Market Volume (Units) Analysis by Material, 2020 to 2035
  • Figure 100: South Asia and Pacific Market Value Share (%) and BPS Analysis by Material, 2025 to 2035
  • Figure 101: South Asia and Pacific Market Y-o-Y Growth (%) Projections by Material, 2025 to 2035
  • Figure 102: South Asia and Pacific Market Value (USD Million) Analysis by End Use, 2020 to 2035
  • Figure 103: South Asia and Pacific Market Volume (Units) Analysis by End Use, 2020 to 2035
  • Figure 104: South Asia and Pacific Market Value Share (%) and BPS Analysis by End Use, 2025 to 2035
  • Figure 105: South Asia and Pacific Market Y-o-Y Growth (%) Projections by End Use, 2025 to 2035
  • Figure 106: South Asia and Pacific Market Attractiveness by Material, 2025 to 2035
  • Figure 107: South Asia and Pacific Market Attractiveness by End Use, 2025 to 2035
  • Figure 108: South Asia and Pacific Market Attractiveness by Country, 2025 to 2035
  • Figure 109: East Asia Market Value (USD Million) by Material, 2025 to 2035
  • Figure 110: East Asia Market Value (USD Million) by End Use, 2025 to 2035
  • Figure 111: East Asia Market Value (USD Million) by Country, 2025 to 2035
  • Figure 112: East Asia Market Value (USD Million) Analysis by Country, 2020 to 2035
  • Figure 113: East Asia Market Volume (Units) Analysis by Country, 2020 to 2035
  • Figure 114: East Asia Market Value Share (%) and BPS Analysis by Country, 2025 to 2035
  • Figure 115: East Asia Market Y-o-Y Growth (%) Projections by Country, 2025 to 2035
  • Figure 116: East Asia Market Value (USD Million) Analysis by Material, 2020 to 2035
  • Figure 117: East Asia Market Volume (Units) Analysis by Material, 2020 to 2035
  • Figure 118: East Asia Market Value Share (%) and BPS Analysis by Material, 2025 to 2035
  • Figure 119: East Asia Market Y-o-Y Growth (%) Projections by Material, 2025 to 2035
  • Figure 120: East Asia Market Value (USD Million) Analysis by End Use, 2020 to 2035
  • Figure 121: East Asia Market Volume (Units) Analysis by End Use, 2020 to 2035
  • Figure 122: East Asia Market Value Share (%) and BPS Analysis by End Use, 2025 to 2035
  • Figure 123: East Asia Market Y-o-Y Growth (%) Projections by End Use, 2025 to 2035
  • Figure 124: East Asia Market Attractiveness by Material, 2025 to 2035
  • Figure 125: East Asia Market Attractiveness by End Use, 2025 to 2035
  • Figure 126: East Asia Market Attractiveness by Country, 2025 to 2035
  • Figure 127: Middle East and Africa Market Value (USD Million) by Material, 2025 to 2035
  • Figure 128: Middle East and Africa Market Value (USD Million) by End Use, 2025 to 2035
  • Figure 129: Middle East and Africa Market Value (USD Million) by Country, 2025 to 2035
  • Figure 130: Middle East and Africa Market Value (USD Million) Analysis by Country, 2020 to 2035
  • Figure 131: Middle East and Africa Market Volume (Units) Analysis by Country, 2020 to 2035
  • Figure 132: Middle East and Africa Market Value Share (%) and BPS Analysis by Country, 2025 to 2035
  • Figure 133: Middle East and Africa Market Y-o-Y Growth (%) Projections by Country, 2025 to 2035
  • Figure 134: Middle East and Africa Market Value (USD Million) Analysis by Material, 2020 to 2035
  • Figure 135: Middle East and Africa Market Volume (Units) Analysis by Material, 2020 to 2035
  • Figure 136: Middle East and Africa Market Value Share (%) and BPS Analysis by Material, 2025 to 2035
  • Figure 137: Middle East and Africa Market Y-o-Y Growth (%) Projections by Material, 2025 to 2035
  • Figure 138: Middle East and Africa Market Value (USD Million) Analysis by End Use, 2020 to 2035
  • Figure 139: Middle East and Africa Market Volume (Units) Analysis by End Use, 2020 to 2035
  • Figure 140: Middle East and Africa Market Value Share (%) and BPS Analysis by End Use, 2025 to 2035
  • Figure 141: Middle East and Africa Market Y-o-Y Growth (%) Projections by End Use, 2025 to 2035
  • Figure 142: Middle East and Africa Market Attractiveness by Material, 2025 to 2035
  • Figure 143: Middle East and Africa Market Attractiveness by End Use, 2025 to 2035
  • Figure 144: Middle East and Africa Market Attractiveness by Country, 2023 to 2033

Frequently Asked Questions

How big is the high pressure seal market?

The global industry is estimated to be worth USD 5,612.6 million in 2025.

What is the outlook on high pressure seal market sales?

Sales are projected to grow significantly, reaching USD 9,352.3 million by 2035.

Which country is showing notable growth in the high pressure seal market?

China is expected to experience a CAGR of 6.3%, driven by its rapid industrialization and expanding manufacturing and energy sectors.

Which product segment is leading the high pressure seal market?

Seals made of metals are leading the industry due to their durability and effectiveness in high-pressure applications.

Who are the key players in the high pressure seal market?

Prominent companies include AES Corporation, Smith’s Group Plc., Garlock Sealing Technologies LLC, AB SKF, Parker Hannifin Corporation, James Walker & Co., EagleBurgmann Germany GmbH & Co. KG, Flowserve Corp., Performance Sealing Corp., and EI du Pont de Nemours & Co.

Explore Similar Insights

Future Market Insights

High Pressure Seal Market