High Stretch Cushion Paper Market Size and Share Forecast Outlook 2025 to 2035

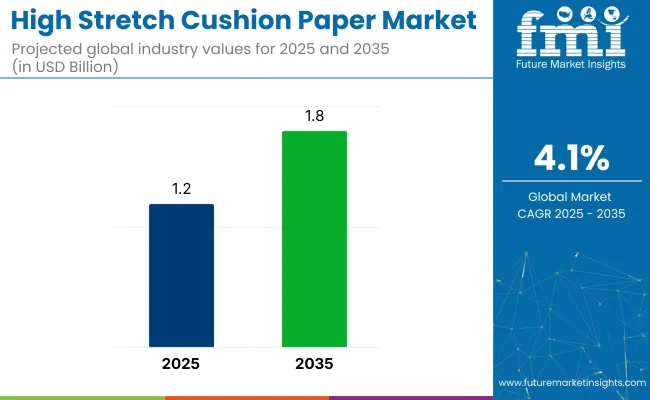
The global high stretch cushion paper market will reach USD 1.2 billion in 2025 and touch USD 1.8 billion by 2035, reflecting a CAGR of 4.1%. Expansion is supported by rising demand for recyclable, lightweight packaging across e-commerce, consumer goods, and food industries.
Quick Stats of High Stretch Cushion Paper Market

  • Market Value (2025): USD 1.2 billion
  • Forecast Value (2035): USD 1.8 billion
  • Forecast CAGR: 4.1%
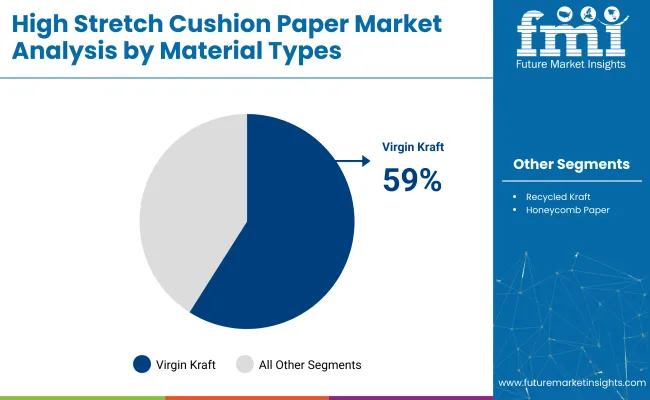
  • Product Leader in 2025: Virgin Kraft Paper (59% share)
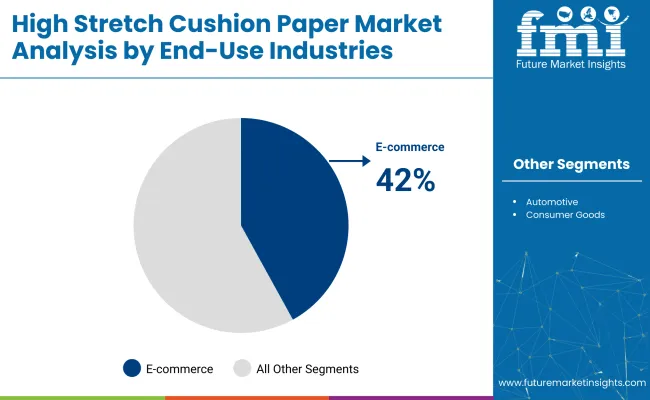
  • Top Distribution Channel: E-commerce (42% share)
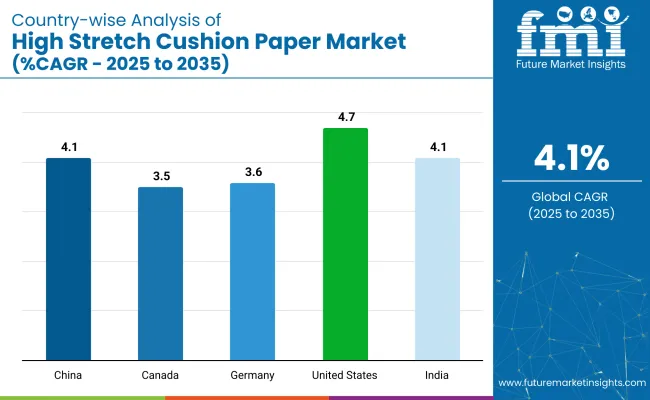
  • Key Growth Region: United States (fastest-growing with 4.7% CAGR)
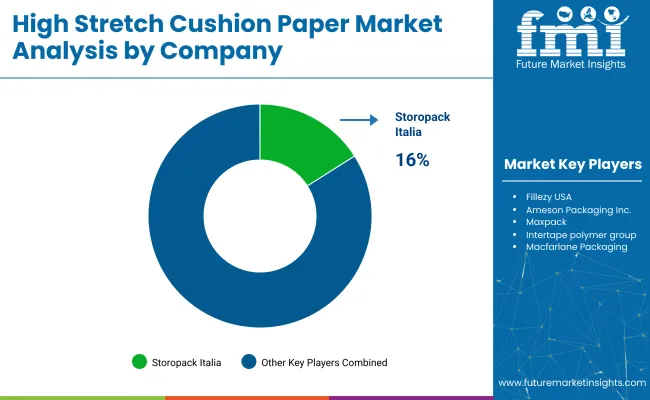
  • Leading player: Storopack Italia (16% share)

High Stretch Cushion Paper Market

Attribute Detail
Market Size (2025) USD 1.2 billion
Market Size (2035) USD 1.8 billion
CAGR (2025 to 2035) 4.1%

Known for its shock-absorbing and void-filling qualities, high stretch cushion paper is being adopted as a practical alternative to plastic-based wraps. As online shopping accelerates, logistics chains are prioritizing packaging materials that offer protection without adding bulk. With its ability to protect fragile items while reducing environmental burden, this paper type is gaining traction across high-volume packaging sectors.

The high stretch cushion paper market holds varying shares within its parent markets due to its specialized use. In the protective packaging market, it accounts for 5-7%, as alternatives like bubble wrap and foam dominate. The flexible packaging market has a share of 3-5%, competing with plastics and films.

In the paper packaging market, it represents 2-4%, as corrugated and kraft papers lead. The e-commerce packaging market drives higher demand, contributing 6-8%, due to its lightweight, protective qualities. In the industrial packaging market, its share is 4-6%, used for fragile goods. Growth is fueled by eco trends, as the high stretch cushion paper is recyclable and eco-friendly compared to plastic alternatives.

Leading companies are driving unprecedented innovation in packaging technology. Siemens introduced AI-powered predictive maintenance systems that slash equipment downtime by 30%, while Texo Trade pioneered 100% recycled PVC/TPE strips for sustainable textile applications.

YJNPACK revolutionized logistics with IoT-connected cushion machines that optimize material use in real-time. Sealed Air developed energy-efficient, beltless air cushion systems that reduce power consumption by 40%, and DS Smith advanced plant-based fiber solutions for compostable protective packaging.

These innovations respond to tightening global eco-mandates and consumer demand for greener options. WestRock and Mondi are leading the charge in smart packaging integration, combining digital tracking with automated warehouse systems. Meanwhile, Smurfit Kappa’s nanocellulose research promises stronger, lighter, eco-friendly materials.

Analyzing High Stretch Cushion Paper Market by Top Investment Segments

Virgin Kraft paper dominates the material type segment with a 59% share in 2025, prized for its superior strength and cushioning performance. The e-commerce sector leads end-use applications, capturing 42% of market demand driven by electronics and fragile goods packaging needs.

Virgin Kraft Paper Commands 59% Market Share in Material Segment

Virgin Kraft paper holds a dominant 59% share of high-stretch cushion paper use in 2025. It remains preferred for applications requiring durability, stretch capacity, and moisture protection in transit.
  • Tensile strength is recorded at 30% higher than recycled paper, offering enhanced protection for heavy or breakable goods in global shipments and reducing losses during rough handling.
  • Natural fiber stretch of up to 30% enables the paper to tightly conform around products, reducing the need for multiple packaging layers and saving material cost.
  • Moisture-resistant nature allows for extended shelf life and integrity of packaging across humid environments, particularly in tropical shipping zones.
  • Major producers, including WestRock and Mondi, have announced expansions to accommodate demand from retail distributors using cushion paper for fragile goods.

High Stretch Cushion Paper Market Analysis By Material Types

E-Commerce Sector Captures 42% of End-Use Applications.

The e-commerce segment holds a 42% share of high-stretch cushion paper consumption in 2025. Electronic items, apparel, and fragile homeware categories drive large-scale usage across packaging operations globally.
  • 38% of usage is attributed to consumer electronics, where the protective and anti-static properties of high-stretch paper offer shock resistance during long-distance transit across warehousing networks
  • Apparel industry commands 27% of demand, using paper to wrap items efficiently while keeping packaging lightweight and cost-effective for same-day or next-day shipping timelines.
  • Fragile household items like ceramics and glass contribute 35%, where stretch cushioning prevents breakage and eliminates the need for foam-based packaging.
  • Programs such as Amazon’s Frustration-Free Packaging initiative have led to significant growth in recyclable paper adoption across vendors and fulfillment partners.

High Stretch Cushion Paper Market Analysis By End Use Industries

Crimped Paper Structure Leads with 47% Market Penetration.

Crimped paper structure leads with a 47% penetration rate in 2025. Its balance of load absorption, flexibility, and adaptability supports packaging needs across sectors, including auto parts, appliances, and electronics.

  • Crimped design absorbs 25% more impact compared to flat sheets, offering better protection to fragile and high-value products, especially across bumpy supply chains.
  • Lightweight build decreases logistics costs while retaining protection, making it suitable for export packaging where weight-based freight charges apply.
  • Adjustable paper density makes it ideal for packaging goods ranging from glass ornaments to cast-iron components requiring varied protection levels
  • Crimp-mesh hybrid configurations are being piloted in automotive logistics to accommodate multi-surface items like engine parts and headlights.

Wrapping Applications Account for 51% of Market Usage

Wrapping applications comprise 51% of the high stretch cushion paper usage in 2025. This form factor has become popular for replacing films in wrapping electronics, furniture, and fragile household goods.

  • Wrapping of consumer electronics accounts for 38% of use, with the paper preventing scratches and damage during sorting, last-mile delivery, and storage in warehouses.
  • Furniture items take up 22% share, where edge and corner protection is vital during intercity or international relocation, particularly for assembled or ready-to-ship units.
  • Ceramics, glassware, and porcelain contribute 18%, benefiting from impact buffering to reduce returns and losses associated with shipping breakages.
  • Paper wrapping is seeing annual adoption growth of 15%, driven by policy shifts at large retailers favoring alternatives to traditional films and foams.

Top High-Stretch Cushion Paper Market

Dynamics Demand from e-commerce and automotive packaging has raised the profile of high stretch cushion paper. Performance-focused upgrades, low plastic reliance, and regulatory preferences for recyclable packaging materials are supporting volume growth across regions, with manufacturers scaling up crimped and accordion structures for protective versatility.

Pioneering Product Formats and Adaptive Engineering Lead Industry Trends

  • Storopack’s launch of “Paper Stretch Pro” delivers significantly enhanced elongation and puncture resistance, redefining standards for cross-border and fragile-freight protection.
  • Fillezy rolled out compact, countertop dispensing units for crimped kraft paper designed specifically for direct-to-consumer apparel shipments, reducing material waste and improving handling.
  • Ameson Packaging integrated AI-driven load and tension sensors into automated wrapping units, enabling real-time adjustment of paper stretch levels to match package density.
  • Macfarlane Packaging refined its mesh-pattern, honeycomb-style papers-reducing void fill up to 20% and improving cushioning for delicate gift items.
  • Intertape Polymer Group scaled up production of double-ply accordion and multipart paper structures optimized for high-load palletized cargo, enhancing shock absorption and streamlining logistics workflows.

Structural Challenges and Cost Pressures Restrain Market Expansion
  • Virgin Kraft grades offer superior elongation but remain 25-28% costlier than recycled alternatives, straining procurement budgets.
  • Recycled kraft lacks fiber integrity, causing inconsistent crimping and lower protective yield in transit-sensitive goods.
  • Automation for high-stretch paper conversion requires steep investment, deterring small converters from replacing traditional plastic-based or foam void-fill solutions.

Top Countries Manufacturing, Synthesizing, Distributing, and Generating Demand for High Stretch Cushion Paper

Country Wise Analysis Of High Stretch Cushion Paper Market

Countries Projected CAGR (2025 to 2035)
United States 4.7%
Canada 3.5%
Germany 3.6%
China 4.1%
India 4.1%

Global demand for High Stretch Cushion Paper is projected to grow at a 4.1% CAGR from 2025 to 2035. Among the five profiled markets out of 40 covered, the United States leads at 4.7%, followed by China and India at 4.1% each, while Germany posts 3.6% and Canada records 3.5%.

These growth rates translate to a +12% premium for the United States, +0% for China and India, and -2% for Germany and Canada compared to the baseline. Divergence in growth is driven by factors such as the strong demand for packaging in the United States, the rise of e-commerce and logistics in China and India, and moderate demand in mature markets like Germany and Canada.

The report covers detailed analysis of 40+ countries, with the top five countries shared as a reference.

Growth Analysis of High Stretch Cushion Paper Market in the United States

A CAGR of 4.7% has been projected for the United States between 2025 and 2035. Demand has been fueled by e-commerce consolidation, where protective paper packaging is gaining preference over polyethylene-based void fill. Custom crimped formats and kraft variants are being integrated into fulfillment centers due to operational compatibility with high-speed pack lines. Domestic manufacturing incentives and waste-reduction mandates have positioned recycled cushion paper as a favored void fill.

  • Warehousing contracts favor mesh-type paper over plastic bubble wrap
  • Paper-based wrap has been included in USPS’s approved packaging materials
  • Tier-1 auto suppliers have adopted crimped fill for bulk kit transport

Premium High Stretch Cushion Paper Market Growth Outlook in Canada

The market is anticipated to expand at a CAGR of 3.5% through 2035, led by specialty paper grades aligned with eco-certification protocols. Retail distributors have shifted toward accordion-format papers for gift-packaged goods, influenced by voluntary packaging scorecards. Corrugated packaging regulations in British Columbia have broadened applications for paper-based cushioning in inter-provincial logistics.

  • Electronics supply chains rely on high-stretch mesh fill formats
  • Quebec’s retail packaging code favors recycled kraft cushioning
  • Houseware brands introduced subscription kits with accordion paper fill

In-Depth Analysis of the High Stretch Cushion Paper Market in Germany

Germany’s market is forecast to register a 3.6% CAGR from 2025 to 2035. Adoption has risen under VerpackG compliance, with retail and B2B shipments integrating crimped kraft inserts. Honeycomb-patterned variants have gained momentum in the glassware export segment due to weight optimization. Efficiency in logistics and high recyclability have made high-stretch cushion paper a favored material under eco-modulated fee schemes.

  • Glass exporters using honeycomb kraft formats to optimize freight loads
  • Accordion-type fill promoted under dual-system packaging audits
  • Specialty ceramic producers are integrating mesh wrap for EU-bound crates

Demand Forecast for High Stretch Cushion Paper Market in China

China’s market is expected to advance at a CAGR of 4.1% over the forecast period. Expansion has been centered on cross-border e-commerce and OEM electronics packaging. Domestic kraft production has surged to offset virgin imports, with recycled crimped paper formats widely adopted by consumer goods packaging hubs in Guangdong and Zhejiang. Regional freight firms have switched from foam to paper-based solutions due to rising restrictions on non-degradable fillers.

  • Alibaba logistics network deploying mesh-format void fill for fragile goods.
  • Eastern China packaging hubs investing in automatic crimped paper machines
  • Shenzhen-based exporters standardizing honeycomb formats for EU parcels

Analysis of High Stretch Cushion Paper Market in India

India’s CAGR of 4.1% has been supported by D2C e-commerce logistics and changes in warehousing practices. National logistics parks and third-party fulfillment centers are phasing out EPS fill, replacing it with kraft-based alternatives. Tier-2 city demand for homeware, ceramics, and mid-segment electronics packaging has opened consistent volume channels. GST-linked packaging standards and waste compliance audits have motivated domestic firms to internalize void fill operations using high-stretch cushion paper.
  • Maharashtra warehousing units mandating Kraft cushioning for outbound parcels
  • E-commerce homeware firms shifting to accordion and mesh structure paper
  • Paper mills in Gujarat are increasing the output of recycled cushion-grade kraft stock

Leading High Stretch Cushion Paper Supplier

High Stretch Cushion Paper Market Analysis By Company

Leading Player Storopack Italia 16% Share

High stretch cushion paper supply remains moderately consolidated, led by Storopack Italia, Intertape Polymer Group, and Macfarlane Packaging. Storopack introduced PaperWave AirWave formats in 2024, while Intertape expanded its production base through a facility acquisition in Illinois. Macfarlane invested in improving fiber strength properties for branded cushion systems. Fillezy USA and Ameson Packaging are gaining visibility with proprietary paper-based fill kits, while Maxpack is targeting D2C shippers with lightweight roll formats.

Entry barriers include machine integration costs, patented paper-forming techniques, and long-term vendor contracts. However, private-label converters have started offering low-volume services, enabling regional growth. Though dominated by a few suppliers, the market still shows pricing competition, especially in e-commerce-driven zones seeking paper-based void fill alternatives.

Recent Industry News

  • Maxpack rolls out lightweight roll-based cushion lines in Texas (January 2025) Designed for D2C brands and micro-fulfillment centers, the new range allows compatibility with manual and semi-automatic dispensers using reinforced paper substrates.
  • Macfarlane Packaging Upgrades R&D capabilities in Coventry (March 2025). A new pilot lab was added to enhance paper elongation profiles and test high-pressure resistance in packaging lines for electronics and high-fragility goods.

Leading Players

  • Storopack Italia
  • Fillezy USA
  • Ameson Packaging Inc.
  • Maxpack
  • Intertape Polymer Group
  • Macfarlane Packaging

High Stretch Cushion Paper Market - Report Scope

Report Attributes Details
Market Size (2025) USD 1.2 billion
Projected Market Size (2035) USD 1.8 billion
CAGR (2025 to 2035) 4.1%
Base Year for Estimation 2024
Historical Period 2020 to 2024
Projections Period 2025 to 2035
Quantitative Units USD billion for value
Material Types Analyzed Virgin Kraft, Recycled Kraft, Honeycomb Paper
Paper Structures Analyzed Crimped, Accordion, Mesh Pattern
Applications Analyzed Wrapping, Void Fill, Edge Protection
End-Use Industries Analyzed E-commerce (Electronics, Apparel, Homeware), Glassware (Ceramics, Fragile Goods), Automotive (Spare Parts, Toolkits), Consumer Goods (Furniture, Gift Packaging)
Regions Covered North America, Europe, Asia-Pacific, Latin America, Middle East & Africa
Countries Covered United States, Canada, Germany, United Kingdom, France, China, India, Japan, South Korea, Brazil, Mexico, UAE, South Africa
Leading Players Storopack Italia, Fillezy USA, Ameson Packaging Inc., Maxpack, Intertape Polymer Group, Macfarlane Packaging
Additional Attributes Dollar sales growth by material type (Kraft, Honeycomb), regional demand trends, competitive landscape, pricing strategies, packaging innovations, supply chain insights.

Key Segments

By Material Type:

The segment includes Virgin Kraft, Recycled Kraft, and Honeycomb Paper

By Paper Structure:

This category comprises Crimped, Accordion, and Mesh Pattern formats.

By Application:

The market is divided into Wrapping, Void Fill, and Edge Protection based on usage in parcel integrity during transit.

By End-Use Industry:

This segment is further categorized into E-commerce (Electronics, Apparel, Homeware), Glassware (Ceramics, Fragile Goods), Automotive (Spare Parts, Toolkits), Consumer Goods (Furniture, Gift Packaging)

By Region:

North America, Europe, Asia-Pacific, Latin America, and the Middle East & Africa.

Table of Content

  1. Executive Summary
    • Global Market Outlook
    • Demand-side Trends
    • Supply-side Trends
    • Technology Roadmap Analysis
    • Analysis and Recommendations
  2. Market Overview
    • Market Coverage/Taxonomy
    • Market Definition/Scope/Limitations
  3. Market Background
    • Market Dynamics
      • Drivers
      • Restraints
      • Opportunity
      • Trends
    • Scenario Forecast
      • Demand in Optimistic Scenario
      • Demand in Likely Scenario
      • Demand in Conservative Scenario
    • Opportunity Map Analysis
    • Product Life Cycle Analysis
    • Supply Chain Analysis
      • Supply Side Participants and their Roles
        • Producers
        • Mid-Level Participants (Traders/ Agents/ Brokers)
        • Wholesalers and Distributors
      • Value Added and Value Created at Node in the Supply Chain
      • List of Raw Material Suppliers
      • List of Existing and Potential Buyer’s
    • Investment Feasibility Matrix
    • Value Chain Analysis
      • Profit Margin Analysis
      • Wholesalers and Distributors
      • Retailers
    • PESTLE and Porter’s Analysis
    • Regulatory Landscape
      • By Key Regions
      • By Key Countries
    • Regional Parent Market Outlook
    • Production and Consumption Statistics
    • Import and Export Statistics
  4. Global Market Analysis 2020 to 2024 and Forecast, 2025 to 2035
    • Historical Market Size Value (USD Billion) & Volume (KT) Analysis, 2020 to 2024
    • Current and Future Market Size Value (USD Billion) & Volume (KT) Projections, 2025 to 2035
      • Y-o-Y Growth Trend Analysis
      • Absolute $ Opportunity Analysis
  5. Global Market Pricing Analysis 2020 to 2024 and Forecast 2025 to 2035
  6. Global Market Analysis 2020 to 2024 and Forecast 2025 to 2035, By Material Type
    • Introduction/Key Findings
    • Historical Market Size Value (USD Billion) & Volume (KT) Analysis By Material Type, 2020 to 2024
    • Current and Future Market Size Value (USD Billion) & Volume (KT) Analysis and Forecast By Material Type, 2025 to 2035
      • Virgin Kraft
      • Recycled Kraft
      • Honeycomb Paper
    • Y-o-Y Growth Trend Analysis By Material Type, 2020 to 2024
    • Absolute $ Opportunity Analysis By Material Type, 2025 to 2035
  7. Global Market Analysis 2020 to 2024 and Forecast 2025 to 2035, By Paper Structure
    • Introduction/Key Findings
    • Historical Market Size Value (USD Billion) & Volume (KT) Analysis By Paper Structure, 2020 to 2024
    • Current and Future Market Size Value (USD Billion) & Volume (KT) Analysis and Forecast By Paper Structure, 2025 to 2035
      • Crimped
      • Accordion
      • Mesh Pattern
    • Y-o-Y Growth Trend Analysis By Paper Structure, 2020 to 2024
    • Absolute $ Opportunity Analysis By Paper Structure, 2025 to 2035
  8. Global Market Analysis 2020 to 2024 and Forecast 2025 to 2035, By Application
    • Introduction/Key Findings
    • Historical Market Size Value (USD Billion) & Volume (KT) Analysis By Application, 2020 to 2024
    • Current and Future Market Size Value (USD Billion) & Volume (KT) Analysis and Forecast By Application, 2025 to 2035
      • Wrapping
      • Void Fill
      • Construction
      • Edge Protection
    • Y-o-Y Growth Trend Analysis By Application, 2020 to 2024
    • Absolute $ Opportunity Analysis By Application, 2025 to 2035
  9. Global Market Analysis 2020 to 2024 and Forecast 2025 to 2035, By End-Use Industry
    • Introduction/Key Findings
    • Historical Market Size Value (USD Billion) & Volume (KT) Analysis By End-Use Industry, 2020 to 2024
    • Current and Future Market Size Value (USD Billion) & Volume (KT) Analysis and Forecast By End-Use Industry, 2025 to 2035
      • E-commerce
        • Electronics
        • Apparel
        • Homeware
      • Glassware
        • Ceramics
        • Fragile Goods
      • Automotive
        • Spare Parts
        • Toolkits
      • Consumer Goods
        • Furniture
        • Packaging
    • Y-o-Y Growth Trend Analysis By End-Use Industry, 2020 to 2024
    • Absolute $ Opportunity Analysis By End-Use Industry, 2025 to 2035
  10. Global Market Analysis 2020 to 2024 and Forecast 2025 to 2035, By Region
    • Introduction
    • Historical Market Size Value (USD Billion) & Volume (KT) Analysis By Region, 2020 to 2024
    • Current Market Size Value (USD Billion) & Volume (KT) Analysis and Forecast By Region, 2025 to 2035
      • North America
      • Latin America
      • Western Europe
      • Eastern Europe
      • East Asia
      • South Asia & Pacific
      • Middle East and Africa
    • Market Attractiveness Analysis By Region
  11. North America Market Analysis 2020 to 2024 and Forecast 2025 to 2035, By Country
    • Historical Market Size Value (USD Billion) & Volume (KT) Trend Analysis By Market Taxonomy, 2020 to 2024
    • Market Size Value (USD Billion) & Volume (KT) Forecast By Market Taxonomy, 2025 to 2035
      • By Country
        • USA
        • Canada
        • Mexico
      • By Material Type
      • By Paper Structure
      • By Application
      • By End-Use Industry
    • Market Attractiveness Analysis
      • By Country
      • By Material Type
      • By Paper Structure
      • By Application
      • By End-Use Industry
    • Key Takeaways
  12. Latin America Market Analysis 2020 to 2024 and Forecast 2025 to 2035, By Country
    • Historical Market Size Value (USD Billion) & Volume (KT) Trend Analysis By Market Taxonomy, 2020 to 2024
    • Market Size Value (USD Billion) & Volume (KT) Forecast By Market Taxonomy, 2025 to 2035
      • By Country
        • Brazil
        • Argentina
        • Rest of LATAM
      • By Material Type
      • By Paper Structure
      • By Application
      • By End-Use Industry
    • Market Attractiveness Analysis
      • By Country
      • By Material Type
      • By Paper Structure
      • By Application
      • By End-Use Industry
    • Key Takeaways
  13. Western Europe Market Analysis 2020 to 2024 and Forecast 2025 to 2035, By Country
    • Historical Market Size Value (USD Billion) & Volume (KT) Trend Analysis By Market Taxonomy, 2020 to 2024
    • Market Size Value (USD Billion) & Volume (KT) Forecast By Market Taxonomy, 2025 to 2035
      • By Country
        • Germany
        • Italy
        • France
        • UK
        • Spain
        • BENELUX
        • Nordic
        • Rest of W.Europe
      • By Material Type
      • By Paper Structure
      • By Application
      • By End-Use Industry
    • Market Attractiveness Analysis
      • By Country
      • By Material Type
      • By Paper Structure
      • By Application
      • By End-Use Industry
    • Key Takeaways
  14. Eastern Europe Market Analysis 2020 to 2024 and Forecast 2025 to 2035, By Country
    • Historical Market Size Value (USD Billion) & Volume (KT) Trend Analysis By Market Taxonomy, 2020 to 2024
    • Market Size Value (USD Billion) & Volume (KT) Forecast By Market Taxonomy, 2025 to 2035
      • By Country
        • Russia
        • Hungary
        • Poland
        • Balkan & Baltics
        • Rest of E. Europe
      • By Material Type
      • By Paper Structure
      • By Application
      • By End-Use Industry
    • Market Attractiveness Analysis
      • By Country
      • By Material Type
      • By Paper Structure
      • By Application
      • By End-Use Industry
    • Key Takeaways
  15. East Asia Market Analysis 2020 to 2024 and Forecast 2025 to 2035, By Country
    • Historical Market Size Value (USD Billion) & Volume (KT) Trend Analysis By Market Taxonomy, 2020 to 2024
    • Market Size Value (USD Billion) & Volume (KT) Forecast By Market Taxonomy, 2025 to 2035
      • By Country
        • China
        • Japan
        • South Korea
      • By Material Type
      • By Paper Structure
      • By Application
      • By End-Use Industry
    • Market Attractiveness Analysis
      • By Country
      • By Material Type
      • By Paper Structure
      • By Application
      • By End-Use Industry
    • Key Takeaways
  16. South Asia & Pacific Market Analysis 2020 to 2024 and Forecast 2025 to 2035, By Country
    • Historical Market Size Value (USD Billion) & Volume (KT) Trend Analysis By Market Taxonomy, 2020 to 2024
    • Market Size Value (USD Billion) & Volume (KT) Forecast By Market Taxonomy, 2025 to 2035
      • By Country
        • India
        • Australia & New Zealand
        • ASEAN
        • Rest of SAP
      • By Material Type
      • By Paper Structure
      • By Application
      • By End-Use Industry
    • Market Attractiveness Analysis
      • By Country
      • By Material Type
      • By Paper Structure
      • By Application
      • By End-Use Industry
    • Key Takeaways
  17. Middle East and Africa Market Analysis 2020 to 2024 and Forecast 2025 to 2035, By Country
    • Historical Market Size Value (USD Billion) & Volume (KT) Trend Analysis By Market Taxonomy, 2020 to 2024
    • Market Size Value (USD Billion) & Volume (KT) Forecast By Market Taxonomy, 2025 to 2035
      • By Country
        • GCC Countries
        • Northern Africa
        • South Africa
        • Turkiye
        • Rest of MEA
      • By Material Type
      • By Paper Structure
      • By Application
      • By End-Use Industry
    • Market Attractiveness Analysis
      • By Country
      • By Material Type
      • By Paper Structure
      • By Application
      • By End-Use Industry
    • Key Takeaways
  18. Key Countries Market Analysis
    • USA
      • Pricing Analysis
      • Market Share Analysis, 2024
        • By Material Type
        • By Paper Structure
        • By Application
        • By End-Use Industry
    • Canada
      • Pricing Analysis
      • Market Share Analysis, 2024
        • By Material Type
        • By Paper Structure
        • By Application
        • By End-Use Industry
    • Brazil
      • Pricing Analysis
      • Market Share Analysis, 2024
        • By Material Type
        • By Paper Structure
        • By Application
        • By End-Use Industry
    • Mexico
      • Pricing Analysis
      • Market Share Analysis, 2024
        • By Material Type
        • By Paper Structure
        • By Application
        • By End-Use Industry
    • Argentina
      • Pricing Analysis
      • Market Share Analysis, 2024
        • By Material Type
        • By Paper Structure
        • By Application
        • By End-Use Industry
  19. Market Structure Analysis
    • Competition Dashboard
    • Competition Benchmarking
    • Market Share Analysis of Top Players
      • By Regional
      • By Material Type
      • By Paper Structure
      • By Application
      • By End-Use Industry
  20. Competition Analysis
    • Competition Deep Dive
      • Storopack Italia
        • Overview
        • Product Portfolio
        • Profitability by Market Segments (Product/Age /Sales Channel/Region)
        • Sales Footprint
        • Strategy Overview
          • Marketing Strategy
          • Product Strategy
          • Channel Strategy
      • Fillezy USA
        • Overview
        • Product Portfolio
        • Profitability by Market Segments (Product/Age /Sales Channel/Region)
        • Sales Footprint
        • Strategy Overview
          • Marketing Strategy
          • Product Strategy
          • Channel Strategy
      • Ameson Packaging Inc.
        • Overview
        • Product Portfolio
        • Profitability by Market Segments (Product/Age /Sales Channel/Region)
        • Sales Footprint
        • Strategy Overview
          • Marketing Strategy
          • Product Strategy
          • Channel Strategy
      • Maxpack
        • Overview
        • Product Portfolio
        • Profitability by Market Segments (Product/Age /Sales Channel/Region)
        • Sales Footprint
        • Strategy Overview
          • Marketing Strategy
          • Product Strategy
          • Channel Strategy
      • Intertape polymer group
        • Overview
        • Product Portfolio
        • Profitability by Market Segments (Product/Age /Sales Channel/Region)
        • Sales Footprint
        • Strategy Overview
          • Marketing Strategy
          • Product Strategy
          • Channel Strategy
      • Macfarlane Packaging
        • Overview
        • Product Portfolio
        • Profitability by Market Segments (Product/Age /Sales Channel/Region)
        • Sales Footprint
        • Strategy Overview
          • Marketing Strategy
          • Product Strategy
          • Channel Strategy
  21. Assumptions & Acronyms Used
  22. Research Methodology

List of Tables

  • Table 1: Global Market Value (USD Billion) Forecast by Region, 2020-2035
  • Table 2: Global Market Volume (KT) Forecast by Region, 2020-2035
  • Table 3: Global Market Value (USD Billion) Forecast by Material Type, 2020-2035
  • Table 4: Global Market Volume (KT) Forecast by Material Type, 2020-2035
  • Table 5: Global Market Value (USD Billion) Forecast by Paper Structure, 2020-2035
  • Table 6: Global Market Volume (KT) Forecast by Paper Structure, 2020-2035
  • Table 7: Global Market Value (USD Billion) Forecast by Application, 2020-2035
  • Table 8: Global Market Volume (KT) Forecast by Application, 2020-2035
  • Table 9: Global Market Value (USD Billion) Forecast by End-Use Industry, 2020-2035
  • Table 10: Global Market Volume (KT) Forecast by End-Use Industry, 2020-2035
  • Table 11: North America Market Value (USD Billion) Forecast by Country, 2020-2035
  • Table 12: North America Market Volume (KT) Forecast by Country, 2020-2035
  • Table 13: North America Market Value (USD Billion) Forecast by Material Type, 2020-2035
  • Table 14: North America Market Volume (KT) Forecast by Material Type, 2020-2035
  • Table 15: North America Market Value (USD Billion) Forecast by Paper Structure, 2020-2035
  • Table 16: North America Market Volume (KT) Forecast by Paper Structure, 2020-2035
  • Table 17: North America Market Value (USD Billion) Forecast by Application, 2020-2035
  • Table 18: North America Market Volume (KT) Forecast by Application, 2020-2035
  • Table 19: North America Market Value (USD Billion) Forecast by End-Use Industry, 2020-2035
  • Table 20: North America Market Volume (KT) Forecast by End-Use Industry, 2020-2035
  • Table 21: Latin America Market Value (USD Billion) Forecast by Country, 2020-2035
  • Table 22: Latin America Market Volume (KT) Forecast by Country, 2020-2035
  • Table 23: Latin America Market Value (USD Billion) Forecast by Material Type, 2020-2035
  • Table 24: Latin America Market Volume (KT) Forecast by Material Type, 2020-2035
  • Table 25: Latin America Market Value (USD Billion) Forecast by Paper Structure, 2020-2035
  • Table 26: Latin America Market Volume (KT) Forecast by Paper Structure, 2020-2035
  • Table 27: Latin America Market Value (USD Billion) Forecast by Application, 2020-2035
  • Table 28: Latin America Market Volume (KT) Forecast by Application, 2020-2035
  • Table 29: Latin America Market Value (USD Billion) Forecast by End-Use Industry, 2020-2035
  • Table 30: Latin America Market Volume (KT) Forecast by End-Use Industry, 2020-2035
  • Table 31: Western Europe Market Value (USD Billion) Forecast by Country, 2020-2035
  • Table 32: Western Europe Market Volume (KT) Forecast by Country, 2020-2035
  • Table 33: Western Europe Market Value (USD Billion) Forecast by Material Type, 2020-2035
  • Table 34: Western Europe Market Volume (KT) Forecast by Material Type, 2020-2035
  • Table 35: Western Europe Market Value (USD Billion) Forecast by Paper Structure, 2020-2035
  • Table 36: Western Europe Market Volume (KT) Forecast by Paper Structure, 2020-2035
  • Table 37: Western Europe Market Value (USD Billion) Forecast by Application, 2020-2035
  • Table 38: Western Europe Market Volume (KT) Forecast by Application, 2020-2035
  • Table 39: Western Europe Market Value (USD Billion) Forecast by End-Use Industry, 2020-2035
  • Table 40: Western Europe Market Volume (KT) Forecast by End-Use Industry, 2020-2035
  • Table 41: Eastern Europe Market Value (USD Billion) Forecast by Country, 2020-2035
  • Table 42: Eastern Europe Market Volume (KT) Forecast by Country, 2020-2035
  • Table 43: Eastern Europe Market Value (USD Billion) Forecast by Material Type, 2020-2035
  • Table 44: Eastern Europe Market Volume (KT) Forecast by Material Type, 2020-2035
  • Table 45: Eastern Europe Market Value (USD Billion) Forecast by Paper Structure, 2020-2035
  • Table 46: Eastern Europe Market Volume (KT) Forecast by Paper Structure, 2020-2035
  • Table 47: Eastern Europe Market Value (USD Billion) Forecast by Application, 2020-2035
  • Table 48: Eastern Europe Market Volume (KT) Forecast by Application, 2020-2035
  • Table 49: Eastern Europe Market Value (USD Billion) Forecast by End-Use Industry, 2020-2035
  • Table 50: Eastern Europe Market Volume (KT) Forecast by End-Use Industry, 2020-2035
  • Table 51: East Asia Market Value (USD Billion) Forecast by Country, 2020-2035
  • Table 52: East Asia Market Volume (KT) Forecast by Country, 2020-2035
  • Table 53: East Asia Market Value (USD Billion) Forecast by Material Type, 2020-2035
  • Table 54: East Asia Market Volume (KT) Forecast by Material Type, 2020-2035
  • Table 55: East Asia Market Value (USD Billion) Forecast by Paper Structure, 2020-2035
  • Table 56: East Asia Market Volume (KT) Forecast by Paper Structure, 2020-2035
  • Table 57: East Asia Market Value (USD Billion) Forecast by Application, 2020-2035
  • Table 58: East Asia Market Volume (KT) Forecast by Application, 2020-2035
  • Table 59: East Asia Market Value (USD Billion) Forecast by End-Use Industry, 2020-2035
  • Table 60: East Asia Market Volume (KT) Forecast by End-Use Industry, 2020-2035
  • Table 61: South Asia & Pacific Market Value (USD Billion) Forecast by Country, 2020-2035
  • Table 62: South Asia & Pacific Market Volume (KT) Forecast by Country, 2020-2035
  • Table 63: South Asia & Pacific Market Value (USD Billion) Forecast by Material Type, 2020-2035
  • Table 64: South Asia & Pacific Market Volume (KT) Forecast by Material Type, 2020-2035
  • Table 65: South Asia & Pacific Market Value (USD Billion) Forecast by Paper Structure, 2020-2035
  • Table 66: South Asia & Pacific Market Volume (KT) Forecast by Paper Structure, 2020-2035
  • Table 67: South Asia & Pacific Market Value (USD Billion) Forecast by Application, 2020-2035
  • Table 68: South Asia & Pacific Market Volume (KT) Forecast by Application, 2020-2035
  • Table 69: South Asia & Pacific Market Value (USD Billion) Forecast by End-Use Industry, 2020-2035
  • Table 70: South Asia & Pacific Market Volume (KT) Forecast by End-Use Industry, 2020-2035
  • Table 71: Middle East and Africa Market Value (USD Billion) Forecast by Country, 2020-2035
  • Table 72: Middle East and Africa Market Volume (KT) Forecast by Country, 2020-2035
  • Table 73: Middle East and Africa Market Value (USD Billion) Forecast by Material Type, 2020-2035
  • Table 74: Middle East and Africa Market Volume (KT) Forecast by Material Type, 2020-2035
  • Table 75: Middle East and Africa Market Value (USD Billion) Forecast by Paper Structure, 2020-2035
  • Table 76: Middle East and Africa Market Volume (KT) Forecast by Paper Structure, 2020-2035
  • Table 77: Middle East and Africa Market Value (USD Billion) Forecast by Application, 2020-2035
  • Table 78: Middle East and Africa Market Volume (KT) Forecast by Application, 2020-2035
  • Table 79: Middle East and Africa Market Value (USD Billion) Forecast by End-Use Industry, 2020-2035
  • Table 80: Middle East and Africa Market Volume (KT) Forecast by End-Use Industry, 2020-2035

List of Figures

  • Figure 1: Global Market Volume (KT) Forecast 2020-2035
  • Figure 2: Global Market Pricing Analysis
  • Figure 3: Global Market Value (USD Billion) Forecast 2020-2035
  • Figure 4: Global Market Value Share and BPS Analysis by Material Type, 2025 and 2035
  • Figure 5: Global Market Y-o-Y Growth Comparison by Material Type, 2025-2035
  • Figure 6: Global Market Attractiveness Analysis by Material Type
  • Figure 7: Global Market Value Share and BPS Analysis by Paper Structure, 2025 and 2035
  • Figure 8: Global Market Y-o-Y Growth Comparison by Paper Structure, 2025-2035
  • Figure 9: Global Market Attractiveness Analysis by Paper Structure
  • Figure 10: Global Market Value Share and BPS Analysis by Application, 2025 and 2035
  • Figure 11: Global Market Y-o-Y Growth Comparison by Application, 2025-2035
  • Figure 12: Global Market Attractiveness Analysis by Application
  • Figure 13: Global Market Value Share and BPS Analysis by End-Use Industry, 2025 and 2035
  • Figure 14: Global Market Y-o-Y Growth Comparison by End-Use Industry, 2025-2035
  • Figure 15: Global Market Attractiveness Analysis by End-Use Industry
  • Figure 16: Global Market Value (USD Billion) Share and BPS Analysis by Region, 2025 and 2035
  • Figure 17: Global Market Y-o-Y Growth Comparison by Region, 2025-2035
  • Figure 18: Global Market Attractiveness Analysis by Region
  • Figure 19: North America Market Incremental $ Opportunity, 2025-2035
  • Figure 20: Latin America Market Incremental $ Opportunity, 2025-2035
  • Figure 21: Western Europe Market Incremental $ Opportunity, 2025-2035
  • Figure 22: Eastern Europe Market Incremental $ Opportunity, 2025-2035
  • Figure 23: East Asia Market Incremental $ Opportunity, 2025-2035
  • Figure 24: South Asia & Pacific Market Incremental $ Opportunity, 2025-2035
  • Figure 25: Middle East and Africa Market Incremental $ Opportunity, 2025-2035
  • Figure 26: North America Market Value Share and BPS Analysis by Country, 2025 and 2035
  • Figure 27: North America Market Value Share and BPS Analysis by Material Type, 2025 and 2035
  • Figure 28: North America Market Y-o-Y Growth Comparison by Material Type, 2025-2035
  • Figure 29: North America Market Attractiveness Analysis by Material Type
  • Figure 30: North America Market Value Share and BPS Analysis by Paper Structure, 2025 and 2035
  • Figure 31: North America Market Y-o-Y Growth Comparison by Paper Structure, 2025-2035
  • Figure 32: North America Market Attractiveness Analysis by Paper Structure
  • Figure 33: North America Market Value Share and BPS Analysis by Application, 2025 and 2035
  • Figure 34: North America Market Y-o-Y Growth Comparison by Application, 2025-2035
  • Figure 35: North America Market Attractiveness Analysis by Application
  • Figure 36: North America Market Value Share and BPS Analysis by End-Use Industry, 2025 and 2035
  • Figure 37: North America Market Y-o-Y Growth Comparison by End-Use Industry, 2025-2035
  • Figure 38: North America Market Attractiveness Analysis by End-Use Industry
  • Figure 39: Latin America Market Value Share and BPS Analysis by Country, 2025 and 2035
  • Figure 40: Latin America Market Value Share and BPS Analysis by Material Type, 2025 and 2035
  • Figure 41: Latin America Market Y-o-Y Growth Comparison by Material Type, 2025-2035
  • Figure 42: Latin America Market Attractiveness Analysis by Material Type
  • Figure 43: Latin America Market Value Share and BPS Analysis by Paper Structure, 2025 and 2035
  • Figure 44: Latin America Market Y-o-Y Growth Comparison by Paper Structure, 2025-2035
  • Figure 45: Latin America Market Attractiveness Analysis by Paper Structure
  • Figure 46: Latin America Market Value Share and BPS Analysis by Application, 2025 and 2035
  • Figure 47: Latin America Market Y-o-Y Growth Comparison by Application, 2025-2035
  • Figure 48: Latin America Market Attractiveness Analysis by Application
  • Figure 49: Latin America Market Value Share and BPS Analysis by End-Use Industry, 2025 and 2035
  • Figure 50: Latin America Market Y-o-Y Growth Comparison by End-Use Industry, 2025-2035
  • Figure 51: Latin America Market Attractiveness Analysis by End-Use Industry
  • Figure 52: Western Europe Market Value Share and BPS Analysis by Country, 2025 and 2035
  • Figure 53: Western Europe Market Value Share and BPS Analysis by Material Type, 2025 and 2035
  • Figure 54: Western Europe Market Y-o-Y Growth Comparison by Material Type, 2025-2035
  • Figure 55: Western Europe Market Attractiveness Analysis by Material Type
  • Figure 56: Western Europe Market Value Share and BPS Analysis by Paper Structure, 2025 and 2035
  • Figure 57: Western Europe Market Y-o-Y Growth Comparison by Paper Structure, 2025-2035
  • Figure 58: Western Europe Market Attractiveness Analysis by Paper Structure
  • Figure 59: Western Europe Market Value Share and BPS Analysis by Application, 2025 and 2035
  • Figure 60: Western Europe Market Y-o-Y Growth Comparison by Application, 2025-2035
  • Figure 61: Western Europe Market Attractiveness Analysis by Application
  • Figure 62: Western Europe Market Value Share and BPS Analysis by End-Use Industry, 2025 and 2035
  • Figure 63: Western Europe Market Y-o-Y Growth Comparison by End-Use Industry, 2025-2035
  • Figure 64: Western Europe Market Attractiveness Analysis by End-Use Industry
  • Figure 65: Eastern Europe Market Value Share and BPS Analysis by Country, 2025 and 2035
  • Figure 66: Eastern Europe Market Value Share and BPS Analysis by Material Type, 2025 and 2035
  • Figure 67: Eastern Europe Market Y-o-Y Growth Comparison by Material Type, 2025-2035
  • Figure 68: Eastern Europe Market Attractiveness Analysis by Material Type
  • Figure 69: Eastern Europe Market Value Share and BPS Analysis by Paper Structure, 2025 and 2035
  • Figure 70: Eastern Europe Market Y-o-Y Growth Comparison by Paper Structure, 2025-2035
  • Figure 71: Eastern Europe Market Attractiveness Analysis by Paper Structure
  • Figure 72: Eastern Europe Market Value Share and BPS Analysis by Application, 2025 and 2035
  • Figure 73: Eastern Europe Market Y-o-Y Growth Comparison by Application, 2025-2035
  • Figure 74: Eastern Europe Market Attractiveness Analysis by Application
  • Figure 75: Eastern Europe Market Value Share and BPS Analysis by End-Use Industry, 2025 and 2035
  • Figure 76: Eastern Europe Market Y-o-Y Growth Comparison by End-Use Industry, 2025-2035
  • Figure 77: Eastern Europe Market Attractiveness Analysis by End-Use Industry
  • Figure 78: East Asia Market Value Share and BPS Analysis by Country, 2025 and 2035
  • Figure 79: East Asia Market Value Share and BPS Analysis by Material Type, 2025 and 2035
  • Figure 80: East Asia Market Y-o-Y Growth Comparison by Material Type, 2025-2035
  • Figure 81: East Asia Market Attractiveness Analysis by Material Type
  • Figure 82: East Asia Market Value Share and BPS Analysis by Paper Structure, 2025 and 2035
  • Figure 83: East Asia Market Y-o-Y Growth Comparison by Paper Structure, 2025-2035
  • Figure 84: East Asia Market Attractiveness Analysis by Paper Structure
  • Figure 85: East Asia Market Value Share and BPS Analysis by Application, 2025 and 2035
  • Figure 86: East Asia Market Y-o-Y Growth Comparison by Application, 2025-2035
  • Figure 87: East Asia Market Attractiveness Analysis by Application
  • Figure 88: East Asia Market Value Share and BPS Analysis by End-Use Industry, 2025 and 2035
  • Figure 89: East Asia Market Y-o-Y Growth Comparison by End-Use Industry, 2025-2035
  • Figure 90: East Asia Market Attractiveness Analysis by End-Use Industry
  • Figure 91: South Asia & Pacific Market Value Share and BPS Analysis by Country, 2025 and 2035
  • Figure 92: South Asia & Pacific Market Value Share and BPS Analysis by Material Type, 2025 and 2035
  • Figure 93: South Asia & Pacific Market Y-o-Y Growth Comparison by Material Type, 2025-2035
  • Figure 94: South Asia & Pacific Market Attractiveness Analysis by Material Type
  • Figure 95: South Asia & Pacific Market Value Share and BPS Analysis by Paper Structure, 2025 and 2035
  • Figure 96: South Asia & Pacific Market Y-o-Y Growth Comparison by Paper Structure, 2025-2035
  • Figure 97: South Asia & Pacific Market Attractiveness Analysis by Paper Structure
  • Figure 98: South Asia & Pacific Market Value Share and BPS Analysis by Application, 2025 and 2035
  • Figure 99: South Asia & Pacific Market Y-o-Y Growth Comparison by Application, 2025-2035
  • Figure 100: South Asia & Pacific Market Attractiveness Analysis by Application
  • Figure 101: South Asia & Pacific Market Value Share and BPS Analysis by End-Use Industry, 2025 and 2035
  • Figure 102: South Asia & Pacific Market Y-o-Y Growth Comparison by End-Use Industry, 2025-2035
  • Figure 103: South Asia & Pacific Market Attractiveness Analysis by End-Use Industry
  • Figure 104: Middle East and Africa Market Value Share and BPS Analysis by Country, 2025 and 2035
  • Figure 105: Middle East and Africa Market Value Share and BPS Analysis by Material Type, 2025 and 2035
  • Figure 106: Middle East and Africa Market Y-o-Y Growth Comparison by Material Type, 2025-2035
  • Figure 107: Middle East and Africa Market Attractiveness Analysis by Material Type
  • Figure 108: Middle East and Africa Market Value Share and BPS Analysis by Paper Structure, 2025 and 2035
  • Figure 109: Middle East and Africa Market Y-o-Y Growth Comparison by Paper Structure, 2025-2035
  • Figure 110: Middle East and Africa Market Attractiveness Analysis by Paper Structure
  • Figure 111: Middle East and Africa Market Value Share and BPS Analysis by Application, 2025 and 2035
  • Figure 112: Middle East and Africa Market Y-o-Y Growth Comparison by Application, 2025-2035
  • Figure 113: Middle East and Africa Market Attractiveness Analysis by Application
  • Figure 114: Middle East and Africa Market Value Share and BPS Analysis by End-Use Industry, 2025 and 2035
  • Figure 115: Middle East and Africa Market Y-o-Y Growth Comparison by End-Use Industry, 2025-2035
  • Figure 116: Middle East and Africa Market Attractiveness Analysis by End-Use Industry
  • Figure 117: Global Market - Tier Structure Analysis
  • Figure 118: Global Market - Company Share Analysis

Frequently Asked Questions

What is the projected market size of the high stretch cushion paper industry in 2025 and 2035?

The industry size is projected to be USD 1.2 billion in 2025 and USD 1.8 billion by 2035.

What is the expected CAGR for the high stretch cushion paper industry from 2025 to 2035?

The expected CAGR is 4.1% from 2025 to 2035.

Which paper type dominates the high stretch cushion paper market in 2025?

Virgin kraft paper dominates the paper type segment with a 59% market share in 2025.

Who is the leading company in the high stretch cushion paper industry?

Storopack Italia is the leading company in the industry, holding a 16% market share.

What is the projected CAGR of the high stretch cushion paper market in India?

India is projected to grow at a CAGR of 4.1% from 2025 to 2035.

Explore Similar Insights

Future Market Insights

High Stretch Cushion Paper Market