High Impact Corrugated Boxes Market Outlook From 2025 to 2035

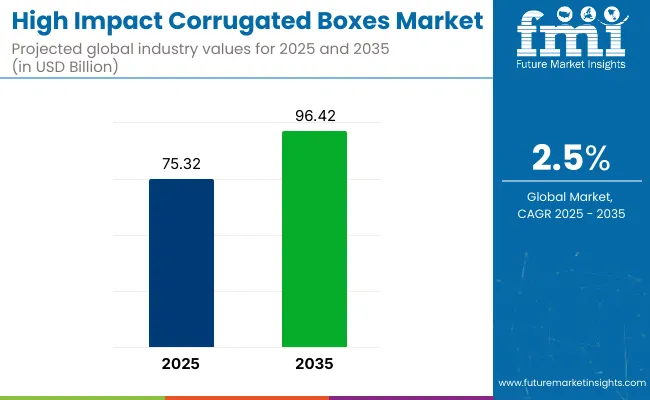
The High Impact Corrugated Boxes Market is set to experience substantial growth from 2025 to 2035, the global High Impact Corrugated Boxes Market is expected to grow dramatically, driven up by steadily rising demand for sustainable and protective packaging solutions among industries.

High Impact Corrugated Boxes Market

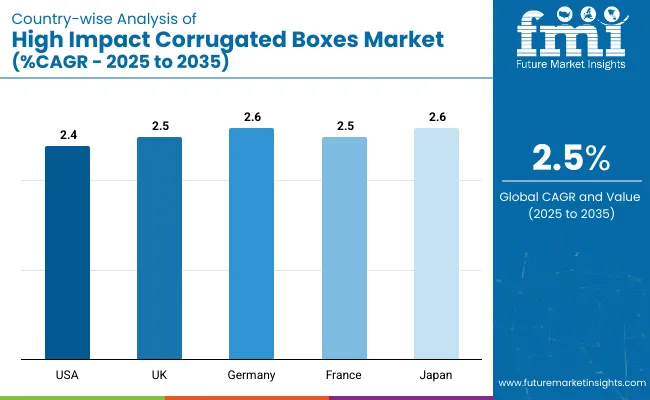
In addition to being durable and recyclable, corrugated boxes offer manufacturers of such commodities as e-commerce, food and beverage, electronics and auto parts a safer way to ship goods. Online order volumes and increasing environmental awareness are among the factors pushing growth in the market. The market is projected to surpass USD 96,420.9 Million by 2035, growing at a CAGR of 2.5% over the forecast period.

Regional Market Trends

North America

A study found that North America is a major market for high impact corrugated boxes. This is a force primarily introduced by the swift growth of e-commerce and needs for environmentally sound packaging materials to be used there. Within such countries the United States and Canada are the key figures, with top retailers and logistics companies making their selections in favour of recyclable or highest performance packaging materials.

As overseas regulations on packaging waste and the environment, manufacturers are also developing new varieties of corrugated box design. In contrast, demand is steadily increasing with home deliveries and business catering on the rise. Technical advances in wrapping machinery also raise efficiency and lower costs.

Europe

Europe is the young man on all fronts. Strong circular economy regulations from such sources as individual governments' own made policy has created tomorrow’s market that feeds back into environment. Germany, France, and the UK are well in the vanguard, leading the shift towards paper-based, three-dimensional environmentally conscious packaging materials such as recycled carton.

It is mostly the e-commerce sector that thrives on the continent today; already-aware consumers and government policies on environment protection take up more than half of all demand for such freight. And innovative package design, light-weight materials, as well as printing technology advances have boosted demand for high impact corrugated boxes across the board--among food, electronics and consumer goods markets alike.

Asia-Pacific

Asia & Pacific; with urbanization rates as high as other regions ('development' is something now available to all) and industrialization spreading faster than the light air itself has traditionally done so through a series of co-curious Christmas storybook illustrations we, unless otherwise specified hold the copyright for among major economic areas Capital markets or cities of London, Paris or Berlin China, India and Japan are important markets where rapid economic growth has been matched with consumer preferences that demand sustainable packaging solutions.

While global operations are expanding public awareness of environmentally friendly production, higher exports of goods also encourage manufacturers to make whatever changes need to be made for corrugated packaging possibilities.

Rest of the World

The high impact corrugated boxes market in the Rest of the World region, including Latin America, the Middle East, and Africa, is experiencing steady growth. Latin America's growth drivers are patterns such as increasing exports and widening sales methods. With strong demand, government policy responsible for encouraging new investments: Brazil and Mexico have taken the lead both countries are driving this market. The Middle East is seeing its logistics and retail sectors expanding - good products need high-performance packaging solutions. In Africa, better infrastructure and the growth of organized retail channels is enlivening sales.

Challenges and Opportunities

Challenge

Raw Material Price Volatility

High-impact corrugated boxes are confronted with the challenge of raw material price volatility, particularly paper and wood pulp. These cost proportional changes affect production budgets, making it difficult for manufacturers to maintain stable pricing strategies as well as profit margins. Added to this, the rising costs of energy and transportation serve to exacerbate the preceding problems.

Sustainability Regulations and Environmental Concerns

Though enforced variously in different countries and regions, increasing environmental regulations to eliminate packaging waste-reduce this “overhead” from our cardboard boxes so that only its contents count” as part of overall manufacturer liability. Governments and regulatory bodies encourage the use of recyclable and biodegradable substitutes for those materials currently being used in packaging, prompting manufacturers to invest significant sums in more environmentally sound products.

Opportunity

Rising Demand from E-commerce and Retail Industries

The burgeoning e-commerce sector has increased demand for durable, protective lightweight packing materials. High impact corrugated boxes are one example of this shift in orders from industrial markets to consumers and small businesses all over the country. Retailing and logistics companies pay particular attention to packaging which guarantees the safe arrival of their goods, especially items fragile or with high value.

Innovation in Eco-Friendly and High-Performance Materials

Company investing in ecological material and functional innovation opportunities abound. Development of sustainable, high-performance corrugated material, eco-based coating technologies, recyclable adhesives, and new structural design-these offerings from manufacturers can help protect the environment without losing durability or performance.

Shifts in the High Impact Corrugated Boxes Market from 2020 to 2024 and Future Trends 2025 to 2035
From 2020 to 2024, the High Impact Corrugated Boxes Market enjoyed rapid development. E-commerce continued growing quickly and demand for protective packaging soared alongside it. With industries streamlining their supply chains, both of these factors translated into increased sales of corrugated paper cardboard. Companies began to introduce recyclable or awesome twist flour-and-trash organic materials trying to face the environmental challenges of carton board. That made possible the printing of vivid images on paper.

Market Shifts: A Comparative Analysis 2020 to 2024 vs. 2025 to 2035.

Market Shift 2020 to 2024 Trends
Regulatory Landscape Compliance with initial recyclable packaging regulations
Market Demand Growth driven by e-commerce and retail logistics
Industry Adoption Increased use of conventional corrugated boxes
Supply Chain and Sourcing Dependence on traditional paper and pulp suppliers
Market Competition Presence of major packaging manufacturers and regional players
Market Growth Drivers E-commerce growth and protective packaging needs
Sustainability and Energy Efficiency Initial steps toward biodegradable coatings and recyclable adhesives
Integration of Digital Innovations Limited use of digital printing and product customization
Advancements in Packaging Technology Basic corrugated box designs with standard shock-absorbent properties
Market Shift 2025 to 2035 Projections
Regulatory Landscape Mandatory circular economy policies and zero-waste packaging standards
Market Demand Expansion into industrial, healthcare, and food sectors demanding sustainable and durable packaging
Industry Adoption Transition to smart packaging with integrated tracking and anti-counterfeit features
Supply Chain and Sourcing Shift toward alternative fibers and sustainable raw material sourcing
Market Competition Rise of eco-focused startups and global packaging firms specializing in high-performance and green packaging
Market Growth Drivers Adoption of smart, sustainable packaging technologies and regulatory incentives
Sustainability and Energy Efficiency Full-scale adoption of closed-loop systems and carbon-neutral manufacturing practices
Integration of Digital Innovations Widespread use of digital printing, QR codes, and smart sensors in packaging designs
Advancements in Packaging Technology Advanced structural designs offering lightweight, high-impact resistance with minimal environmental footprint

Country-wise Outlook

United States

Country-wide, the United States High Impact Corrugated Boxes Market currently undergoes slow but consistent demand. Although dense e-commerce is now well developed, driven by well-entrenched Food and Beverage industries and a robust consumer goods sector, these trades all prioritize reliable and robust means of packing: with In this environment high impact corrugated boxes are especially useful for ensuring products survive passage.

The growing preference for environmentally friendly, recycle packaging is also driving innovation in corrugating materials with these qualities. The US's growing online retailing sector outperforming global averages heralds renewed demand now seems such packaging must be impact-resistant as well.

Country CAGR (2025 to 2035)
United States 2.4%

United Kingdom

With a flourishing retail trade sector and its increasing emphasis on sustainable packaging solutions the United Kingdom High Impact Corrugated Boxes Market high impact corrugated boxes industry enjoys enormous potential. To satisfy both government expectations on packaging materials and the wishes of customers, British enterprises are following the trend by using durable and environmentally friendly corrugated boxes.

Increases in orders from e-commerce, pharmaceuticals and FMCG makers have further buoyed the market. Packaging producers are now deeply involved in developing high strength, low weight solutions which bring about not only savings on transport expenses but also help protect products. Despite an industry-wide shift toward substitute packaging materials, corrugated boxes nonetheless are an essential part of various trades because they can be adapted to different needs and replenished merely by recycling is necessary.

Country CAGR (2025 to 2035)
United Kingdom 2.5%

European Union

The High Impact Corrugated Boxes Market in the European Union is facing rising growth rates, supported by continued strong demand from food and drinks, electronics and motors. Protective packaging regulations have prompted companies in the EU to develop better quality ecological solutions for corrugated shipping containers.

The need to build a circular economy and reduce the amount of plastic used in packaging is helping to push the market forward. Germany, France, and Italy have all become leaders in promoting high performance corrugating packaging for industrial and retail uses. However, changes in consumer preferences for other kinds of packaging might gradually have a cooling effect on long-term demand.

Country CAGR (2025 to 2035)
European Union 2.6%

South Korea

South Korea's High Impact Corrugated Boxes Market as a result of its export-oriented economy, the burgeoning e-commerce boom this year is supported by sectors such as Electronics, Cosmetic Products and Food Exports. High-durability corrugated packaging is used by these sectors to deliver products intact through international shipments.

In South Korea, manufacturers are now making it their focus to integrate advanced production technologies and sustainable materials into new ranges of corrugated boxes designed for the future. On top of this, government decrees pointing the way for environmental packaging are pushing their recyclable, biodegradable corrugating solutions all the way from concept to actual merchandise. With the search taking on more dimensions currently, in addition to this greater emphasis on ecology, high impact corrugated boxes remain in demand throughout various industries as a vital packaging choice.

Country CAGR (2025 to 2035)
South Korea 2.7%

Segmentation Outlook

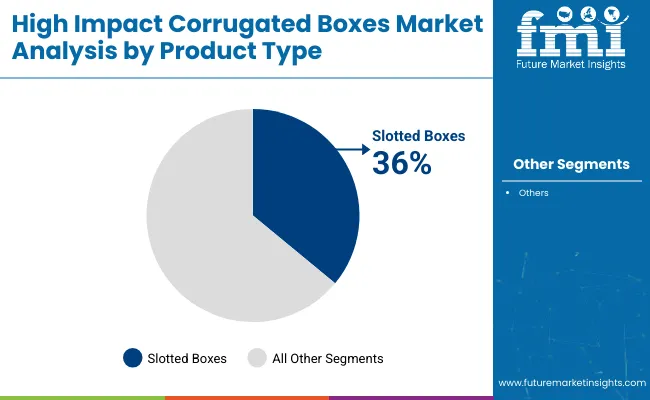
Slotted Box Leads the Market Due to Its Cost-Effectiveness and Versatile Design

The slotted box, also called the Regular Slotted Container (RSC), is the staple product of the high impact corrugated boxes market. It has dominated for the past 100 years, thanks to its straightforward and efficient design making it useful in a vast range of applications across industries such as ecommerce, electronics, automotive parts and consumer goods.

Slotted boxes are designed with flaps of equal length that close at the centre, which gives them great structural strength as well as resistance to impact. Just such range, together with slow production cost due to less scrap during manufacture, has meant that they have become widely used. Slotted boxes are therefore favoured by businesses for shipping and storage. They are simple to put together, can be combined with automation systems and come in a variety of sizes.

Slotted boxes are becoming increasingly popular because the burgeoning ecommerce industry requires them to provide reliable protective measures for goods on the move. Their recyclable and environmentally friendly nature also matches perfectly with growing consumer demands for sustainable packaging products, ensuring the continued prosperity of this part of the market.

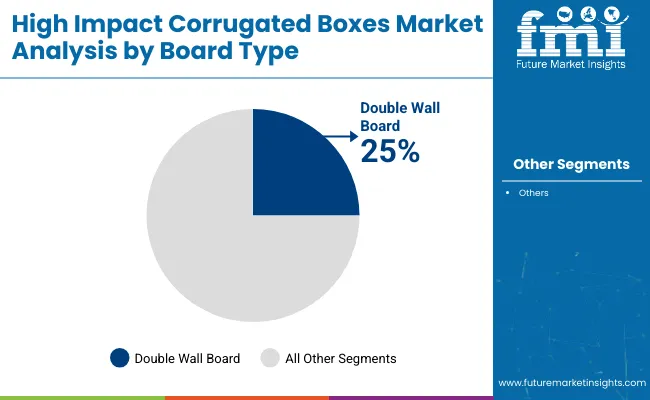
Double Wall Board Emerges as a Preferred Choice Due to Superior Strength and Durability

High tensile strength and the fact that it can take a crushing load without folding up, the double wall segment of the carton industry takes an important place in business. Composed of two layers of corrugated paper reinforcing material and three liners, double wall containers not only prevent items from being crushed to pieces but can form a hard shell that eliminates all external influences--shocks, vibrations even punctures.

This makes them ideal for transporting heavy or delicate components such as precision meter machinery parts, electronic equipment or chemicals used in manufacturing processes where, to destroy the contents. Double wall construction also increases resistance to compressive, stacking pressures and is particularly suitable for storage and conveyance that will involve rough treatment.

As international trade and logistics expand, more companies adopt double wall board corrugated boxes because they can offer secure transport and storage of value material that is temperature-sensitive. Furthermore, double wall corrugated board offers a cost-effective balance between performance and price. It provides more protection than single-wall boards but avoids the weight and expense of triple-wall solutions.

Competitive Outlook

Growing demand from major fields like e-commerce, food and beverage, pharmaceuticals and certainly industrial goods, the high-impact corrugated box industry sees good development momentum. More and more consumers are turning a watchful eye to eco- friendly, easily decomposable packaging solutions

Market Share Analysis by Key Players & Packaging Companies

Company/Organization Name Estimated Market Share (%)
International Paper Company 16-20%
WestRock Company 14-18%
Smurfit Kappa Group 12-16%
DS Smith Plc 10-14%
Georgia-Pacific LLC 8-12%
Other Manufacturers 30-40%

Key Company & Product Offerings

Company/Organization Name Key Offerings/Activities
International Paper Company Develops high-strength corrugated boxes with sustainable materials for heavy-duty and bulk packaging.
WestRock Company Offers innovative corrugated solutions, including impact-resistant boxes for e-commerce and industrial use.
Smurfit Kappa Group Specializes in sustainable and high-durability corrugated packaging for multiple industries.
DS Smith Plc Provides custom-designed corrugated boxes with superior cushioning and stacking strength.
Georgia-Pacific LLC Manufactures versatile corrugated boxes, emphasizing durability and lightweight packaging solutions.

Key Market Insights

International Paper Company (16-20%)

A market leader known for developing high-impact corrugated boxes suitable for bulk and industrial shipments.

WestRock Company (14-18%)

WestRock focuses on robust packaging for e-commerce and heavy-duty applications with an emphasis on sustainability.

Smurfit Kappa Group (12-16%)

Smurfit Kappa excels in providing eco-friendly, high-strength corrugated packaging for diverse end-use sectors.

DS Smith Plc (10-14%)

DS Smith offers tailored corrugated box solutions with a focus on protective packaging and optimized logistics.

Georgia-Pacific LLC (8-12%)

Georgia-Pacific manufactures heavy-duty corrugated boxes that meet high-impact and stacking strength requirements.

Other Key Players (30-40% Combined)

The market is supported by various regional and global manufacturers offering high-performance corrugated packaging, such as:

  • Packaging Corporation of America (PCA) (Heavy-duty corrugated box solutions for industrial use)
  • Rengo Co., Ltd. (Sustainable and high-durability corrugated packaging)
  • Oji Holdings Corporation (Custom corrugated box designs for protective shipping)
  • Mondi Group (Lightweight and impact-resistant corrugated boxes)

Key Segmentation

By Product Type:

  • Slotted Box
  • Folder Box
  • Telescope Box
  • Die Cut Box

By Board Type:

  • Single Face Board
  • Single Wall Board
  • Double Wall Board
  • Triple Wall Board

By End Use:

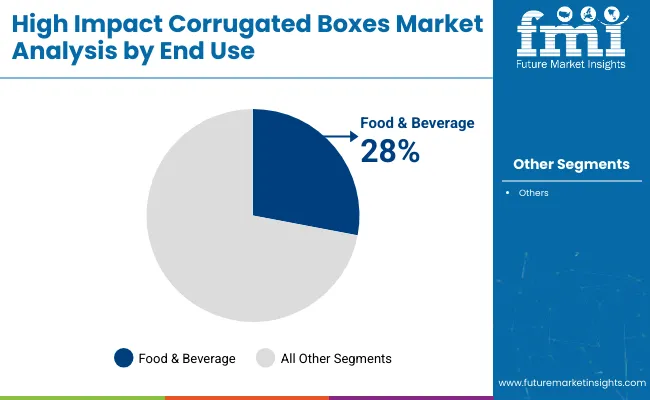
  • Food & Beverage
  • Electrical & Electronics
  • Homecare
  • Automotive & Allied Industries
  • Healthcare
  • Personal Care & Cosmetics
  • Other Industries

By Region:

  • North America
  • Latin America
  • Western Europe
  • Eastern Europe
  • South Asia and Pacific
  • East Asia
  • Middle East and Africa

Table of Content

  1. Executive Summary
  2. Industry Introduction, including Taxonomy and Market Definition
  3. Market Trends and Success Factors, including Macro-economic Factors, Market Dynamics, and Recent Industry Developments
  4. Global Market Demand Analysis 2020 to 2024 and Forecast 2025 to 2035, including Historical Analysis and Future Projections
  5. Global Market Analysis 2020 to 2024 and Forecast 2025 to 2035
    • Product Type
    • Board Type
    • End Use
  6. Global Market Analysis 2020 to 2024 and Forecast 2025 to 2035, By Product Type
    • Slotted Box
    • Folder Box
    • Telescope Box
    • Die Cut Box
  7. Global Market Analysis 2020 to 2024 and Forecast 2025 to 2035, By Board Type
    • Single Face Board
    • Single Wall Board
    • Double Wall Board
    • Triple Wall Board
  8. Global Market Analysis 2020 to 2024 and Forecast 2025 to 2035, By End Use
    • Food & Beverage
    • Electrical & Electronics
    • Homecare
    • Automotive & Allied Industries
    • Healthcare
    • Personal Care & Cosmetics
    • Other Industries
  9. Global Market Analysis 2020 to 2024 and Forecast 2025 to 2035, By Region
    • North America
    • Latin America
    • Western Europe
    • Eastern Europe
    • East Asia
    • South Asia Pacific
    • Middle East and Africa
  10. North America Sales Analysis 2020 to 2024 and Forecast 2025 to 2035, by Key Segments and Countries
  11. Latin America Sales Analysis 2020 to 2024 and Forecast 2025 to 2035, by Key Segments and Countries
  12. Western Europe Sales Analysis 2020 to 2024 and Forecast 2025 to 2035, by Key Segments and Countries
  13. Eastern Europe Sales Analysis 2020 to 2024 and Forecast 2025 to 2035, by Key Segments and Countries
  14. East Asia Sales Analysis 2020 to 2024 and Forecast 2025 to 2035, by Key Segments and Countries
  15. South Asia Pacific Sales Analysis 2020 to 2024 and Forecast 2025 to 2035, by Key Segments and Countries
  16. Middle East and Africa Sales Analysis 2020 to 2024 and Forecast 2025 to 2035, by Key Segments and Countries
  17. Sales Forecast 2025 to 2035 by Product Type, Board Type, and End Use for 30 Countries
  18. Competition Outlook, including Market Structure Analysis, Company Share Analysis by Key Players, and Competition Dashboard
  19. Company Profile
    • International Paper
    • D.S. Smith Packaging Limited
    • Oji Holdings Corporation
    • Georgia-Pacific LLC
    • WestRock Company
    • Elson International LLC
    • Aero Box LLC
    • Stamar Packaging Company Pvt. Ltd.
    • Albert Paper Products Co.
    • Associated Sales & Bag Company

List of Tables

Table 1: Global Market Value (US$ Million) Forecast by Region, 2018 to 2033

Table 2: Global Market Volume (Units) Forecast by Region, 2018 to 2033

Table 3: Global Market Value (US$ Million) Forecast by Product Type, 2018 to 2033

Table 4: Global Market Volume (Units) Forecast by Product Type, 2018 to 2033

Table 5: Global Market Value (US$ Million) Forecast by Board Type, 2018 to 2033

Table 6: Global Market Volume (Units) Forecast by Board Type, 2018 to 2033

Table 7: Global Market Value (US$ Million) Forecast by End Use, 2018 to 2033

Table 8: Global Market Volume (Units) Forecast by End Use, 2018 to 2033

Table 9: North America Market Value (US$ Million) Forecast by Country, 2018 to 2033

Table 10: North America Market Volume (Units) Forecast by Country, 2018 to 2033

Table 11: North America Market Value (US$ Million) Forecast by Product Type, 2018 to 2033

Table 12: North America Market Volume (Units) Forecast by Product Type, 2018 to 2033

Table 13: North America Market Value (US$ Million) Forecast by Board Type, 2018 to 2033

Table 14: North America Market Volume (Units) Forecast by Board Type, 2018 to 2033

Table 15: North America Market Value (US$ Million) Forecast by End Use, 2018 to 2033

Table 16: North America Market Volume (Units) Forecast by End Use, 2018 to 2033

Table 17: Latin America Market Value (US$ Million) Forecast by Country, 2018 to 2033

Table 18: Latin America Market Volume (Units) Forecast by Country, 2018 to 2033

Table 19: Latin America Market Value (US$ Million) Forecast by Product Type, 2018 to 2033

Table 20: Latin America Market Volume (Units) Forecast by Product Type, 2018 to 2033

Table 21: Latin America Market Value (US$ Million) Forecast by Board Type, 2018 to 2033

Table 22: Latin America Market Volume (Units) Forecast by Board Type, 2018 to 2033

Table 23: Latin America Market Value (US$ Million) Forecast by End Use, 2018 to 2033

Table 24: Latin America Market Volume (Units) Forecast by End Use, 2018 to 2033

Table 25: Western Europe Market Value (US$ Million) Forecast by Country, 2018 to 2033

Table 26: Western Europe Market Volume (Units) Forecast by Country, 2018 to 2033

Table 27: Western Europe Market Value (US$ Million) Forecast by Product Type, 2018 to 2033

Table 28: Western Europe Market Volume (Units) Forecast by Product Type, 2018 to 2033

Table 29: Western Europe Market Value (US$ Million) Forecast by Board Type, 2018 to 2033

Table 30: Western Europe Market Volume (Units) Forecast by Board Type, 2018 to 2033

Table 31: Western Europe Market Value (US$ Million) Forecast by End Use, 2018 to 2033

Table 32: Western Europe Market Volume (Units) Forecast by End Use, 2018 to 2033

Table 33: Eastern Europe Market Value (US$ Million) Forecast by Country, 2018 to 2033

Table 34: Eastern Europe Market Volume (Units) Forecast by Country, 2018 to 2033

Table 35: Eastern Europe Market Value (US$ Million) Forecast by Product Type, 2018 to 2033

Table 36: Eastern Europe Market Volume (Units) Forecast by Product Type, 2018 to 2033

Table 37: Eastern Europe Market Value (US$ Million) Forecast by Board Type, 2018 to 2033

Table 38: Eastern Europe Market Volume (Units) Forecast by Board Type, 2018 to 2033

Table 39: Eastern Europe Market Value (US$ Million) Forecast by End Use, 2018 to 2033

Table 40: Eastern Europe Market Volume (Units) Forecast by End Use, 2018 to 2033

Table 41: South Asia and Pacific Market Value (US$ Million) Forecast by Country, 2018 to 2033

Table 42: South Asia and Pacific Market Volume (Units) Forecast by Country, 2018 to 2033

Table 43: South Asia and Pacific Market Value (US$ Million) Forecast by Product Type, 2018 to 2033

Table 44: South Asia and Pacific Market Volume (Units) Forecast by Product Type, 2018 to 2033

Table 45: South Asia and Pacific Market Value (US$ Million) Forecast by Board Type, 2018 to 2033

Table 46: South Asia and Pacific Market Volume (Units) Forecast by Board Type, 2018 to 2033

Table 47: South Asia and Pacific Market Value (US$ Million) Forecast by End Use, 2018 to 2033

Table 48: South Asia and Pacific Market Volume (Units) Forecast by End Use, 2018 to 2033

Table 49: East Asia Market Value (US$ Million) Forecast by Country, 2018 to 2033

Table 50: East Asia Market Volume (Units) Forecast by Country, 2018 to 2033

Table 51: East Asia Market Value (US$ Million) Forecast by Product Type, 2018 to 2033

Table 52: East Asia Market Volume (Units) Forecast by Product Type, 2018 to 2033

Table 53: East Asia Market Value (US$ Million) Forecast by Board Type, 2018 to 2033

Table 54: East Asia Market Volume (Units) Forecast by Board Type, 2018 to 2033

Table 55: East Asia Market Value (US$ Million) Forecast by End Use, 2018 to 2033

Table 56: East Asia Market Volume (Units) Forecast by End Use, 2018 to 2033

Table 57: Middle East and Africa Market Value (US$ Million) Forecast by Country, 2018 to 2033

Table 58: Middle East and Africa Market Volume (Units) Forecast by Country, 2018 to 2033

Table 59: Middle East and Africa Market Value (US$ Million) Forecast by Product Type, 2018 to 2033

Table 60: Middle East and Africa Market Volume (Units) Forecast by Product Type, 2018 to 2033

Table 61: Middle East and Africa Market Value (US$ Million) Forecast by Board Type, 2018 to 2033

Table 62: Middle East and Africa Market Volume (Units) Forecast by Board Type, 2018 to 2033

Table 63: Middle East and Africa Market Value (US$ Million) Forecast by End Use, 2018 to 2033

Table 64: Middle East and Africa Market Volume (Units) Forecast by End Use, 2018 to 2033

List of Figures

Figure 1: Global Market Value (US$ Million) by Product Type, 2023 to 2033

Figure 2: Global Market Value (US$ Million) by Board Type, 2023 to 2033

Figure 3: Global Market Value (US$ Million) by End Use, 2023 to 2033

Figure 4: Global Market Value (US$ Million) by Region, 2023 to 2033

Figure 5: Global Market Value (US$ Million) Analysis by Region, 2018 to 2033

Figure 6: Global Market Volume (Units) Analysis by Region, 2018 to 2033

Figure 7: Global Market Value Share (%) and BPS Analysis by Region, 2023 to 2033

Figure 8: Global Market Y-o-Y Growth (%) Projections by Region, 2023 to 2033

Figure 9: Global Market Value (US$ Million) Analysis by Product Type, 2018 to 2033

Figure 10: Global Market Volume (Units) Analysis by Product Type, 2018 to 2033

Figure 11: Global Market Value Share (%) and BPS Analysis by Product Type, 2023 to 2033

Figure 12: Global Market Y-o-Y Growth (%) Projections by Product Type, 2023 to 2033

Figure 13: Global Market Value (US$ Million) Analysis by Board Type, 2018 to 2033

Figure 14: Global Market Volume (Units) Analysis by Board Type, 2018 to 2033

Figure 15: Global Market Value Share (%) and BPS Analysis by Board Type, 2023 to 2033

Figure 16: Global Market Y-o-Y Growth (%) Projections by Board Type, 2023 to 2033

Figure 17: Global Market Value (US$ Million) Analysis by End Use, 2018 to 2033

Figure 18: Global Market Volume (Units) Analysis by End Use, 2018 to 2033

Figure 19: Global Market Value Share (%) and BPS Analysis by End Use, 2023 to 2033

Figure 20: Global Market Y-o-Y Growth (%) Projections by End Use, 2023 to 2033

Figure 21: Global Market Attractiveness by Product Type, 2023 to 2033

Figure 22: Global Market Attractiveness by Board Type, 2023 to 2033

Figure 23: Global Market Attractiveness by End Use, 2023 to 2033

Figure 24: Global Market Attractiveness by Region, 2023 to 2033

Figure 25: North America Market Value (US$ Million) by Product Type, 2023 to 2033

Figure 26: North America Market Value (US$ Million) by Board Type, 2023 to 2033

Figure 27: North America Market Value (US$ Million) by End Use, 2023 to 2033

Figure 28: North America Market Value (US$ Million) by Country, 2023 to 2033

Figure 29: North America Market Value (US$ Million) Analysis by Country, 2018 to 2033

Figure 30: North America Market Volume (Units) Analysis by Country, 2018 to 2033

Figure 31: North America Market Value Share (%) and BPS Analysis by Country, 2023 to 2033

Figure 32: North America Market Y-o-Y Growth (%) Projections by Country, 2023 to 2033

Figure 33: North America Market Value (US$ Million) Analysis by Product Type, 2018 to 2033

Figure 34: North America Market Volume (Units) Analysis by Product Type, 2018 to 2033

Figure 35: North America Market Value Share (%) and BPS Analysis by Product Type, 2023 to 2033

Figure 36: North America Market Y-o-Y Growth (%) Projections by Product Type, 2023 to 2033

Figure 37: North America Market Value (US$ Million) Analysis by Board Type, 2018 to 2033

Figure 38: North America Market Volume (Units) Analysis by Board Type, 2018 to 2033

Figure 39: North America Market Value Share (%) and BPS Analysis by Board Type, 2023 to 2033

Figure 40: North America Market Y-o-Y Growth (%) Projections by Board Type, 2023 to 2033

Figure 41: North America Market Value (US$ Million) Analysis by End Use, 2018 to 2033

Figure 42: North America Market Volume (Units) Analysis by End Use, 2018 to 2033

Figure 43: North America Market Value Share (%) and BPS Analysis by End Use, 2023 to 2033

Figure 44: North America Market Y-o-Y Growth (%) Projections by End Use, 2023 to 2033

Figure 45: North America Market Attractiveness by Product Type, 2023 to 2033

Figure 46: North America Market Attractiveness by Board Type, 2023 to 2033

Figure 47: North America Market Attractiveness by End Use, 2023 to 2033

Figure 48: North America Market Attractiveness by Country, 2023 to 2033

Figure 49: Latin America Market Value (US$ Million) by Product Type, 2023 to 2033

Figure 50: Latin America Market Value (US$ Million) by Board Type, 2023 to 2033

Figure 51: Latin America Market Value (US$ Million) by End Use, 2023 to 2033

Figure 52: Latin America Market Value (US$ Million) by Country, 2023 to 2033

Figure 53: Latin America Market Value (US$ Million) Analysis by Country, 2018 to 2033

Figure 54: Latin America Market Volume (Units) Analysis by Country, 2018 to 2033

Figure 55: Latin America Market Value Share (%) and BPS Analysis by Country, 2023 to 2033

Figure 56: Latin America Market Y-o-Y Growth (%) Projections by Country, 2023 to 2033

Figure 57: Latin America Market Value (US$ Million) Analysis by Product Type, 2018 to 2033

Figure 58: Latin America Market Volume (Units) Analysis by Product Type, 2018 to 2033

Figure 59: Latin America Market Value Share (%) and BPS Analysis by Product Type, 2023 to 2033

Figure 60: Latin America Market Y-o-Y Growth (%) Projections by Product Type, 2023 to 2033

Figure 61: Latin America Market Value (US$ Million) Analysis by Board Type, 2018 to 2033

Figure 62: Latin America Market Volume (Units) Analysis by Board Type, 2018 to 2033

Figure 63: Latin America Market Value Share (%) and BPS Analysis by Board Type, 2023 to 2033

Figure 64: Latin America Market Y-o-Y Growth (%) Projections by Board Type, 2023 to 2033

Figure 65: Latin America Market Value (US$ Million) Analysis by End Use, 2018 to 2033

Figure 66: Latin America Market Volume (Units) Analysis by End Use, 2018 to 2033

Figure 67: Latin America Market Value Share (%) and BPS Analysis by End Use, 2023 to 2033

Figure 68: Latin America Market Y-o-Y Growth (%) Projections by End Use, 2023 to 2033

Figure 69: Latin America Market Attractiveness by Product Type, 2023 to 2033

Figure 70: Latin America Market Attractiveness by Board Type, 2023 to 2033

Figure 71: Latin America Market Attractiveness by End Use, 2023 to 2033

Figure 72: Latin America Market Attractiveness by Country, 2023 to 2033

Figure 73: Western Europe Market Value (US$ Million) by Product Type, 2023 to 2033

Figure 74: Western Europe Market Value (US$ Million) by Board Type, 2023 to 2033

Figure 75: Western Europe Market Value (US$ Million) by End Use, 2023 to 2033

Figure 76: Western Europe Market Value (US$ Million) by Country, 2023 to 2033

Figure 77: Western Europe Market Value (US$ Million) Analysis by Country, 2018 to 2033

Figure 78: Western Europe Market Volume (Units) Analysis by Country, 2018 to 2033

Figure 79: Western Europe Market Value Share (%) and BPS Analysis by Country, 2023 to 2033

Figure 80: Western Europe Market Y-o-Y Growth (%) Projections by Country, 2023 to 2033

Figure 81: Western Europe Market Value (US$ Million) Analysis by Product Type, 2018 to 2033

Figure 82: Western Europe Market Volume (Units) Analysis by Product Type, 2018 to 2033

Figure 83: Western Europe Market Value Share (%) and BPS Analysis by Product Type, 2023 to 2033

Figure 84: Western Europe Market Y-o-Y Growth (%) Projections by Product Type, 2023 to 2033

Figure 85: Western Europe Market Value (US$ Million) Analysis by Board Type, 2018 to 2033

Figure 86: Western Europe Market Volume (Units) Analysis by Board Type, 2018 to 2033

Figure 87: Western Europe Market Value Share (%) and BPS Analysis by Board Type, 2023 to 2033

Figure 88: Western Europe Market Y-o-Y Growth (%) Projections by Board Type, 2023 to 2033

Figure 89: Western Europe Market Value (US$ Million) Analysis by End Use, 2018 to 2033

Figure 90: Western Europe Market Volume (Units) Analysis by End Use, 2018 to 2033

Figure 91: Western Europe Market Value Share (%) and BPS Analysis by End Use, 2023 to 2033

Figure 92: Western Europe Market Y-o-Y Growth (%) Projections by End Use, 2023 to 2033

Figure 93: Western Europe Market Attractiveness by Product Type, 2023 to 2033

Figure 94: Western Europe Market Attractiveness by Board Type, 2023 to 2033

Figure 95: Western Europe Market Attractiveness by End Use, 2023 to 2033

Figure 96: Western Europe Market Attractiveness by Country, 2023 to 2033

Figure 97: Eastern Europe Market Value (US$ Million) by Product Type, 2023 to 2033

Figure 98: Eastern Europe Market Value (US$ Million) by Board Type, 2023 to 2033

Figure 99: Eastern Europe Market Value (US$ Million) by End Use, 2023 to 2033

Figure 100: Eastern Europe Market Value (US$ Million) by Country, 2023 to 2033

Figure 101: Eastern Europe Market Value (US$ Million) Analysis by Country, 2018 to 2033

Figure 102: Eastern Europe Market Volume (Units) Analysis by Country, 2018 to 2033

Figure 103: Eastern Europe Market Value Share (%) and BPS Analysis by Country, 2023 to 2033

Figure 104: Eastern Europe Market Y-o-Y Growth (%) Projections by Country, 2023 to 2033

Figure 105: Eastern Europe Market Value (US$ Million) Analysis by Product Type, 2018 to 2033

Figure 106: Eastern Europe Market Volume (Units) Analysis by Product Type, 2018 to 2033

Figure 107: Eastern Europe Market Value Share (%) and BPS Analysis by Product Type, 2023 to 2033

Figure 108: Eastern Europe Market Y-o-Y Growth (%) Projections by Product Type, 2023 to 2033

Figure 109: Eastern Europe Market Value (US$ Million) Analysis by Board Type, 2018 to 2033

Figure 110: Eastern Europe Market Volume (Units) Analysis by Board Type, 2018 to 2033

Figure 111: Eastern Europe Market Value Share (%) and BPS Analysis by Board Type, 2023 to 2033

Figure 112: Eastern Europe Market Y-o-Y Growth (%) Projections by Board Type, 2023 to 2033

Figure 113: Eastern Europe Market Value (US$ Million) Analysis by End Use, 2018 to 2033

Figure 114: Eastern Europe Market Volume (Units) Analysis by End Use, 2018 to 2033

Figure 115: Eastern Europe Market Value Share (%) and BPS Analysis by End Use, 2023 to 2033

Figure 116: Eastern Europe Market Y-o-Y Growth (%) Projections by End Use, 2023 to 2033

Figure 117: Eastern Europe Market Attractiveness by Product Type, 2023 to 2033

Figure 118: Eastern Europe Market Attractiveness by Board Type, 2023 to 2033

Figure 119: Eastern Europe Market Attractiveness by End Use, 2023 to 2033

Figure 120: Eastern Europe Market Attractiveness by Country, 2023 to 2033

Figure 121: South Asia and Pacific Market Value (US$ Million) by Product Type, 2023 to 2033

Figure 122: South Asia and Pacific Market Value (US$ Million) by Board Type, 2023 to 2033

Figure 123: South Asia and Pacific Market Value (US$ Million) by End Use, 2023 to 2033

Figure 124: South Asia and Pacific Market Value (US$ Million) by Country, 2023 to 2033

Figure 125: South Asia and Pacific Market Value (US$ Million) Analysis by Country, 2018 to 2033

Figure 126: South Asia and Pacific Market Volume (Units) Analysis by Country, 2018 to 2033

Figure 127: South Asia and Pacific Market Value Share (%) and BPS Analysis by Country, 2023 to 2033

Figure 128: South Asia and Pacific Market Y-o-Y Growth (%) Projections by Country, 2023 to 2033

Figure 129: South Asia and Pacific Market Value (US$ Million) Analysis by Product Type, 2018 to 2033

Figure 130: South Asia and Pacific Market Volume (Units) Analysis by Product Type, 2018 to 2033

Figure 131: South Asia and Pacific Market Value Share (%) and BPS Analysis by Product Type, 2023 to 2033

Figure 132: South Asia and Pacific Market Y-o-Y Growth (%) Projections by Product Type, 2023 to 2033

Figure 133: South Asia and Pacific Market Value (US$ Million) Analysis by Board Type, 2018 to 2033

Figure 134: South Asia and Pacific Market Volume (Units) Analysis by Board Type, 2018 to 2033

Figure 135: South Asia and Pacific Market Value Share (%) and BPS Analysis by Board Type, 2023 to 2033

Figure 136: South Asia and Pacific Market Y-o-Y Growth (%) Projections by Board Type, 2023 to 2033

Figure 137: South Asia and Pacific Market Value (US$ Million) Analysis by End Use, 2018 to 2033

Figure 138: South Asia and Pacific Market Volume (Units) Analysis by End Use, 2018 to 2033

Figure 139: South Asia and Pacific Market Value Share (%) and BPS Analysis by End Use, 2023 to 2033

Figure 140: South Asia and Pacific Market Y-o-Y Growth (%) Projections by End Use, 2023 to 2033

Figure 141: South Asia and Pacific Market Attractiveness by Product Type, 2023 to 2033

Figure 142: South Asia and Pacific Market Attractiveness by Board Type, 2023 to 2033

Figure 143: South Asia and Pacific Market Attractiveness by End Use, 2023 to 2033

Figure 144: South Asia and Pacific Market Attractiveness by Country, 2023 to 2033

Figure 145: East Asia Market Value (US$ Million) by Product Type, 2023 to 2033

Figure 146: East Asia Market Value (US$ Million) by Board Type, 2023 to 2033

Figure 147: East Asia Market Value (US$ Million) by End Use, 2023 to 2033

Figure 148: East Asia Market Value (US$ Million) by Country, 2023 to 2033

Figure 149: East Asia Market Value (US$ Million) Analysis by Country, 2018 to 2033

Figure 150: East Asia Market Volume (Units) Analysis by Country, 2018 to 2033

Figure 151: East Asia Market Value Share (%) and BPS Analysis by Country, 2023 to 2033

Figure 152: East Asia Market Y-o-Y Growth (%) Projections by Country, 2023 to 2033

Figure 153: East Asia Market Value (US$ Million) Analysis by Product Type, 2018 to 2033

Figure 154: East Asia Market Volume (Units) Analysis by Product Type, 2018 to 2033

Figure 155: East Asia Market Value Share (%) and BPS Analysis by Product Type, 2023 to 2033

Figure 156: East Asia Market Y-o-Y Growth (%) Projections by Product Type, 2023 to 2033

Figure 157: East Asia Market Value (US$ Million) Analysis by Board Type, 2018 to 2033

Figure 158: East Asia Market Volume (Units) Analysis by Board Type, 2018 to 2033

Figure 159: East Asia Market Value Share (%) and BPS Analysis by Board Type, 2023 to 2033

Figure 160: East Asia Market Y-o-Y Growth (%) Projections by Board Type, 2023 to 2033

Figure 161: East Asia Market Value (US$ Million) Analysis by End Use, 2018 to 2033

Figure 162: East Asia Market Volume (Units) Analysis by End Use, 2018 to 2033

Figure 163: East Asia Market Value Share (%) and BPS Analysis by End Use, 2023 to 2033

Figure 164: East Asia Market Y-o-Y Growth (%) Projections by End Use, 2023 to 2033

Figure 165: East Asia Market Attractiveness by Product Type, 2023 to 2033

Figure 166: East Asia Market Attractiveness by Board Type, 2023 to 2033

Figure 167: East Asia Market Attractiveness by End Use, 2023 to 2033

Figure 168: East Asia Market Attractiveness by Country, 2023 to 2033

Figure 169: Middle East and Africa Market Value (US$ Million) by Product Type, 2023 to 2033

Figure 170: Middle East and Africa Market Value (US$ Million) by Board Type, 2023 to 2033

Figure 171: Middle East and Africa Market Value (US$ Million) by End Use, 2023 to 2033

Figure 172: Middle East and Africa Market Value (US$ Million) by Country, 2023 to 2033

Figure 173: Middle East and Africa Market Value (US$ Million) Analysis by Country, 2018 to 2033

Figure 174: Middle East and Africa Market Volume (Units) Analysis by Country, 2018 to 2033

Figure 175: Middle East and Africa Market Value Share (%) and BPS Analysis by Country, 2023 to 2033

Figure 176: Middle East and Africa Market Y-o-Y Growth (%) Projections by Country, 2023 to 2033

Figure 177: Middle East and Africa Market Value (US$ Million) Analysis by Product Type, 2018 to 2033

Figure 178: Middle East and Africa Market Volume (Units) Analysis by Product Type, 2018 to 2033

Figure 179: Middle East and Africa Market Value Share (%) and BPS Analysis by Product Type, 2023 to 2033

Figure 180: Middle East and Africa Market Y-o-Y Growth (%) Projections by Product Type, 2023 to 2033

Figure 181: Middle East and Africa Market Value (US$ Million) Analysis by Board Type, 2018 to 2033

Figure 182: Middle East and Africa Market Volume (Units) Analysis by Board Type, 2018 to 2033

Figure 183: Middle East and Africa Market Value Share (%) and BPS Analysis by Board Type, 2023 to 2033

Figure 184: Middle East and Africa Market Y-o-Y Growth (%) Projections by Board Type, 2023 to 2033

Figure 185: Middle East and Africa Market Value (US$ Million) Analysis by End Use, 2018 to 2033

Figure 186: Middle East and Africa Market Volume (Units) Analysis by End Use, 2018 to 2033

Figure 187: Middle East and Africa Market Value Share (%) and BPS Analysis by End Use, 2023 to 2033

Figure 188: Middle East and Africa Market Y-o-Y Growth (%) Projections by End Use, 2023 to 2033

Figure 189: Middle East and Africa Market Attractiveness by Product Type, 2023 to 2033

Figure 190: Middle East and Africa Market Attractiveness by Board Type, 2023 to 2033

Figure 191: Middle East and Africa Market Attractiveness by End Use, 2023 to 2033

Figure 192: Middle East and Africa Market Attractiveness by Country, 2023 to 2033

Frequently Asked Questions

What was the overall size of the high impact corrugated boxes market in 2025?

The overall market size for high impact corrugated boxes market was USD 75,323.9 Million in 2025.

How big the bio is based high impact corrugated boxes market expected in 2035?

The high impact corrugated boxes market is expected to reach USD 96,420.9 Million in 2035.

What will drive the demand for high impact corrugated boxes market during the forecast period?

The demand for high impact corrugated boxes will be driven by growing e-commerce, increasing need for sustainable packaging, rising industrial shipments, and expanding food and beverage sectors across slotted, folder, telescope, and die cut box segments.

List the top 5 countries contributing in high impact corrugated boxes market?

The top 5 countries which drives the development of high impact corrugated boxes market are USA, European Union, Japan, South Korea and UK.

Which segment in type is expected to lead high impact corrugated boxes market?

Slotted Box demand supplier to command significant share over the assessment period.

Explore Packaging Formats Insights

Future Market Insights

High Impact Corrugated Boxes Market