Sustainable Pharmaceutical Packaging Market Outlook (2024 to 2034)

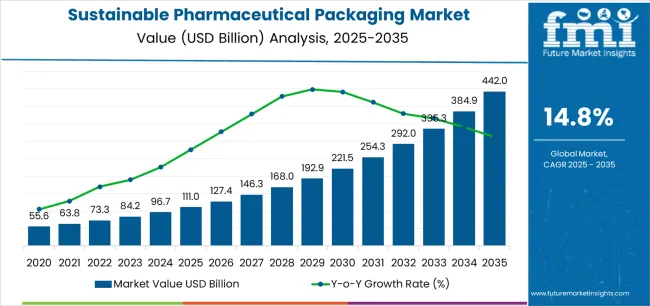
The global sustainable pharmaceutical packaging market size is anticipated to be worth US$ 410 billion by 2034. According to the estimates, the market is projected to clock a 15.6% CAGR until 2034. In 2024, the sustainable pharmaceutical packaging market size is valued at US$ 96 billion.

Attributes Details
Sustainable Pharmaceutical Packaging Market Size, 2023 US$ 83.8 billion
Sustainable Pharmaceutical Packaging Market Size, 2024 US$ 96 billion
Sustainable Pharmaceutical Packaging Market Size, 2034 US$ 410 billion
Value CAGR (2024 to 2034) 15.6%

Don't pay for what you don't need

Customize your report by selecting specific countries or regions and save 30%!

Key Market Highlights

Compostable Packaging Materials Continue to Gain Prominence in the Market

The pharmaceutical sector addresses environmental issues related to conventional packaging materials by implementing compostable pharmaceutical packaging materials. Renewably sourced compostable materials spontaneously decompose into organic molecules, decreasing waste and having a minimal negative environmental impact.

This trend is in line with customer desires for eco-packaging for pharmaceuticals, legal requirements, and company sustainability aims. Pharmaceutical firms can demonstrate ecological responsibility, lower their carbon footprint, and improve brand perception by investing in biodegradable pharmaceutical packaging materials.

Moreover, compostable pharmaceutical packaging solutions support the circular economy by encouraging resource conservation and easing the shift to a more sustainable packaging environment.

Robotics and Automation Integration in Packaging Processes Rises in the Market

Robots and automation can make green pharmaceutical packaging operations more productive, accurate, and efficient. Automated packing systems enhance productivity and product quality by streamlining processes, cutting labor costs, and minimizing mistakes.

Pharmaceutical production is experiencing digital transformation and innovation due to this trend, which aligns with the concepts of Industry 4.0. Businesses can boost operational efficiency, scalability, and flexibility while gaining a competitive edge by investing in robots and automation technology.

Additionally, robotic pharmaceutical packaging solutions help achieve sustainability objectives by lowering energy usage, waste production from materials, and environmental damage caused by labor-intensive manual procedures.

Developing Modular and Reconfigurable Packaging Solutions Presents Opportunities in the Market

Creating modular and reconfigurable pharmaceutical packaging solutions provides a special chance to maximize the effectiveness and versatility of packaging. Packaging solutions that are quickly adjusted for varying product sizes, formats, or transportation needs save material waste and improve operational flexibility.

Pharmaceutical companies can improve sustainability measures, reduce costs, and expedite packaging operations by taking advantage of this opportunity that is in accordance with lean manufacturing principles.

Businesses can achieve operational excellence and environmental responsibility by positioning themselves as resource-efficient and adaptable by implementing reconfigurable and modular pharmaceutical packaging solutions.

Sustainable Pharmaceutical Packaging Market Trends

Trends
  • As a sustainable alternative, edible pharmaceutical packaging materials derived from natural substances are being investigated. Although it's still in its nascent stages, edible pharmaceutical packaging has the potential to save waste and offer a creative, eco-friendly alternative.
  • Pharmaceutical firms are continually looking for creative ways to implement recyclable pharmaceutical packaging materials to mitigate the negative environmental effects of plastic waste.
  • Pharmaceutical firms are looking into ways to develop closed-loop systems that reduce waste by recovering and reusing packaging materials, thereby enhancing the sustainability and circularity of the supply chain.
  • The use of 3D printing technology in pharmaceutical packaging is growing, allowing businesses to create solutions specifically suited to individual products' needs. This trend increases supply chain efficiency, decreases material waste, and simplifies production operations.
  • Using renewable energy sources to produce sustainable medication packaging materials is a smart step that supports businesses in attaining sustainability objectives.
Opportunities
  • The rise in e-commerce pharmaceutical sales offers businesses the chance to create environment-conscious pharmaceutical packaging solutions that meet the particular difficulties of the digital distribution channel.
  • Using blockchain technology to track the environmental effect of sustainable packaging materials for drugs and improve supply chain transparency offers an avenue to increase customer trust in sustainable practices and responsibility.
  • Growing environmental consciousness and developing pharmaceutical markets in emerging countries provide businesses with opportunities to adopt sustainable packaging methods in these growing regions.
  • Creative approaches to cold chain packaging provide a unique chance to tackle environmental issues related to temperature-sensitive pharmaceuticals.
  • Creating bio-based pharmaceutical packaging solutions offers an exceptional opportunity to include natural source functional additives into packaging materials.
Challenges
  • Concerns about greenwashing, which can undermine confidence in sustainable projects, can arise from businesses inflating or deceiving customers about the environmental advantages of their packaging.
  • For businesses hoping to create a closed-loop system, certain sustainable packaging materials aren't guaranteed as recyclable or have as much recycling infrastructure available.
Ismail Sutaria
Ismail Sutaria

Principal Consultant

Talk to Analyst

Find your sweet spots for generating winning opportunities in this market.

Comparative View of Markets Adjacent to Sustainable Pharmaceutical Packaging

This section compares the Pharmaceutical Packaging Market and the Biopharmaceutical Packaging Market. According to the analysis, the increasing prevalence of chronic diseases is an integral growth driver for these markets. The growing awareness of environmental issues propels sustainability trends in the healthcare sector, pushing companies to seek alternatives.

The development of new drugs and pharmaceuticals is likely to bolster growth in these markets in the coming years. Innovations in packaging solutions are expected to catapult growth in these markets.

Sustainable Pharmaceutical Packaging Market:

Attributes Sustainable Pharmaceutical Packaging Market
CAGR (2024 to 2034) 15.6%
Growth Factors
  • Increasing demand for ecofriendly packaging.
  • Increasing cost efficiency of sustainable packaging technologies.
Future Opportunities Innovations in materials.
Market Trends Growing adoption of circular economy approaches.

Pharmaceutical Packaging Market:

Attributes Pharmaceutical Packaging Market
CAGR (2024 to 2034) 6.4%
Growth Factors
  • Growing expenditure on pharmaceuticals globally.
  • Rising prevalence of retail pharmacies in emerging markets.
Future Opportunities Development of new pharmaceuticals or medicines.
Market Trends Increasing focus on product differentiation and brand promotion.

Biopharmaceutical Packaging Market:

Attributes Biopharmaceutical Packaging Market
CAGR (2024 to 2034) 7%
Growth Factors
  • Rising demand for pharmaceutical drugs and medicines.
  • Surging prevalence of chronic diseases.
Future Opportunities Improved shelf life of products.
Market Trends Rising emphasis on developing treatments and drugs for rare diseases.

Category-wise Insights

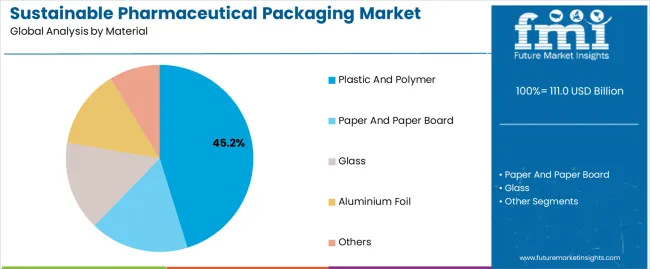
Plastic and Polymer Continue to Dominate as the Top Material in the Market

Segment Plastic and Polymer (Material)
Value CAGR (2024 to 2034) 15.3%

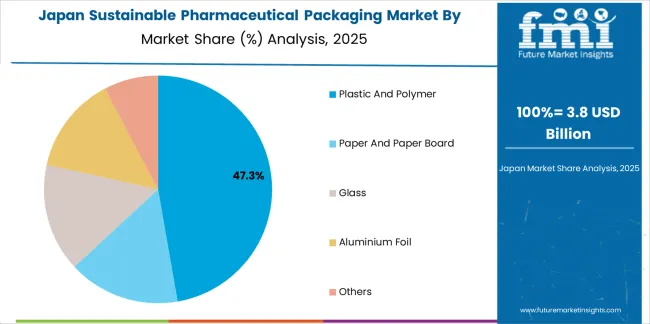
Based on material, the plastic and polymer segment is predicted to expand at a 15.3% CAGR through 2034.

  • Technological developments have yielded sustainable plastics derived from biodegradable or renewable resources. By addressing the environmental issues related to conventional plastics, these eco-friendly substitutes satisfy the pharmaceutical industry's increasing need for sustainable packaging options.
  • Numerous items made of plastic and polymers can be recycled, supporting efforts to promote resource conservation and reduce waste through the circular economy. Packaging systems that allow closed-loop supply chains and enable recycling can be designed by pharmaceutical businesses to meet customer expectations and environmental goals.

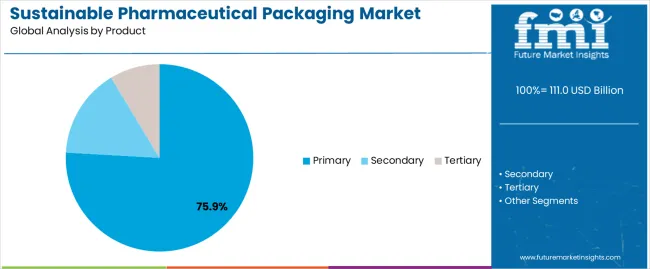
Primary Products to Witness Immense Growth in the Coming Years

Segment Primary (Product)
Value CAGR (2024 to 2034) 15.2%

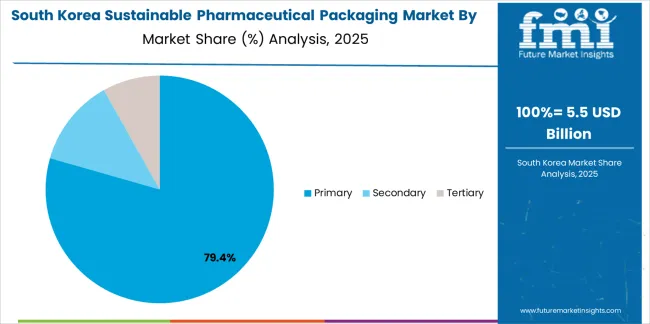
Based on product, the primary segment is expected to expand at a 15.2% CAGR through 2034.

  • The dosage forms used in the pharmaceutical business vary and include tablets, capsules, liquids, and injectables. The key materials used in packaging must be adaptable to hold different dosage forms while preserving the stability and integrity of the drugs within. The growing demand for primary packaging in the sustainable pharmaceutical packaging industry can be attributed to the necessity for adaptable and customized solutions that meet the unique needs of various pharmaceutical goods.
  • There is an increasing need for primary packaging that works with specialized medication delivery methods, including transdermal patches, inhalers, and prefilled syringes. Primary packaging must be easy to administer, preserve sterility, and allow for exact dosage. This tendency adds to the growing demand for improved primary packaging solutions.

Get the data you need at a Fraction of the cost

Personalize your report by choosing insights you need
and save 40%!

Country-wise Insights

Countries Value CAGR (2024 to 2034)
United States 15.7%
United Kingdom 16.3%
China 15.9%
Japan 17.0%
South Korea 18.2%

Regulatory Push for Sustainability Nurtures Market Growth in the United States

The demand for sustainable pharmaceutical packaging in the United States is projected to rise at a 15.7% CAGR through 2034.

  • Sustainability and environmental responsibility are becoming increasingly important in the regulatory landscape of the United States. Pharmaceutical firms are being pushed by federal and local legislation to embrace sustainable pharmaceutical packaging strategies. Businesses that proactively match their plans to changing regulatory requirements put themselves in a successful compliance and leadership position in the market.
  • Corporations' prioritization of sustainable practices has increased investor interest as Environmental, Social, and Governance (ESG) issues gain significance in investment choices. Pharmaceutical companies that use environmentally friendly pharmaceutical packaging adhere to ESG guidelines and draw funds from investors looking for possibilities to make socially conscious investments.

Circular Economy Initiatives Drive Market Expansion in the United Kingdom

The sales of sustainable pharmaceutical packaging in the United Kingdom are expected to surge at a 16.3% CAGR through 2034.

  • The sustainable pharmaceutical packaging industry in the United Kingdom is being driven by the government's significant attention to the circular economy, evidenced by projects like the Waste and Resources Strategy. Businesses that embrace the tenets of the circular economy, like closed-loop systems and recyclable materials, position themselves advantageously and take advantage of emerging legislative trends to propel sustainable pharmaceutical packaging market growth.
  • The United Kingdom's involvement in the National Plastics Pact and the Extended Producer Responsibility (EPR) initiative for packaging represents a paradigm change in the regulatory environment. By aligning themselves with these initiatives, pharmaceutical businesses can gain a competitive edge in the shifting market, minimize regulatory risks, and position themselves for compliance by investing in sustainable pharmaceutical packaging solutions.

Rising Adoption of Lean Manufacturing Principles Foster Growth in China

The sustainable pharmaceutical packaging market growth in China is estimated at a 15.9% CAGR through 2034.

  • The demand for sustainable pharmaceutical packaging is being driven by China's pharmaceutical industry's embrace of lean manufacturing methods. Businesses can improve productivity, cut costs, and minimize waste by using eco-friendly materials and streamlining their packaging procedures. This approach to lean manufacturing is in accordance with operational excellence initiatives, advancing market development and making pharmaceutical packaging sustainability a fundamental component of efficient production processes.
  • The swift digitization and e-commerce growth in China have created an unparalleled demand for sustainable pharmaceutical packaging. With the growing popularity of online sales channels, businesses are investing in packaging solutions designed to ensure safe and environmentally friendly delivery. The market is expanding due to this e-commerce-driven demand, which reflects an adaptable response to changing consumer purchasing patterns.

Integration with Advanced Robotics and Automation Propels Sales in Japan

The demand for sustainable pharmaceutical packaging in Japan is anticipated to rise at a 17.0% CAGR through 2034.

  • Japan's excellence in sophisticated robotics and automation technology is critical to the rise of the sustainable pharmaceutical packaging industry. Robotics integration improves productivity, lowers waste, and supports sustainable practices in packaging operations. By utilizing these technology developments, pharmaceutical businesses put themselves at the forefront of innovation, garnering attention from the market and spurring growth.
  • Japan's commitment to attaining the United Nations Sustainable Development Goals (SDGs) and its recent goal to become carbon neutral by 2050 are driving the widespread adoption of sustainable pharmaceutical packaging. Pharmaceutical businesses that connect their strategy with these national goals get a competitive edge since regulatory incentives and favorable laws encourage eco-friendly packaging solutions, promoting market development.

e-Commerce Boom and Last Mile Delivery Optimization Bolster Demand in South Korea

The sales of sustainable pharmaceutical packaging in South Korea are predicted to thrive at an 18.2% CAGR through 2034.

  • Sustainable pharmaceutical packaging solutions enjoy an additional boost from the growing e-commerce industry in South Korea and rising demands for last-mile delivery options. Businesses that invest in last-mile delivery and e-commerce-optimized packaging solutions support market growth by adapting to the shifting dynamics of consumer purchasing behavior.
  • South Korea's global prominence has increased due to the Korean Wave (Hallyu), which offers Korean sustainable pharmaceutical companies unique branding opportunities. By using sustainable packaging techniques, Korean companies can capitalize on the worldwide appeal of the Korean Wave to expand their brands internationally and improve their brand reputation. This is in line with global sustainability trends.

Competitive Landscape

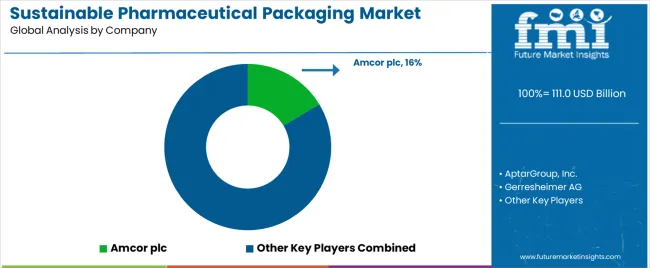
The competitive environment of the sustainable pharmaceutical packaging market is characterized by fierce rivalry and aggressive strategies as players compete for market dominance in a fast-changing sector. Established businesses, including international firms such as Amcor plc, AptarGroup, and Gerresheimer AG, lead the market due to their global reach and diverse product offerings.

These industry titans use their financial resources and R&D expertise to create novel sustainable packaging solutions, establishing themselves as pioneers in pursuing environmentally responsible packaging practices.

Recent Developments

  • In November 2023, United States-based Blue Lake Packaging introduced a new fiber-based, eco-friendly tape and dispenser substitute for traditional plastic tape. The 'Ecolife' line of tape sets and dispensers is a new line composed entirely of cotton fiber and wood.
  • In October 2023, Stoelzle Pharma, one of the world's leading manufacturers of high-quality primary packaging glass, announced its all-new PharmaCos Line. This packaging line is specifically developed for wellness and healthcare items.
  • In April 2022, Amcor, a global pioneer in creating and producing responsible packaging solutions, added new, more sustainable High Shield laminates to its pharmaceutical packaging line. The new low-carbon, recyclable packaging choices provide on two fronts: they meet the industry's high barrier and performance criteria while supporting pharmaceutical firms' recyclability objectives.

Key Players in the Sustainable Pharmaceutical Packaging Market

  • Amcor plc
  • AptarGroup, Inc.
  • Gerresheimer AG
  • Berry Global, Inc.
  • West Pharmaceutical Services, Inc.
  • Schott AG
  • Uflex Ltd.
  • Winpak Ltd.
  • Constantia Flexibles Group GmbH
  • Klöckner Pentaplast Group

Sustainable Pharmaceutical Packaging Market Segmentation

By Material:

  • Plastic and Polymer
  • Paper and Paper Board
  • Glass
  • Aluminium Foil
  • Others

By Product:

  • Primary
  • Secondary
  • Tertiary

By End Use:

  • Pharma Manufacturing
  • Contract Packaging
  • Retail Pharmacy
  • Institutional Pharmacy

By Region:

  • North America
  • Latin America
  • Western Europe
  • Eastern Europe
  • Asia Pacific (APAC)
  • Middle East & Africa (MEA)
  • Japan

Frequently Asked Questions

How Big is the Sustainable Pharmaceutical Packaging Market?

The sustainable pharmaceutical packaging market is valued at US$ 96 billion in 2024.

What is the Projected CAGR of the Sustainable Pharmaceutical Packaging Market?

The sustainable pharmaceutical packaging market size is estimated to increase at a 15.6% CAGR through 2034.

What is the Future Outlook for the Sustainable Pharmaceutical Packaging Market?

The sustainable pharmaceutical packaging market is anticipated to be worth US$ 410 billion by 2034.

Which is the Leading Material in the Sustainable Pharmaceutical Packaging Market?

Plastic and polymer witness high demand in the industry.

Which Country is Rising at a Higher CAGR in the Sustainable Pharmaceutical Packaging Market?

The sustainable pharmaceutical packaging market in South Korea is predicted to rise at an 18.2% CAGR through 2034.

Table of Content
1. Executive Summary

    1.1. Global Market Outlook

    1.2. Demand-side Trends

    1.3. Supply-side Trends

    1.4. Technology Roadmap Analysis

    1.5. Analysis and Recommendations

2. Market Overview

    2.1. Market Coverage / Taxonomy

    2.2. Market Definition / Scope / Limitations

3. Market Background

    3.1. Market Dynamics

        3.1.1. Drivers

        3.1.2. Restraints

        3.1.3. Opportunity

        3.1.4. Trends

    3.2. Scenario Forecast

        3.2.1. Demand in Optimistic Scenario

        3.2.2. Demand in Likely Scenario

        3.2.3. Demand in Conservative Scenario

    3.3. Opportunity Map Analysis

    3.4. Product Life Cycle Analysis

    3.5. Supply Chain Analysis

        3.5.1. Supply Side Participants and their Roles

            3.5.1.1. Producers

            3.5.1.2. Mid-Level Participants (Traders/ Agents/ Brokers)

            3.5.1.3. Wholesalers and Distributors

        3.5.2. Value Added and Value Created at Node in the Supply Chain

        3.5.3. List of Raw Material Suppliers

        3.5.4. List of Existing and Potential Buyer’s

    3.6. Investment Feasibility Matrix

    3.7. Value Chain Analysis

        3.7.1. Profit Margin Analysis

        3.7.2. Wholesalers and Distributors

        3.7.3. Retailers

    3.8. PESTLE and Porter’s Analysis

    3.9. Regulatory Landscape

        3.9.1. By Key Regions

        3.9.2. By Key Countries

    3.10. Regional Parent Market Outlook

    3.11. Production and Consumption Statistics

    3.12. Import and Export Statistics

4. Global Market Analysis 2019 to 2023 and Forecast, 2024 to 2034

    4.1. Historical Market Size Value (US$ Million) & Volume (Units) Analysis, 2019 to 2023

    4.2. Current and Future Market Size Value (US$ Million) & Volume (Units) Projections, 2024 to 2034

        4.2.1. Y-o-Y Growth Trend Analysis

        4.2.2. Absolute $ Opportunity Analysis

5. Global Market Analysis 2019 to 2023 and Forecast 2024 to 2034, By Material

    5.1. Introduction / Key Findings

    5.2. Historical Market Size Value (US$ Million) & Volume (Units) Analysis By Material, 2019 to 2023

    5.3. Current and Future Market Size Value (US$ Million) & Volume (Units) Analysis and Forecast By Material, 2024 to 2034

        5.3.1. Plastic and Polymer

        5.3.2. Paper and Paper Board

        5.3.3. Glass

        5.3.4. Aluminium Foil

        5.3.5. Others

    5.4. Y-o-Y Growth Trend Analysis By Material, 2019 to 2023

    5.5. Absolute $ Opportunity Analysis By Material, 2024 to 2034

6. Global Market Analysis 2019 to 2023 and Forecast 2024 to 2034, By Product

    6.1. Introduction / Key Findings

    6.2. Historical Market Size Value (US$ Million) & Volume (Units) Analysis By Product, 2019 to 2023

    6.3. Current and Future Market Size Value (US$ Million) & Volume (Units) Analysis and Forecast By Product, 2024 to 2034

        6.3.1. Primary

        6.3.2. Secondary

        6.3.3. Tertiary

    6.4. Y-o-Y Growth Trend Analysis By Product, 2019 to 2023

    6.5. Absolute $ Opportunity Analysis By Product, 2024 to 2034

7. Global Market Analysis 2019 to 2023 and Forecast 2024 to 2034, By End-use

    7.1. Introduction / Key Findings

    7.2. Historical Market Size Value (US$ Million) & Volume (Units) Analysis By End-use, 2019 to 2023

    7.3. Current and Future Market Size Value (US$ Million) & Volume (Units) Analysis and Forecast By End-use, 2024 to 2034

        7.3.1. Pharma Manufacturing

        7.3.2. Contract Packaging

        7.3.3. Retail Pharmacy

        7.3.4. Institutional Pharmacy

    7.4. Y-o-Y Growth Trend Analysis By End-use, 2019 to 2023

    7.5. Absolute $ Opportunity Analysis By End-use, 2024 to 2034

8. Global Market Analysis 2019 to 2023 and Forecast 2024 to 2034, By Region

    8.1. Introduction

    8.2. Historical Market Size Value (US$ Million) & Volume (Units) Analysis By Region, 2019 to 2023

    8.3. Current Market Size Value (US$ Million) & Volume (Units) Analysis and Forecast By Region, 2024 to 2034

        8.3.1. North America

        8.3.2. Latin America

        8.3.3. Western Europe

        8.3.4. Eastern Europe

        8.3.5. South Asia and Pacific

        8.3.6. East Asia

        8.3.7. Middle East and Africa

    8.4. Market Attractiveness Analysis By Region

9. North America Market Analysis 2019 to 2023 and Forecast 2024 to 2034, By Country

    9.1. Historical Market Size Value (US$ Million) & Volume (Units) Trend Analysis By Market Taxonomy, 2019 to 2023

    9.2. Market Size Value (US$ Million) & Volume (Units) Forecast By Market Taxonomy, 2024 to 2034

        9.2.1. By Country

            9.2.1.1. USA

            9.2.1.2. Canada

        9.2.2. By Material

        9.2.3. By Product

        9.2.4. By End-use

    9.3. Market Attractiveness Analysis

        9.3.1. By Country

        9.3.2. By Material

        9.3.3. By Product

        9.3.4. By End-use

    9.4. Key Takeaways

10. Latin America Market Analysis 2019 to 2023 and Forecast 2024 to 2034, By Country

    10.1. Historical Market Size Value (US$ Million) & Volume (Units) Trend Analysis By Market Taxonomy, 2019 to 2023

    10.2. Market Size Value (US$ Million) & Volume (Units) Forecast By Market Taxonomy, 2024 to 2034

        10.2.1. By Country

            10.2.1.1. Brazil

            10.2.1.2. Mexico

            10.2.1.3. Rest of Latin America

        10.2.2. By Material

        10.2.3. By Product

        10.2.4. By End-use

    10.3. Market Attractiveness Analysis

        10.3.1. By Country

        10.3.2. By Material

        10.3.3. By Product

        10.3.4. By End-use

    10.4. Key Takeaways

11. Western Europe Market Analysis 2019 to 2023 and Forecast 2024 to 2034, By Country

    11.1. Historical Market Size Value (US$ Million) & Volume (Units) Trend Analysis By Market Taxonomy, 2019 to 2023

    11.2. Market Size Value (US$ Million) & Volume (Units) Forecast By Market Taxonomy, 2024 to 2034

        11.2.1. By Country

            11.2.1.1. Germany

            11.2.1.2. UK

            11.2.1.3. France

            11.2.1.4. Spain

            11.2.1.5. Italy

            11.2.1.6. Rest of Western Europe

        11.2.2. By Material

        11.2.3. By Product

        11.2.4. By End-use

    11.3. Market Attractiveness Analysis

        11.3.1. By Country

        11.3.2. By Material

        11.3.3. By Product

        11.3.4. By End-use

    11.4. Key Takeaways

12. Eastern Europe Market Analysis 2019 to 2023 and Forecast 2024 to 2034, By Country

    12.1. Historical Market Size Value (US$ Million) & Volume (Units) Trend Analysis By Market Taxonomy, 2019 to 2023

    12.2. Market Size Value (US$ Million) & Volume (Units) Forecast By Market Taxonomy, 2024 to 2034

        12.2.1. By Country

            12.2.1.1. Poland

            12.2.1.2. Russia

            12.2.1.3. Czech Republic

            12.2.1.4. Romania

            12.2.1.5. Rest of Eastern Europe

        12.2.2. By Material

        12.2.3. By Product

        12.2.4. By End-use

    12.3. Market Attractiveness Analysis

        12.3.1. By Country

        12.3.2. By Material

        12.3.3. By Product

        12.3.4. By End-use

    12.4. Key Takeaways

13. South Asia and Pacific Market Analysis 2019 to 2023 and Forecast 2024 to 2034, By Country

    13.1. Historical Market Size Value (US$ Million) & Volume (Units) Trend Analysis By Market Taxonomy, 2019 to 2023

    13.2. Market Size Value (US$ Million) & Volume (Units) Forecast By Market Taxonomy, 2024 to 2034

        13.2.1. By Country

            13.2.1.1. India

            13.2.1.2. Bangladesh

            13.2.1.3. Australia

            13.2.1.4. New Zealand

            13.2.1.5. Rest of South Asia and Pacific

        13.2.2. By Material

        13.2.3. By Product

        13.2.4. By End-use

    13.3. Market Attractiveness Analysis

        13.3.1. By Country

        13.3.2. By Material

        13.3.3. By Product

        13.3.4. By End-use

    13.4. Key Takeaways

14. East Asia Market Analysis 2019 to 2023 and Forecast 2024 to 2034, By Country

    14.1. Historical Market Size Value (US$ Million) & Volume (Units) Trend Analysis By Market Taxonomy, 2019 to 2023

    14.2. Market Size Value (US$ Million) & Volume (Units) Forecast By Market Taxonomy, 2024 to 2034

        14.2.1. By Country

            14.2.1.1. China

            14.2.1.2. Japan

            14.2.1.3. South Korea

        14.2.2. By Material

        14.2.3. By Product

        14.2.4. By End-use

    14.3. Market Attractiveness Analysis

        14.3.1. By Country

        14.3.2. By Material

        14.3.3. By Product

        14.3.4. By End-use

    14.4. Key Takeaways

15. Middle East and Africa Market Analysis 2019 to 2023 and Forecast 2024 to 2034, By Country

    15.1. Historical Market Size Value (US$ Million) & Volume (Units) Trend Analysis By Market Taxonomy, 2019 to 2023

    15.2. Market Size Value (US$ Million) & Volume (Units) Forecast By Market Taxonomy, 2024 to 2034

        15.2.1. By Country

            15.2.1.1. GCC Countries

            15.2.1.2. South Africa

            15.2.1.3. Israel

            15.2.1.4. Rest of MEA

        15.2.2. By Material

        15.2.3. By Product

        15.2.4. By End-use

    15.3. Market Attractiveness Analysis

        15.3.1. By Country

        15.3.2. By Material

        15.3.3. By Product

        15.3.4. By End-use

    15.4. Key Takeaways

16. Key Countries Market Analysis

    16.1. USA

        16.1.1. Pricing Analysis

        16.1.2. Market Share Analysis, 2023

            16.1.2.1. By Material

            16.1.2.2. By Product

            16.1.2.3. By End-use

    16.2. Canada

        16.2.1. Pricing Analysis

        16.2.2. Market Share Analysis, 2023

            16.2.2.1. By Material

            16.2.2.2. By Product

            16.2.2.3. By End-use

    16.3. Brazil

        16.3.1. Pricing Analysis

        16.3.2. Market Share Analysis, 2023

            16.3.2.1. By Material

            16.3.2.2. By Product

            16.3.2.3. By End-use

    16.4. Mexico

        16.4.1. Pricing Analysis

        16.4.2. Market Share Analysis, 2023

            16.4.2.1. By Material

            16.4.2.2. By Product

            16.4.2.3. By End-use

    16.5. Germany

        16.5.1. Pricing Analysis

        16.5.2. Market Share Analysis, 2023

            16.5.2.1. By Material

            16.5.2.2. By Product

            16.5.2.3. By End-use

    16.6. UK

        16.6.1. Pricing Analysis

        16.6.2. Market Share Analysis, 2023

            16.6.2.1. By Material

            16.6.2.2. By Product

            16.6.2.3. By End-use

    16.7. France

        16.7.1. Pricing Analysis

        16.7.2. Market Share Analysis, 2023

            16.7.2.1. By Material

            16.7.2.2. By Product

            16.7.2.3. By End-use

    16.8. Spain

        16.8.1. Pricing Analysis

        16.8.2. Market Share Analysis, 2023

            16.8.2.1. By Material

            16.8.2.2. By Product

            16.8.2.3. By End-use

    16.9. Italy

        16.9.1. Pricing Analysis

        16.9.2. Market Share Analysis, 2023

            16.9.2.1. By Material

            16.9.2.2. By Product

            16.9.2.3. By End-use

    16.10. Poland

        16.10.1. Pricing Analysis

        16.10.2. Market Share Analysis, 2023

            16.10.2.1. By Material

            16.10.2.2. By Product

            16.10.2.3. By End-use

    16.11. Russia

        16.11.1. Pricing Analysis

        16.11.2. Market Share Analysis, 2023

            16.11.2.1. By Material

            16.11.2.2. By Product

            16.11.2.3. By End-use

    16.12. Czech Republic

        16.12.1. Pricing Analysis

        16.12.2. Market Share Analysis, 2023

            16.12.2.1. By Material

            16.12.2.2. By Product

            16.12.2.3. By End-use

    16.13. Romania

        16.13.1. Pricing Analysis

        16.13.2. Market Share Analysis, 2023

            16.13.2.1. By Material

            16.13.2.2. By Product

            16.13.2.3. By End-use

    16.14. India

        16.14.1. Pricing Analysis

        16.14.2. Market Share Analysis, 2023

            16.14.2.1. By Material

            16.14.2.2. By Product

            16.14.2.3. By End-use

    16.15. Bangladesh

        16.15.1. Pricing Analysis

        16.15.2. Market Share Analysis, 2023

            16.15.2.1. By Material

            16.15.2.2. By Product

            16.15.2.3. By End-use

    16.16. Australia

        16.16.1. Pricing Analysis

        16.16.2. Market Share Analysis, 2023

            16.16.2.1. By Material

            16.16.2.2. By Product

            16.16.2.3. By End-use

    16.17. New Zealand

        16.17.1. Pricing Analysis

        16.17.2. Market Share Analysis, 2023

            16.17.2.1. By Material

            16.17.2.2. By Product

            16.17.2.3. By End-use

    16.18. China

        16.18.1. Pricing Analysis

        16.18.2. Market Share Analysis, 2023

            16.18.2.1. By Material

            16.18.2.2. By Product

            16.18.2.3. By End-use

    16.19. Japan

        16.19.1. Pricing Analysis

        16.19.2. Market Share Analysis, 2023

            16.19.2.1. By Material

            16.19.2.2. By Product

            16.19.2.3. By End-use

    16.20. South Korea

        16.20.1. Pricing Analysis

        16.20.2. Market Share Analysis, 2023

            16.20.2.1. By Material

            16.20.2.2. By Product

            16.20.2.3. By End-use

    16.21. GCC Countries

        16.21.1. Pricing Analysis

        16.21.2. Market Share Analysis, 2023

            16.21.2.1. By Material

            16.21.2.2. By Product

            16.21.2.3. By End-use

    16.22. South Africa

        16.22.1. Pricing Analysis

        16.22.2. Market Share Analysis, 2023

            16.22.2.1. By Material

            16.22.2.2. By Product

            16.22.2.3. By End-use

    16.23. Israel

        16.23.1. Pricing Analysis

        16.23.2. Market Share Analysis, 2023

            16.23.2.1. By Material

            16.23.2.2. By Product

            16.23.2.3. By End-use

17. Market Structure Analysis

    17.1. Competition Dashboard

    17.2. Competition Benchmarking

    17.3. Market Share Analysis of Top Players

        17.3.1. By Regional

        17.3.2. By Material

        17.3.3. By Product

        17.3.4. By End-use

18. Competition Analysis

    18.1. Competition Deep Dive

        18.1.1. Amcor Plc

            18.1.1.1. Overview

            18.1.1.2. Product Portfolio

            18.1.1.3. Profitability by Market Segments

            18.1.1.4. Sales Footprint

            18.1.1.5. Strategy Overview

                18.1.1.5.1. Marketing Strategy

                18.1.1.5.2. Product Strategy

                18.1.1.5.3. Channel Strategy

        18.1.2. Aptargroup, Inc.

            18.1.2.1. Overview

            18.1.2.2. Product Portfolio

            18.1.2.3. Profitability by Market Segments

            18.1.2.4. Sales Footprint

            18.1.2.5. Strategy Overview

                18.1.2.5.1. Marketing Strategy

                18.1.2.5.2. Product Strategy

                18.1.2.5.3. Channel Strategy

        18.1.3. Becton

            18.1.3.1. Overview

            18.1.3.2. Product Portfolio

            18.1.3.3. Profitability by Market Segments

            18.1.3.4. Sales Footprint

            18.1.3.5. Strategy Overview

                18.1.3.5.1. Marketing Strategy

                18.1.3.5.2. Product Strategy

                18.1.3.5.3. Channel Strategy

        18.1.4. Dickinson and Company

            18.1.4.1. Overview

            18.1.4.2. Product Portfolio

            18.1.4.3. Profitability by Market Segments

            18.1.4.4. Sales Footprint

            18.1.4.5. Strategy Overview

                18.1.4.5.1. Marketing Strategy

                18.1.4.5.2. Product Strategy

                18.1.4.5.3. Channel Strategy

        18.1.5. Berry Global Inc

            18.1.5.1. Overview

            18.1.5.2. Product Portfolio

            18.1.5.3. Profitability by Market Segments

            18.1.5.4. Sales Footprint

            18.1.5.5. Strategy Overview

                18.1.5.5.1. Marketing Strategy

                18.1.5.5.2. Product Strategy

                18.1.5.5.3. Channel Strategy

        18.1.6. Catalent, Inc

            18.1.6.1. Overview

            18.1.6.2. Product Portfolio

            18.1.6.3. Profitability by Market Segments

            18.1.6.4. Sales Footprint

            18.1.6.5. Strategy Overview

                18.1.6.5.1. Marketing Strategy

                18.1.6.5.2. Product Strategy

                18.1.6.5.3. Channel Strategy

        18.1.7. CCL Industries, Inc

            18.1.7.1. Overview

            18.1.7.2. Product Portfolio

            18.1.7.3. Profitability by Market Segments

            18.1.7.4. Sales Footprint

            18.1.7.5. Strategy Overview

                18.1.7.5.1. Marketing Strategy

                18.1.7.5.2. Product Strategy

                18.1.7.5.3. Channel Strategy

        18.1.8. Comar, LLC

            18.1.8.1. Overview

            18.1.8.2. Product Portfolio

            18.1.8.3. Profitability by Market Segments

            18.1.8.4. Sales Footprint

            18.1.8.5. Strategy Overview

                18.1.8.5.1. Marketing Strategy

                18.1.8.5.2. Product Strategy

                18.1.8.5.3. Channel Strategy

        18.1.9. Drug Plastics Group

            18.1.9.1. Overview

            18.1.9.2. Product Portfolio

            18.1.9.3. Profitability by Market Segments

            18.1.9.4. Sales Footprint

            18.1.9.5. Strategy Overview

                18.1.9.5.1. Marketing Strategy

                18.1.9.5.2. Product Strategy

                18.1.9.5.3. Channel Strategy

        18.1.10. Gerresheimer AG

            18.1.10.1. Overview

            18.1.10.2. Product Portfolio

            18.1.10.3. Profitability by Market Segments

            18.1.10.4. Sales Footprint

            18.1.10.5. Strategy Overview

                18.1.10.5.1. Marketing Strategy

                18.1.10.5.2. Product Strategy

                18.1.10.5.3. Channel Strategy

19. Assumptions & Acronyms Used

20. Research Methodology
Recommendations

Packaging

Pharmaceutical Packaging Market

May 2021

REP-GB-6150

April 2024

304 pages

Packaging

Biopharmaceuticals Packaging Market

September 2024

REP-GB-13206

Upcoming

Explore Packaging Insights

View Reports
Future Market Insights

Sustainable Pharmaceutical Packaging Market