Reports

- Global Locations -

Headquarters

Future Market Insights, Inc.

Christiana Corporate, 200
Continental Drive, Suite 401,
Newark, Delaware - 19713,
United States

T: +1-845-579-5705

Americas

Future Market Insights, Inc.

616 Corporate Way, Suite 2-9018,
Valley Cottage, NY 10989, United States

T: +1-347-918-3531

MEA

Future Market Insights

1602-6 Jumeirah Bay X2 Tower, Plot No: JLT-PH2-X2A,
Jumeirah Lakes Towers, Dubai,
United Arab Emirates

Europe

Future Market Insights

3rd Floor, 207 Regent Street,
W1B 3HH London
United Kingdom

T: + 44 (0) 20 8123 9659
D: +44 (0) 20 3287 4268

Asia Pacific

Future Market Insights

IndiaLand Global Tech Park, Unit UG-1, Behind Grand HighStreet, Phase 1, Hinjawadi, MH, Pune – 411057, India

Sustainable Plastic Packaging Market Outlook for 2024 to 2034

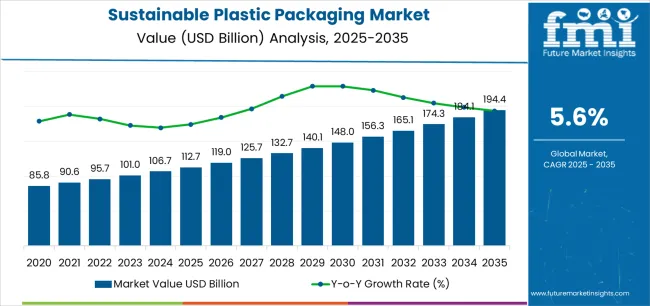
The sustainable plastic packaging market is evaluated to be valued at US$ 106.4 billion in 2024. During the period from 2024 to 2034, the market is expected to progress at a moderate pace, registering a CAGR of 5.9%. By 2034, the sustainable plastic packaging industry is forecasted to surpass a valuation of US$ 189.0 billion.

Sustainable Plastic Packaging Market Overview

  • Growing environmental considerations in the packaging sector are motivating the increased use of sustainable plastic packaging.
  • Regulatory authorities are keeping a close eye on the materials used in packaging, thus driving suppliers toward the use of sustainable plastic packaging.
  • While other sustainable alternatives to plastic abound in the packaging sector, the material has earned the trust of packaging companies. Thus, they are looking at sustainable options within the plastic itself.
  • As end-user industries such as food & beverage and cosmetics become more eco-conscious, the demand for sustainable plastic packaging in these industries is surging.
  • Eco-friendly consumers are becoming more knowledgeable about the packaging practices of goods and are increasingly using sustainable plastic packaging.
Attributes Details
Estimated Sustainable Plastic Packaging Market Value in 2024 US$ 106.4 billion
Forecasted Market Value by 2034 US$ 189.0 billion
Projected Value-based CAGR of the Market from 2024 to 2034 5.9%

Don't pay for what you don't need

Customize your report by selecting specific countries or regions and save 30%!

Sustainable Plastic Packaging Market Trends

  • The increasing popularity of plant-based substances in the manufacturing industry is leading to a rise in the demand for plant-based sustainable plastic.
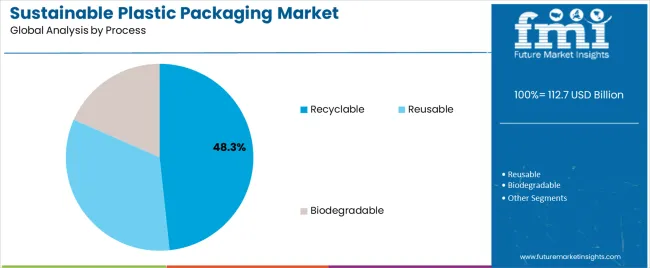
  • Consumer interest in recyclable materials is driving more packaging units to adopt recyclable plastic.
  • Governments are imposing stricter restrictions on the use of non-biodegradable materials in packaging, leading to an increase in the use of biodegradable plastic for packaging purposes.
  • The use of recyclable and biodegradable plastic is also gaining momentum as both manufacturers and consumers are making more efforts to control waste. Thus, sustainable plastic packaging is contributing to the waste management process.
  • Petroleum-based plastic packaging is attracting consumers due to its aesthetic value, providing more incentive for the use of sustainable plastic in packaging.

Sustainable Plastic Packaging Market Restraints

There is still a lack of awareness about the use of eco-friendly plastic. End-users struggle to find the right sources for obtaining the material, and doubts have been raised about the true sustainability of green plastic.

Additionally, a significant number of consumers are unaware of how to recycle recyclable plastic, which is hindering the growth of the market. Furthermore, amid doubts about the effectiveness of green plastic, a considerable number of vendors are abandoning plastic altogether in favor of other sustainable options such as paper and metal.

Ismail Sutaria
Ismail Sutaria

Principal Consultant

Talk to Analyst

Find your sweet spots for generating winning opportunities in this market.

Comparative View of Adjacent Markets

Apart from the sustainable plastic packaging market, an in-depth analysis has been done on two other related markets. The markets are the starch-based bioplastics packaging market and the compostable plastic packaging material market.

The high demand for biodegradable options in the packaging sector is driving the growth of the starch-based bioplastics packaging market. The inexpensive nature of starch is also helping it to make more inroads into the packaging sector.

Technological advancements in composting are aiding the adoption of compostable plastic in packaging. The toughness of the material is also acting as a positive factor in its penetration into the packaging industry.

Sustainable Plastic Packaging Market:

Attributes Sustainable Plastic Packaging Market
Value-based CAGR (2024 to 2034) 5.9%
Market Trends Increasing use of plant-based plastic, along with biodegradable plastic
Restraint The presence of alternative sustainable packaging solutions is evident
Growth Factors Rising regulatory measures are discouraging the use of traditional plastic

Compostable Plastic Packaging Material Market:

Attributes Compostable Plastic Packaging Material Market
Value-based CAGR (2024 to 2034) 5.2%
Market Trend The use of additives is making compostable plastic sturdier
Restraint The slow degrading rate of compostable plastic is making end users apprehensive about its use
Growth Factor Increasing use of compostable plastic in various industries, such as food & beverage and beauty products, for packaging

Starch-based Bioplastics Packaging Market:

Attributes Starch-based Bioplastics Packaging Market
Value-based CAGR (2024 to 2034) 8.7%
Market Trend Adoption of bio-based and compostable certifications to enhance the credibility and marketability
Restraint High cost of starch-based bioplastic as compared to other traditional plastic
Growth Factor Various starch sources like potatoes, maize, and rice enable manufacturers to scale up production of starch-based bioplastics

Category-wise Outlook

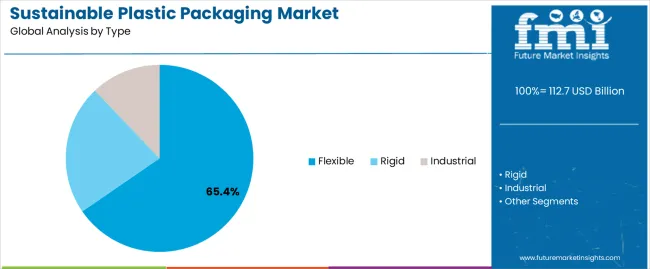
Rigid packaging is the preferred choice of industrialists for traditional plastic packaging, and sustainable plastic packaging is following suit. Consumer awareness about sustainability is positioning sustainable plastic as the primary packaging material for products.

Rigid Sustainable Plastic Packaging Soars as Resilience Meets Responsibility

Attributes Details
Top Type Rigid
Forecasted CAGR (2024 to 2034) 5.6%

Rigid sustainable plastic packaging is expected to advance at a CAGR of 5.6% over the forecast period. Some of the factors influencing the progress of rigid sustainable packaging are:

  • While flexible plastic packaging is experiencing an increase in demand, the toughness desired by suppliers ensures the dominance of rigid plastic packaging. In sustainable plastic packaging as well, the rigid formulation of the plastic is preferred.
  • The use of sustainable plastic in the food & beverage industry is bolstering the demand for rigid packaging. As the food industry requires packaging material that ensures the food inside remains unspoiled, rigid sustainable plastic is being increasingly adopted into the sector.

Primary Sustainable Plastic Packaging Booms on Consumer Preference

Attributes Details
Top Packaging Primary Packaging
Forecasted CAGR (2024 to 2034) 5.5%

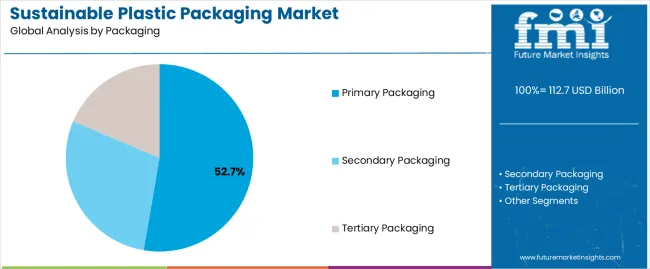
Primary packaging is expected to progress at a CAGR of 5.5% through the forecast period. Some of the reasons for the advancement of primary sustainable plastic packaging are:

  • Consumers are one of the key drivers for the inclination towards sustainability. By delivering products wrapped in sustainable plastic, suppliers ensure consumers have direct proof of the eco-friendly manufacturing process.
  • As primary packaging becomes more compact, sustainable plastic packaging is also becoming more user-friendly.

Get the data you need at a Fraction of the cost

Personalize your report by choosing insights you need
and save 40%!

Country-Wise Analysis

The booming industrial sector in the Asia Pacific is helping sustainable plastic packaging make its mark in the region. Increased government measures regarding environmental harm are also supporting the product's cause in the region.

Increased consumer awareness is leading to the market's expansion in North America and Europe. Investment in research for developing and implementing sustainable plastic in packaging further is also benefiting the market's cause in these regions.

Countries Forecasted CAGR (2024 to 2034)
United States 6.1%
United Kingdom 6.2%
China 6.6%
Japan 6.9%
South Korea 7.4%

Government Encouragement for Plastic Recycling is Helping the Market’s Progress in South Korea

The CAGR of the sustainable plastic packaging market in South Korea for the forecast period is anticipated to be 7.4%. Some of the factors influencing the healthy growth are:

  • The government in South Korea has high aspirations for plastic recycling. By 2030, the goal in South Korea is to achieve a plastic recycling rate as high as 70%. Consequently, recyclable plastic packaging is in high demand in the country.
  • Heavy restrictions on the use of conventional plastic for manufacturing disposable cups are being imposed in South Korea. As a result, manufacturers are turning to sustainable plastic.

Water Pollution Levels in Japan Drive the Adoption of Sustainable Plastic Packaging

The sustainable plastic packaging market is expected to register a CAGR of 6.9% in Japan over the forecast period. Some of the factors leading to the growth of the market in Japan are:

  • There is growing concern in Japan over microplastics polluting the waters surrounding the nation, with the rate claimed to be 27 times higher than the world average. Thus, as a means to preserve the seas, sustainable plastic packaging is gaining prominence in the country.
  • Convenience stores in Japan are gradually becoming more environmentally friendly, and vendors are assisting them by supplying products with sustainable plastic packaging to stock on their shelves.

Food & Beverage Industry is Leading the Charge for Sustainable Plastic Packaging in China

The sustainable plastic packaging market is expected to record a CAGR of 6.6% in China. Some of the factors responsible for the growth of the market are:

  • The food & beverage industry is embracing sustainable plastic packaging in China. For example, in 2023, Mars China introduced a Snickers bar with packaging made from mono-polypropylene (PP), a recyclable plastic.
  • Various stakeholders like the Green Recycled Plastic Supply Chain Joint Working Group (GRPG), PepsiCo, Dow, and others have collaborated on the Flexible Plastics Reborn project in China, encouraging more use of sustainable plastic packaging.

High Investment is Driving the Speed of Sustainable Plastic Packaging Adoption in the United Kingdom

The sustainable plastic packaging market is expected to progress at a CAGR of 6.2% in the United Kingdom. Some factors influencing this progress are:

  • Both public and private funds are being invested to increase sustainable packaging in the United Kingdom. For example, in November 2023, Nestle announced an investment of around US$ 8.80 million in Impact Recycling to build a new plant in Durham.
  • Innovation in recyclable plastic is considered crucial in the United Kingdom, and thus, sustainable plastic packaging is constantly evolving in the country.

Sustainable Packaging is Extremely Desired in Personal Care Products in the United States

The sustainable plastic packaging market is expected to register a CAGR of 6.1% in the United States. Some factors influencing the growth of the market in the country are:
  • Personal care products in the United States are increasingly being wrapped in sustainable plastic packaging as consumers become more eco-conscious, especially due to the influence of social media.
  • Compostable plastic packaging has emerged as a significant trend in the country.

Competitive Landscape in the Sustainable Plastic Packaging Market

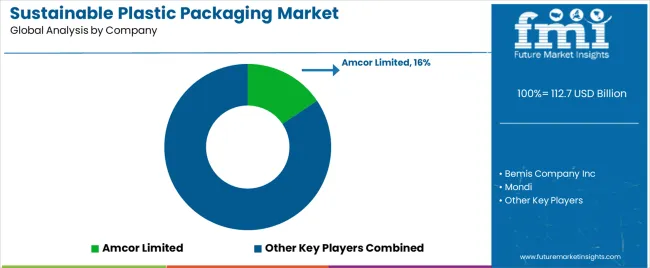
The market is highly fragmented, with opportunities available for all sorts of competitors. Startups and small-scale players are utilizing differentiation strategies to stand out from the competition.

Innovation is a prime area of focus for industry players. To accelerate the research and production of new types of sustainable plastic, investment is being sought from companies adjacent to the packaging industry, such as food & beverage and consumer products.

Recent Developments in the Sustainable Plastic Packaging Market

  • In February 2024, the United Kingdom-based supermarket chain Asda announced that its Just Essentials beef mince range would be packaged in recyclable plastic from then on.
  • In February 2024, SEE launched a compostable tray made from bio-based materials.
  • In January 2024, XAMPLA secured US$ 7 million from various investors to increase the production of its Morro packaging products, which are biodegradable and compostable.
  • In December 2023, the Thai outfit I.P. One partnered with ENVICCO for the recycling of household waste into the VIXOL POWER black bottle.

Key Companies in the Sustainable Plastic Packaging Market

  • Bemis Company Inc.
  • Amcor Limited
  • Mondi
  • WestRock Company
  • Tetra Laval International SA.

Key Segments

By Type:

  • Rigid
  • Flexible
  • Industrial

By Packaging:

  • Primary packaging
  • Secondary packaging
  • Tertiary Packaging

By Process:

  • Recyclable
  • Reusable
  • Biodegradable

By End Use:

  • Food & beverage
  • Personal care
  • Healthcare
  • Others

By Region:

  • North America
  • Latin America
  • Europe
  • South Asia
  • East Asia
  • Oceania
  • Middle East and Africa (MEA)

Frequently Asked Questions

How Big is the Sustainable Plastic Packaging Market?

The size of the sustainable plastic packaging market is estimated to be US$ 106.4 billion in 2024.

At What Rate is the Sustainable Plastic Packaging Market Expected to Grow?

The market is expected to increase at a CAGR of 5.9% over the forecast period.

What is the Scope of Sustainable Plastic Packaging in the United States?

The market is expected to register a CAGR of 6.1% in the United States from 2024 to 2034.

What is the Demand Forecast for Sustainable Plastic Packaging?

The sustainable plastic packaging market is forecasted to surpass US$ 189.0 billion by 2034.

What are the Trends in the Sustainable Plastic Packaging Industry?

Increased use of plant-based plastic and preference for biodegradable plastic are some of the key trends in the sustainable plastic packaging industry.

Table of Content

1. Executive Summary

    1.1. Global Market Outlook

    1.2. Demand-side Trends

    1.3. Supply-side Trends

    1.4. Technology Roadmap Analysis

    1.5. Analysis and Recommendations

2. Market Overview

    2.1. Market Coverage / Taxonomy

    2.2. Market Definition / Scope / Limitations

3. Market Background

    3.1. Market Dynamics

        3.1.1. Drivers

        3.1.2. Restraints

        3.1.3. Opportunity

        3.1.4. Trends

    3.2. Scenario Forecast

        3.2.1. Demand in Optimistic Scenario

        3.2.2. Demand in Likely Scenario

        3.2.3. Demand in Conservative Scenario

    3.3. Opportunity Map Analysis

    3.4. Product Life Cycle Analysis

    3.5. Supply Chain Analysis

        3.5.1. Supply Side Participants and their Roles

            3.5.1.1. Producers

            3.5.1.2. Mid-Level Participants (Traders/ Agents/ Brokers)

            3.5.1.3. Wholesalers and Distributors

        3.5.2. Value Added and Value Created at Node in the Supply Chain

        3.5.3. List of Raw Material Suppliers

        3.5.4. List of Existing and Potential Buyer’s

    3.6. Investment Feasibility Matrix

    3.7. Value Chain Analysis

        3.7.1. Profit Margin Analysis

        3.7.2. Wholesalers and Distributors

        3.7.3. Retailers

    3.8. PESTLE and Porter’s Analysis

    3.9. Regulatory Landscape

        3.9.1. By Key Regions

        3.9.2. By Key Countries

    3.10. Regional Parent Market Outlook

    3.11. Production and Consumption Statistics

    3.12. Import and Export Statistics

4. Global Market Analysis 2019 to 2023 and Forecast, 2024 to 2034

    4.1. Historical Market Size Value (US$ Million) & Volume (Units) Analysis, 2019 to 2023

    4.2. Current and Future Market Size Value (US$ Million) & Volume (Units) Projections, 2024 to 2034

        4.2.1. Y-o-Y Growth Trend Analysis

        4.2.2. Absolute $ Opportunity Analysis

5. Global Market Analysis 2019 to 2023 and Forecast 2024 to 2034, By Type

    5.1. Introduction / Key Findings

    5.2. Historical Market Size Value (US$ Million) & Volume (Units) Analysis By Type, 2019 to 2023

    5.3. Current and Future Market Size Value (US$ Million) & Volume (Units) Analysis and Forecast By Type, 2024 to 2034

        5.3.1. Rigid

        5.3.2. Flexible

        5.3.3. Industrial

    5.4. Y-o-Y Growth Trend Analysis By Type, 2019 to 2023

    5.5. Absolute $ Opportunity Analysis By Type, 2024 to 2034

6. Global Market Analysis 2019 to 2023 and Forecast 2024 to 2034, By Packaging

    6.1. Introduction / Key Findings

    6.2. Historical Market Size Value (US$ Million) & Volume (Units) Analysis By Packaging, 2019 to 2023

    6.3. Current and Future Market Size Value (US$ Million) & Volume (Units) Analysis and Forecast By Packaging, 2024 to 2034

        6.3.1. Primary packaging

        6.3.2. Secondary packaging

        6.3.3. Tertiary Packaging

    6.4. Y-o-Y Growth Trend Analysis By Packaging, 2019 to 2023

    6.5. Absolute $ Opportunity Analysis By Packaging, 2024 to 2034

7. Global Market Analysis 2019 to 2023 and Forecast 2024 to 2034, By Process

    7.1. Introduction / Key Findings

    7.2. Historical Market Size Value (US$ Million) & Volume (Units) Analysis By Process, 2019 to 2023

    7.3. Current and Future Market Size Value (US$ Million) & Volume (Units) Analysis and Forecast By Process, 2024 to 2034

        7.3.1. Recyclable

        7.3.2. Reusable

        7.3.3. Biodegradable

    7.4. Y-o-Y Growth Trend Analysis By Process, 2019 to 2023

    7.5. Absolute $ Opportunity Analysis By Process, 2024 to 2034

8. Global Market Analysis 2019 to 2023 and Forecast 2024 to 2034, By End-Use

    8.1. Introduction / Key Findings

    8.2. Historical Market Size Value (US$ Million) & Volume (Units) Analysis By End-Use, 2019 to 2023

    8.3. Current and Future Market Size Value (US$ Million) & Volume (Units) Analysis and Forecast By End-Use, 2024 to 2034

        8.3.1. Food & beverage

        8.3.2. Personal care

        8.3.3. Healthcare

        8.3.4. Others

    8.4. Y-o-Y Growth Trend Analysis By End-Use, 2019 to 2023

    8.5. Absolute $ Opportunity Analysis By End-Use, 2024 to 2034

9. Global Market Analysis 2019 to 2023 and Forecast 2024 to 2034, By Region

    9.1. Introduction

    9.2. Historical Market Size Value (US$ Million) & Volume (Units) Analysis By Region, 2019 to 2023

    9.3. Current Market Size Value (US$ Million) & Volume (Units) Analysis and Forecast By Region, 2024 to 2034

        9.3.1. North America

        9.3.2. Latin America

        9.3.3. Western Europe

        9.3.4. Eastern Europe

        9.3.5. South Asia and Pacific

        9.3.6. East Asia

        9.3.7. Middle East and Africa

    9.4. Market Attractiveness Analysis By Region

10. North America Market Analysis 2019 to 2023 and Forecast 2024 to 2034, By Country

    10.1. Historical Market Size Value (US$ Million) & Volume (Units) Trend Analysis By Market Taxonomy, 2019 to 2023

    10.2. Market Size Value (US$ Million) & Volume (Units) Forecast By Market Taxonomy, 2024 to 2034

        10.2.1. By Country

            10.2.1.1. USA

            10.2.1.2. Canada

        10.2.2. By Type

        10.2.3. By Packaging

        10.2.4. By Process

        10.2.5. By End-Use

    10.3. Market Attractiveness Analysis

        10.3.1. By Country

        10.3.2. By Type

        10.3.3. By Packaging

        10.3.4. By Process

        10.3.5. By End-Use

    10.4. Key Takeaways

11. Latin America Market Analysis 2019 to 2023 and Forecast 2024 to 2034, By Country

    11.1. Historical Market Size Value (US$ Million) & Volume (Units) Trend Analysis By Market Taxonomy, 2019 to 2023

    11.2. Market Size Value (US$ Million) & Volume (Units) Forecast By Market Taxonomy, 2024 to 2034

        11.2.1. By Country

            11.2.1.1. Brazil

            11.2.1.2. Mexico

            11.2.1.3. Rest of Latin America

        11.2.2. By Type

        11.2.3. By Packaging

        11.2.4. By Process

        11.2.5. By End-Use

    11.3. Market Attractiveness Analysis

        11.3.1. By Country

        11.3.2. By Type

        11.3.3. By Packaging

        11.3.4. By Process

        11.3.5. By End-Use

    11.4. Key Takeaways

12. Western Europe Market Analysis 2019 to 2023 and Forecast 2024 to 2034, By Country

    12.1. Historical Market Size Value (US$ Million) & Volume (Units) Trend Analysis By Market Taxonomy, 2019 to 2023

    12.2. Market Size Value (US$ Million) & Volume (Units) Forecast By Market Taxonomy, 2024 to 2034

        12.2.1. By Country

            12.2.1.1. Germany

            12.2.1.2. UK

            12.2.1.3. France

            12.2.1.4. Spain

            12.2.1.5. Italy

            12.2.1.6. Rest of Western Europe

        12.2.2. By Type

        12.2.3. By Packaging

        12.2.4. By Process

        12.2.5. By End-Use

    12.3. Market Attractiveness Analysis

        12.3.1. By Country

        12.3.2. By Type

        12.3.3. By Packaging

        12.3.4. By Process

        12.3.5. By End-Use

    12.4. Key Takeaways

13. Eastern Europe Market Analysis 2019 to 2023 and Forecast 2024 to 2034, By Country

    13.1. Historical Market Size Value (US$ Million) & Volume (Units) Trend Analysis By Market Taxonomy, 2019 to 2023

    13.2. Market Size Value (US$ Million) & Volume (Units) Forecast By Market Taxonomy, 2024 to 2034

        13.2.1. By Country

            13.2.1.1. Poland

            13.2.1.2. Russia

            13.2.1.3. Czech Republic

            13.2.1.4. Romania

            13.2.1.5. Rest of Eastern Europe

        13.2.2. By Type

        13.2.3. By Packaging

        13.2.4. By Process

        13.2.5. By End-Use

    13.3. Market Attractiveness Analysis

        13.3.1. By Country

        13.3.2. By Type

        13.3.3. By Packaging

        13.3.4. By Process

        13.3.5. By End-Use

    13.4. Key Takeaways

14. South Asia and Pacific Market Analysis 2019 to 2023 and Forecast 2024 to 2034, By Country

    14.1. Historical Market Size Value (US$ Million) & Volume (Units) Trend Analysis By Market Taxonomy, 2019 to 2023

    14.2. Market Size Value (US$ Million) & Volume (Units) Forecast By Market Taxonomy, 2024 to 2034

        14.2.1. By Country

            14.2.1.1. India

            14.2.1.2. Bangladesh

            14.2.1.3. Australia

            14.2.1.4. New Zealand

            14.2.1.5. Rest of South Asia and Pacific

        14.2.2. By Type

        14.2.3. By Packaging

        14.2.4. By Process

        14.2.5. By End-Use

    14.3. Market Attractiveness Analysis

        14.3.1. By Country

        14.3.2. By Type

        14.3.3. By Packaging

        14.3.4. By Process

        14.3.5. By End-Use

    14.4. Key Takeaways

15. East Asia Market Analysis 2019 to 2023 and Forecast 2024 to 2034, By Country

    15.1. Historical Market Size Value (US$ Million) & Volume (Units) Trend Analysis By Market Taxonomy, 2019 to 2023

    15.2. Market Size Value (US$ Million) & Volume (Units) Forecast By Market Taxonomy, 2024 to 2034

        15.2.1. By Country

            15.2.1.1. China

            15.2.1.2. Japan

            15.2.1.3. South Korea

        15.2.2. By Type

        15.2.3. By Packaging

        15.2.4. By Process

        15.2.5. By End-Use

    15.3. Market Attractiveness Analysis

        15.3.1. By Country

        15.3.2. By Type

        15.3.3. By Packaging

        15.3.4. By Process

        15.3.5. By End-Use

    15.4. Key Takeaways

16. Middle East and Africa Market Analysis 2019 to 2023 and Forecast 2024 to 2034, By Country

    16.1. Historical Market Size Value (US$ Million) & Volume (Units) Trend Analysis By Market Taxonomy, 2019 to 2023

    16.2. Market Size Value (US$ Million) & Volume (Units) Forecast By Market Taxonomy, 2024 to 2034

        16.2.1. By Country

            16.2.1.1. GCC Countries

            16.2.1.2. South Africa

            16.2.1.3. Israel

            16.2.1.4. Rest of MEA

        16.2.2. By Type

        16.2.3. By Packaging

        16.2.4. By Process

        16.2.5. By End-Use

    16.3. Market Attractiveness Analysis

        16.3.1. By Country

        16.3.2. By Type

        16.3.3. By Packaging

        16.3.4. By Process

        16.3.5. By End-Use

    16.4. Key Takeaways

17. Key Countries Market Analysis

    17.1. USA

        17.1.1. Pricing Analysis

        17.1.2. Market Share Analysis, 2023

            17.1.2.1. By Type

            17.1.2.2. By Packaging

            17.1.2.3. By Process

            17.1.2.4. By End-Use

    17.2. Canada

        17.2.1. Pricing Analysis

        17.2.2. Market Share Analysis, 2023

            17.2.2.1. By Type

            17.2.2.2. By Packaging

            17.2.2.3. By Process

            17.2.2.4. By End-Use

    17.3. Brazil

        17.3.1. Pricing Analysis

        17.3.2. Market Share Analysis, 2023

            17.3.2.1. By Type

            17.3.2.2. By Packaging

            17.3.2.3. By Process

            17.3.2.4. By End-Use

    17.4. Mexico

        17.4.1. Pricing Analysis

        17.4.2. Market Share Analysis, 2023

            17.4.2.1. By Type

            17.4.2.2. By Packaging

            17.4.2.3. By Process

            17.4.2.4. By End-Use

    17.5. Germany

        17.5.1. Pricing Analysis

        17.5.2. Market Share Analysis, 2023

            17.5.2.1. By Type

            17.5.2.2. By Packaging

            17.5.2.3. By Process

            17.5.2.4. By End-Use

    17.6. UK

        17.6.1. Pricing Analysis

        17.6.2. Market Share Analysis, 2023

            17.6.2.1. By Type

            17.6.2.2. By Packaging

            17.6.2.3. By Process

            17.6.2.4. By End-Use

    17.7. France

        17.7.1. Pricing Analysis

        17.7.2. Market Share Analysis, 2023

            17.7.2.1. By Type

            17.7.2.2. By Packaging

            17.7.2.3. By Process

            17.7.2.4. By End-Use

    17.8. Spain

        17.8.1. Pricing Analysis

        17.8.2. Market Share Analysis, 2023

            17.8.2.1. By Type

            17.8.2.2. By Packaging

            17.8.2.3. By Process

            17.8.2.4. By End-Use

    17.9. Italy

        17.9.1. Pricing Analysis

        17.9.2. Market Share Analysis, 2023

            17.9.2.1. By Type

            17.9.2.2. By Packaging

            17.9.2.3. By Process

            17.9.2.4. By End-Use

    17.10. Poland

        17.10.1. Pricing Analysis

        17.10.2. Market Share Analysis, 2023

            17.10.2.1. By Type

            17.10.2.2. By Packaging

            17.10.2.3. By Process

            17.10.2.4. By End-Use

    17.11. Russia

        17.11.1. Pricing Analysis

        17.11.2. Market Share Analysis, 2023

            17.11.2.1. By Type

            17.11.2.2. By Packaging

            17.11.2.3. By Process

            17.11.2.4. By End-Use

    17.12. Czech Republic

        17.12.1. Pricing Analysis

        17.12.2. Market Share Analysis, 2023

            17.12.2.1. By Type

            17.12.2.2. By Packaging

            17.12.2.3. By Process

            17.12.2.4. By End-Use

    17.13. Romania

        17.13.1. Pricing Analysis

        17.13.2. Market Share Analysis, 2023

            17.13.2.1. By Type

            17.13.2.2. By Packaging

            17.13.2.3. By Process

            17.13.2.4. By End-Use

    17.14. India

        17.14.1. Pricing Analysis

        17.14.2. Market Share Analysis, 2023

            17.14.2.1. By Type

            17.14.2.2. By Packaging

            17.14.2.3. By Process

            17.14.2.4. By End-Use

    17.15. Bangladesh

        17.15.1. Pricing Analysis

        17.15.2. Market Share Analysis, 2023

            17.15.2.1. By Type

            17.15.2.2. By Packaging

            17.15.2.3. By Process

            17.15.2.4. By End-Use

    17.16. Australia

        17.16.1. Pricing Analysis

        17.16.2. Market Share Analysis, 2023

            17.16.2.1. By Type

            17.16.2.2. By Packaging

            17.16.2.3. By Process

            17.16.2.4. By End-Use

    17.17. New Zealand

        17.17.1. Pricing Analysis

        17.17.2. Market Share Analysis, 2023

            17.17.2.1. By Type

            17.17.2.2. By Packaging

            17.17.2.3. By Process

            17.17.2.4. By End-Use

    17.18. China

        17.18.1. Pricing Analysis

        17.18.2. Market Share Analysis, 2023

            17.18.2.1. By Type

            17.18.2.2. By Packaging

            17.18.2.3. By Process

            17.18.2.4. By End-Use

    17.19. Japan

        17.19.1. Pricing Analysis

        17.19.2. Market Share Analysis, 2023

            17.19.2.1. By Type

            17.19.2.2. By Packaging

            17.19.2.3. By Process

            17.19.2.4. By End-Use

    17.20. South Korea

        17.20.1. Pricing Analysis

        17.20.2. Market Share Analysis, 2023

            17.20.2.1. By Type

            17.20.2.2. By Packaging

            17.20.2.3. By Process

            17.20.2.4. By End-Use

    17.21. GCC Countries

        17.21.1. Pricing Analysis

        17.21.2. Market Share Analysis, 2023

            17.21.2.1. By Type

            17.21.2.2. By Packaging

            17.21.2.3. By Process

            17.21.2.4. By End-Use

    17.22. South Africa

        17.22.1. Pricing Analysis

        17.22.2. Market Share Analysis, 2023

            17.22.2.1. By Type

            17.22.2.2. By Packaging

            17.22.2.3. By Process

            17.22.2.4. By End-Use

    17.23. Israel

        17.23.1. Pricing Analysis

        17.23.2. Market Share Analysis, 2023

            17.23.2.1. By Type

            17.23.2.2. By Packaging

            17.23.2.3. By Process

            17.23.2.4. By End-Use

18. Market Structure Analysis

    18.1. Competition Dashboard

    18.2. Competition Benchmarking

    18.3. Market Share Analysis of Top Players

        18.3.1. By Regional

        18.3.2. By Type

        18.3.3. By Packaging

        18.3.4. By Process

        18.3.5. By End-Use

19. Competition Analysis

    19.1. Competition Deep Dive

        19.1.1. Bemis Company Inc

            19.1.1.1. Overview

            19.1.1.2. Product Portfolio

            19.1.1.3. Profitability by Market Segments

            19.1.1.4. Sales Footprint

            19.1.1.5. Strategy Overview

                19.1.1.5.1. Marketing Strategy

                19.1.1.5.2. Product Strategy

                19.1.1.5.3. Channel Strategy

        19.1.2. Amcor Limited

            19.1.2.1. Overview

            19.1.2.2. Product Portfolio

            19.1.2.3. Profitability by Market Segments

            19.1.2.4. Sales Footprint

            19.1.2.5. Strategy Overview

                19.1.2.5.1. Marketing Strategy

                19.1.2.5.2. Product Strategy

                19.1.2.5.3. Channel Strategy

        19.1.3. Mondi

            19.1.3.1. Overview

            19.1.3.2. Product Portfolio

            19.1.3.3. Profitability by Market Segments

            19.1.3.4. Sales Footprint

            19.1.3.5. Strategy Overview

                19.1.3.5.1. Marketing Strategy

                19.1.3.5.2. Product Strategy

                19.1.3.5.3. Channel Strategy

        19.1.4. WestRock Company

            19.1.4.1. Overview

            19.1.4.2. Product Portfolio

            19.1.4.3. Profitability by Market Segments

            19.1.4.4. Sales Footprint

            19.1.4.5. Strategy Overview

                19.1.4.5.1. Marketing Strategy

                19.1.4.5.2. Product Strategy

                19.1.4.5.3. Channel Strategy

        19.1.5. Tetra Laval International SA.

            19.1.5.1. Overview

            19.1.5.2. Product Portfolio

            19.1.5.3. Profitability by Market Segments

            19.1.5.4. Sales Footprint

            19.1.5.5. Strategy Overview

                19.1.5.5.1. Marketing Strategy

                19.1.5.5.2. Product Strategy

                19.1.5.5.3. Channel Strategy

        19.1.6. Sonoco Products Company

            19.1.6.1. Overview

            19.1.6.2. Product Portfolio

            19.1.6.3. Profitability by Market Segments

            19.1.6.4. Sales Footprint

            19.1.6.5. Strategy Overview

                19.1.6.5.1. Marketing Strategy

                19.1.6.5.2. Product Strategy

                19.1.6.5.3. Channel Strategy

        19.1.7. BASF SE

            19.1.7.1. Overview

            19.1.7.2. Product Portfolio

            19.1.7.3. Profitability by Market Segments

            19.1.7.4. Sales Footprint

            19.1.7.5. Strategy Overview

                19.1.7.5.1. Marketing Strategy

                19.1.7.5.2. Product Strategy

                19.1.7.5.3. Channel Strategy

        19.1.8. Sealed Air

            19.1.8.1. Overview

            19.1.8.2. Product Portfolio

            19.1.8.3. Profitability by Market Segments

            19.1.8.4. Sales Footprint

            19.1.8.5. Strategy Overview

                19.1.8.5.1. Marketing Strategy

                19.1.8.5.2. Product Strategy

                19.1.8.5.3. Channel Strategy

        19.1.9. Smurfit Kappa

            19.1.9.1. Overview

            19.1.9.2. Product Portfolio

            19.1.9.3. Profitability by Market Segments

            19.1.9.4. Sales Footprint

            19.1.9.5. Strategy Overview

                19.1.9.5.1. Marketing Strategy

                19.1.9.5.2. Product Strategy

                19.1.9.5.3. Channel Strategy

        19.1.10. Gerresheimer AG

            19.1.10.1. Overview

            19.1.10.2. Product Portfolio

            19.1.10.3. Profitability by Market Segments

            19.1.10.4. Sales Footprint

            19.1.10.5. Strategy Overview

                19.1.10.5.1. Marketing Strategy

                19.1.10.5.2. Product Strategy

                19.1.10.5.3. Channel Strategy

20. Assumptions & Acronyms Used

21. Research Methodology

List of Tables

Table 1: Global Market Value (US$ Million) Forecast by Region, 2019 to 2034

Table 2: Global Market Volume (Units) Forecast by Region, 2019 to 2034

Table 3: Global Market Value (US$ Million) Forecast by Type, 2019 to 2034

Table 4: Global Market Volume (Units) Forecast by Type, 2019 to 2034

Table 5: Global Market Value (US$ Million) Forecast by Packaging, 2019 to 2034

Table 6: Global Market Volume (Units) Forecast by Packaging, 2019 to 2034

Table 7: Global Market Value (US$ Million) Forecast by Process, 2019 to 2034

Table 8: Global Market Volume (Units) Forecast by Process, 2019 to 2034

Table 9: Global Market Value (US$ Million) Forecast by End-Use, 2019 to 2034

Table 10: Global Market Volume (Units) Forecast by End-Use, 2019 to 2034

Table 11: North America Market Value (US$ Million) Forecast by Country, 2019 to 2034

Table 12: North America Market Volume (Units) Forecast by Country, 2019 to 2034

Table 13: North America Market Value (US$ Million) Forecast by Type, 2019 to 2034

Table 14: North America Market Volume (Units) Forecast by Type, 2019 to 2034

Table 15: North America Market Value (US$ Million) Forecast by Packaging, 2019 to 2034

Table 16: North America Market Volume (Units) Forecast by Packaging, 2019 to 2034

Table 17: North America Market Value (US$ Million) Forecast by Process, 2019 to 2034

Table 18: North America Market Volume (Units) Forecast by Process, 2019 to 2034

Table 19: North America Market Value (US$ Million) Forecast by End-Use, 2019 to 2034

Table 20: North America Market Volume (Units) Forecast by End-Use, 2019 to 2034

Table 21: Latin America Market Value (US$ Million) Forecast by Country, 2019 to 2034

Table 22: Latin America Market Volume (Units) Forecast by Country, 2019 to 2034

Table 23: Latin America Market Value (US$ Million) Forecast by Type, 2019 to 2034

Table 24: Latin America Market Volume (Units) Forecast by Type, 2019 to 2034

Table 25: Latin America Market Value (US$ Million) Forecast by Packaging, 2019 to 2034

Table 26: Latin America Market Volume (Units) Forecast by Packaging, 2019 to 2034

Table 27: Latin America Market Value (US$ Million) Forecast by Process, 2019 to 2034

Table 28: Latin America Market Volume (Units) Forecast by Process, 2019 to 2034

Table 29: Latin America Market Value (US$ Million) Forecast by End-Use, 2019 to 2034

Table 30: Latin America Market Volume (Units) Forecast by End-Use, 2019 to 2034

Table 31: Western Europe Market Value (US$ Million) Forecast by Country, 2019 to 2034

Table 32: Western Europe Market Volume (Units) Forecast by Country, 2019 to 2034

Table 33: Western Europe Market Value (US$ Million) Forecast by Type, 2019 to 2034

Table 34: Western Europe Market Volume (Units) Forecast by Type, 2019 to 2034

Table 35: Western Europe Market Value (US$ Million) Forecast by Packaging, 2019 to 2034

Table 36: Western Europe Market Volume (Units) Forecast by Packaging, 2019 to 2034

Table 37: Western Europe Market Value (US$ Million) Forecast by Process, 2019 to 2034

Table 38: Western Europe Market Volume (Units) Forecast by Process, 2019 to 2034

Table 39: Western Europe Market Value (US$ Million) Forecast by End-Use, 2019 to 2034

Table 40: Western Europe Market Volume (Units) Forecast by End-Use, 2019 to 2034

Table 41: Eastern Europe Market Value (US$ Million) Forecast by Country, 2019 to 2034

Table 42: Eastern Europe Market Volume (Units) Forecast by Country, 2019 to 2034

Table 43: Eastern Europe Market Value (US$ Million) Forecast by Type, 2019 to 2034

Table 44: Eastern Europe Market Volume (Units) Forecast by Type, 2019 to 2034

Table 45: Eastern Europe Market Value (US$ Million) Forecast by Packaging, 2019 to 2034

Table 46: Eastern Europe Market Volume (Units) Forecast by Packaging, 2019 to 2034

Table 47: Eastern Europe Market Value (US$ Million) Forecast by Process, 2019 to 2034

Table 48: Eastern Europe Market Volume (Units) Forecast by Process, 2019 to 2034

Table 49: Eastern Europe Market Value (US$ Million) Forecast by End-Use, 2019 to 2034

Table 50: Eastern Europe Market Volume (Units) Forecast by End-Use, 2019 to 2034

Table 51: South Asia and Pacific Market Value (US$ Million) Forecast by Country, 2019 to 2034

Table 52: South Asia and Pacific Market Volume (Units) Forecast by Country, 2019 to 2034

Table 53: South Asia and Pacific Market Value (US$ Million) Forecast by Type, 2019 to 2034

Table 54: South Asia and Pacific Market Volume (Units) Forecast by Type, 2019 to 2034

Table 55: South Asia and Pacific Market Value (US$ Million) Forecast by Packaging, 2019 to 2034

Table 56: South Asia and Pacific Market Volume (Units) Forecast by Packaging, 2019 to 2034

Table 57: South Asia and Pacific Market Value (US$ Million) Forecast by Process, 2019 to 2034

Table 58: South Asia and Pacific Market Volume (Units) Forecast by Process, 2019 to 2034

Table 59: South Asia and Pacific Market Value (US$ Million) Forecast by End-Use, 2019 to 2034

Table 60: South Asia and Pacific Market Volume (Units) Forecast by End-Use, 2019 to 2034

Table 61: East Asia Market Value (US$ Million) Forecast by Country, 2019 to 2034

Table 62: East Asia Market Volume (Units) Forecast by Country, 2019 to 2034

Table 63: East Asia Market Value (US$ Million) Forecast by Type, 2019 to 2034

Table 64: East Asia Market Volume (Units) Forecast by Type, 2019 to 2034

Table 65: East Asia Market Value (US$ Million) Forecast by Packaging, 2019 to 2034

Table 66: East Asia Market Volume (Units) Forecast by Packaging, 2019 to 2034

Table 67: East Asia Market Value (US$ Million) Forecast by Process, 2019 to 2034

Table 68: East Asia Market Volume (Units) Forecast by Process, 2019 to 2034

Table 69: East Asia Market Value (US$ Million) Forecast by End-Use, 2019 to 2034

Table 70: East Asia Market Volume (Units) Forecast by End-Use, 2019 to 2034

Table 71: Middle East and Africa Market Value (US$ Million) Forecast by Country, 2019 to 2034

Table 72: Middle East and Africa Market Volume (Units) Forecast by Country, 2019 to 2034

Table 73: Middle East and Africa Market Value (US$ Million) Forecast by Type, 2019 to 2034

Table 74: Middle East and Africa Market Volume (Units) Forecast by Type, 2019 to 2034

Table 75: Middle East and Africa Market Value (US$ Million) Forecast by Packaging, 2019 to 2034

Table 76: Middle East and Africa Market Volume (Units) Forecast by Packaging, 2019 to 2034

Table 77: Middle East and Africa Market Value (US$ Million) Forecast by Process, 2019 to 2034

Table 78: Middle East and Africa Market Volume (Units) Forecast by Process, 2019 to 2034

Table 79: Middle East and Africa Market Value (US$ Million) Forecast by End-Use, 2019 to 2034

Table 80: Middle East and Africa Market Volume (Units) Forecast by End-Use, 2019 to 2034

List of Charts

Figure 1: Global Market Value (US$ Million) by Type, 2024 to 2034

Figure 2: Global Market Value (US$ Million) by Packaging, 2024 to 2034

Figure 3: Global Market Value (US$ Million) by Process, 2024 to 2034

Figure 4: Global Market Value (US$ Million) by End-Use, 2024 to 2034

Figure 5: Global Market Value (US$ Million) by Region, 2024 to 2034

Figure 6: Global Market Value (US$ Million) Analysis by Region, 2019 to 2034

Figure 7: Global Market Volume (Units) Analysis by Region, 2019 to 2034

Figure 8: Global Market Value Share (%) and BPS Analysis by Region, 2024 to 2034

Figure 9: Global Market Y-o-Y Growth (%) Projections by Region, 2024 to 2034

Figure 10: Global Market Value (US$ Million) Analysis by Type, 2019 to 2034

Figure 11: Global Market Volume (Units) Analysis by Type, 2019 to 2034

Figure 12: Global Market Value Share (%) and BPS Analysis by Type, 2024 to 2034

Figure 13: Global Market Y-o-Y Growth (%) Projections by Type, 2024 to 2034

Figure 14: Global Market Value (US$ Million) Analysis by Packaging, 2019 to 2034

Figure 15: Global Market Volume (Units) Analysis by Packaging, 2019 to 2034

Figure 16: Global Market Value Share (%) and BPS Analysis by Packaging, 2024 to 2034

Figure 17: Global Market Y-o-Y Growth (%) Projections by Packaging, 2024 to 2034

Figure 18: Global Market Value (US$ Million) Analysis by Process, 2019 to 2034

Figure 19: Global Market Volume (Units) Analysis by Process, 2019 to 2034

Figure 20: Global Market Value Share (%) and BPS Analysis by Process, 2024 to 2034

Figure 21: Global Market Y-o-Y Growth (%) Projections by Process, 2024 to 2034

Figure 22: Global Market Value (US$ Million) Analysis by End-Use, 2019 to 2034

Figure 23: Global Market Volume (Units) Analysis by End-Use, 2019 to 2034

Figure 24: Global Market Value Share (%) and BPS Analysis by End-Use, 2024 to 2034

Figure 25: Global Market Y-o-Y Growth (%) Projections by End-Use, 2024 to 2034

Figure 26: Global Market Attractiveness by Type, 2024 to 2034

Figure 27: Global Market Attractiveness by Packaging, 2024 to 2034

Figure 28: Global Market Attractiveness by Process, 2024 to 2034

Figure 29: Global Market Attractiveness by End-Use, 2024 to 2034

Figure 30: Global Market Attractiveness by Region, 2024 to 2034

Figure 31: North America Market Value (US$ Million) by Type, 2024 to 2034

Figure 32: North America Market Value (US$ Million) by Packaging, 2024 to 2034

Figure 33: North America Market Value (US$ Million) by Process, 2024 to 2034

Figure 34: North America Market Value (US$ Million) by End-Use, 2024 to 2034

Figure 35: North America Market Value (US$ Million) by Country, 2024 to 2034

Figure 36: North America Market Value (US$ Million) Analysis by Country, 2019 to 2034

Figure 37: North America Market Volume (Units) Analysis by Country, 2019 to 2034

Figure 38: North America Market Value Share (%) and BPS Analysis by Country, 2024 to 2034

Figure 39: North America Market Y-o-Y Growth (%) Projections by Country, 2024 to 2034

Figure 40: North America Market Value (US$ Million) Analysis by Type, 2019 to 2034

Figure 41: North America Market Volume (Units) Analysis by Type, 2019 to 2034

Figure 42: North America Market Value Share (%) and BPS Analysis by Type, 2024 to 2034

Figure 43: North America Market Y-o-Y Growth (%) Projections by Type, 2024 to 2034

Figure 44: North America Market Value (US$ Million) Analysis by Packaging, 2019 to 2034

Figure 45: North America Market Volume (Units) Analysis by Packaging, 2019 to 2034

Figure 46: North America Market Value Share (%) and BPS Analysis by Packaging, 2024 to 2034

Figure 47: North America Market Y-o-Y Growth (%) Projections by Packaging, 2024 to 2034

Figure 48: North America Market Value (US$ Million) Analysis by Process, 2019 to 2034

Figure 49: North America Market Volume (Units) Analysis by Process, 2019 to 2034

Figure 50: North America Market Value Share (%) and BPS Analysis by Process, 2024 to 2034

Figure 51: North America Market Y-o-Y Growth (%) Projections by Process, 2024 to 2034

Figure 52: North America Market Value (US$ Million) Analysis by End-Use, 2019 to 2034

Figure 53: North America Market Volume (Units) Analysis by End-Use, 2019 to 2034

Figure 54: North America Market Value Share (%) and BPS Analysis by End-Use, 2024 to 2034

Figure 55: North America Market Y-o-Y Growth (%) Projections by End-Use, 2024 to 2034

Figure 56: North America Market Attractiveness by Type, 2024 to 2034

Figure 57: North America Market Attractiveness by Packaging, 2024 to 2034

Figure 58: North America Market Attractiveness by Process, 2024 to 2034

Figure 59: North America Market Attractiveness by End-Use, 2024 to 2034

Figure 60: North America Market Attractiveness by Country, 2024 to 2034

Figure 61: Latin America Market Value (US$ Million) by Type, 2024 to 2034

Figure 62: Latin America Market Value (US$ Million) by Packaging, 2024 to 2034

Figure 63: Latin America Market Value (US$ Million) by Process, 2024 to 2034

Figure 64: Latin America Market Value (US$ Million) by End-Use, 2024 to 2034

Figure 65: Latin America Market Value (US$ Million) by Country, 2024 to 2034

Figure 66: Latin America Market Value (US$ Million) Analysis by Country, 2019 to 2034

Figure 67: Latin America Market Volume (Units) Analysis by Country, 2019 to 2034

Figure 68: Latin America Market Value Share (%) and BPS Analysis by Country, 2024 to 2034

Figure 69: Latin America Market Y-o-Y Growth (%) Projections by Country, 2024 to 2034

Figure 70: Latin America Market Value (US$ Million) Analysis by Type, 2019 to 2034

Figure 71: Latin America Market Volume (Units) Analysis by Type, 2019 to 2034

Figure 72: Latin America Market Value Share (%) and BPS Analysis by Type, 2024 to 2034

Figure 73: Latin America Market Y-o-Y Growth (%) Projections by Type, 2024 to 2034

Figure 74: Latin America Market Value (US$ Million) Analysis by Packaging, 2019 to 2034

Figure 75: Latin America Market Volume (Units) Analysis by Packaging, 2019 to 2034

Figure 76: Latin America Market Value Share (%) and BPS Analysis by Packaging, 2024 to 2034

Figure 77: Latin America Market Y-o-Y Growth (%) Projections by Packaging, 2024 to 2034

Figure 78: Latin America Market Value (US$ Million) Analysis by Process, 2019 to 2034

Figure 79: Latin America Market Volume (Units) Analysis by Process, 2019 to 2034

Figure 80: Latin America Market Value Share (%) and BPS Analysis by Process, 2024 to 2034

Figure 81: Latin America Market Y-o-Y Growth (%) Projections by Process, 2024 to 2034

Figure 82: Latin America Market Value (US$ Million) Analysis by End-Use, 2019 to 2034

Figure 83: Latin America Market Volume (Units) Analysis by End-Use, 2019 to 2034

Figure 84: Latin America Market Value Share (%) and BPS Analysis by End-Use, 2024 to 2034

Figure 85: Latin America Market Y-o-Y Growth (%) Projections by End-Use, 2024 to 2034

Figure 86: Latin America Market Attractiveness by Type, 2024 to 2034

Figure 87: Latin America Market Attractiveness by Packaging, 2024 to 2034

Figure 88: Latin America Market Attractiveness by Process, 2024 to 2034

Figure 89: Latin America Market Attractiveness by End-Use, 2024 to 2034

Figure 90: Latin America Market Attractiveness by Country, 2024 to 2034

Figure 91: Western Europe Market Value (US$ Million) by Type, 2024 to 2034

Figure 92: Western Europe Market Value (US$ Million) by Packaging, 2024 to 2034

Figure 93: Western Europe Market Value (US$ Million) by Process, 2024 to 2034

Figure 94: Western Europe Market Value (US$ Million) by End-Use, 2024 to 2034

Figure 95: Western Europe Market Value (US$ Million) by Country, 2024 to 2034

Figure 96: Western Europe Market Value (US$ Million) Analysis by Country, 2019 to 2034

Figure 97: Western Europe Market Volume (Units) Analysis by Country, 2019 to 2034

Figure 98: Western Europe Market Value Share (%) and BPS Analysis by Country, 2024 to 2034

Figure 99: Western Europe Market Y-o-Y Growth (%) Projections by Country, 2024 to 2034

Figure 100: Western Europe Market Value (US$ Million) Analysis by Type, 2019 to 2034

Figure 101: Western Europe Market Volume (Units) Analysis by Type, 2019 to 2034

Figure 102: Western Europe Market Value Share (%) and BPS Analysis by Type, 2024 to 2034

Figure 103: Western Europe Market Y-o-Y Growth (%) Projections by Type, 2024 to 2034

Figure 104: Western Europe Market Value (US$ Million) Analysis by Packaging, 2019 to 2034

Figure 105: Western Europe Market Volume (Units) Analysis by Packaging, 2019 to 2034

Figure 106: Western Europe Market Value Share (%) and BPS Analysis by Packaging, 2024 to 2034

Figure 107: Western Europe Market Y-o-Y Growth (%) Projections by Packaging, 2024 to 2034

Figure 108: Western Europe Market Value (US$ Million) Analysis by Process, 2019 to 2034

Figure 109: Western Europe Market Volume (Units) Analysis by Process, 2019 to 2034

Figure 110: Western Europe Market Value Share (%) and BPS Analysis by Process, 2024 to 2034

Figure 111: Western Europe Market Y-o-Y Growth (%) Projections by Process, 2024 to 2034

Figure 112: Western Europe Market Value (US$ Million) Analysis by End-Use, 2019 to 2034

Figure 113: Western Europe Market Volume (Units) Analysis by End-Use, 2019 to 2034

Figure 114: Western Europe Market Value Share (%) and BPS Analysis by End-Use, 2024 to 2034

Figure 115: Western Europe Market Y-o-Y Growth (%) Projections by End-Use, 2024 to 2034

Figure 116: Western Europe Market Attractiveness by Type, 2024 to 2034

Figure 117: Western Europe Market Attractiveness by Packaging, 2024 to 2034

Figure 118: Western Europe Market Attractiveness by Process, 2024 to 2034

Figure 119: Western Europe Market Attractiveness by End-Use, 2024 to 2034

Figure 120: Western Europe Market Attractiveness by Country, 2024 to 2034

Figure 121: Eastern Europe Market Value (US$ Million) by Type, 2024 to 2034

Figure 122: Eastern Europe Market Value (US$ Million) by Packaging, 2024 to 2034

Figure 123: Eastern Europe Market Value (US$ Million) by Process, 2024 to 2034

Figure 124: Eastern Europe Market Value (US$ Million) by End-Use, 2024 to 2034

Figure 125: Eastern Europe Market Value (US$ Million) by Country, 2024 to 2034

Figure 126: Eastern Europe Market Value (US$ Million) Analysis by Country, 2019 to 2034

Figure 127: Eastern Europe Market Volume (Units) Analysis by Country, 2019 to 2034

Figure 128: Eastern Europe Market Value Share (%) and BPS Analysis by Country, 2024 to 2034

Figure 129: Eastern Europe Market Y-o-Y Growth (%) Projections by Country, 2024 to 2034

Figure 130: Eastern Europe Market Value (US$ Million) Analysis by Type, 2019 to 2034

Figure 131: Eastern Europe Market Volume (Units) Analysis by Type, 2019 to 2034

Figure 132: Eastern Europe Market Value Share (%) and BPS Analysis by Type, 2024 to 2034

Figure 133: Eastern Europe Market Y-o-Y Growth (%) Projections by Type, 2024 to 2034

Figure 134: Eastern Europe Market Value (US$ Million) Analysis by Packaging, 2019 to 2034

Figure 135: Eastern Europe Market Volume (Units) Analysis by Packaging, 2019 to 2034

Figure 136: Eastern Europe Market Value Share (%) and BPS Analysis by Packaging, 2024 to 2034

Figure 137: Eastern Europe Market Y-o-Y Growth (%) Projections by Packaging, 2024 to 2034

Figure 138: Eastern Europe Market Value (US$ Million) Analysis by Process, 2019 to 2034

Figure 139: Eastern Europe Market Volume (Units) Analysis by Process, 2019 to 2034

Figure 140: Eastern Europe Market Value Share (%) and BPS Analysis by Process, 2024 to 2034

Figure 141: Eastern Europe Market Y-o-Y Growth (%) Projections by Process, 2024 to 2034

Figure 142: Eastern Europe Market Value (US$ Million) Analysis by End-Use, 2019 to 2034

Figure 143: Eastern Europe Market Volume (Units) Analysis by End-Use, 2019 to 2034

Figure 144: Eastern Europe Market Value Share (%) and BPS Analysis by End-Use, 2024 to 2034

Figure 145: Eastern Europe Market Y-o-Y Growth (%) Projections by End-Use, 2024 to 2034

Figure 146: Eastern Europe Market Attractiveness by Type, 2024 to 2034

Figure 147: Eastern Europe Market Attractiveness by Packaging, 2024 to 2034

Figure 148: Eastern Europe Market Attractiveness by Process, 2024 to 2034

Figure 149: Eastern Europe Market Attractiveness by End-Use, 2024 to 2034

Figure 150: Eastern Europe Market Attractiveness by Country, 2024 to 2034

Figure 151: South Asia and Pacific Market Value (US$ Million) by Type, 2024 to 2034

Figure 152: South Asia and Pacific Market Value (US$ Million) by Packaging, 2024 to 2034

Figure 153: South Asia and Pacific Market Value (US$ Million) by Process, 2024 to 2034

Figure 154: South Asia and Pacific Market Value (US$ Million) by End-Use, 2024 to 2034

Figure 155: South Asia and Pacific Market Value (US$ Million) by Country, 2024 to 2034

Figure 156: South Asia and Pacific Market Value (US$ Million) Analysis by Country, 2019 to 2034

Figure 157: South Asia and Pacific Market Volume (Units) Analysis by Country, 2019 to 2034

Figure 158: South Asia and Pacific Market Value Share (%) and BPS Analysis by Country, 2024 to 2034

Figure 159: South Asia and Pacific Market Y-o-Y Growth (%) Projections by Country, 2024 to 2034

Figure 160: South Asia and Pacific Market Value (US$ Million) Analysis by Type, 2019 to 2034

Figure 161: South Asia and Pacific Market Volume (Units) Analysis by Type, 2019 to 2034

Figure 162: South Asia and Pacific Market Value Share (%) and BPS Analysis by Type, 2024 to 2034

Figure 163: South Asia and Pacific Market Y-o-Y Growth (%) Projections by Type, 2024 to 2034

Figure 164: South Asia and Pacific Market Value (US$ Million) Analysis by Packaging, 2019 to 2034

Figure 165: South Asia and Pacific Market Volume (Units) Analysis by Packaging, 2019 to 2034

Figure 166: South Asia and Pacific Market Value Share (%) and BPS Analysis by Packaging, 2024 to 2034

Figure 167: South Asia and Pacific Market Y-o-Y Growth (%) Projections by Packaging, 2024 to 2034

Figure 168: South Asia and Pacific Market Value (US$ Million) Analysis by Process, 2019 to 2034

Figure 169: South Asia and Pacific Market Volume (Units) Analysis by Process, 2019 to 2034

Figure 170: South Asia and Pacific Market Value Share (%) and BPS Analysis by Process, 2024 to 2034

Figure 171: South Asia and Pacific Market Y-o-Y Growth (%) Projections by Process, 2024 to 2034

Figure 172: South Asia and Pacific Market Value (US$ Million) Analysis by End-Use, 2019 to 2034

Figure 173: South Asia and Pacific Market Volume (Units) Analysis by End-Use, 2019 to 2034

Figure 174: South Asia and Pacific Market Value Share (%) and BPS Analysis by End-Use, 2024 to 2034

Figure 175: South Asia and Pacific Market Y-o-Y Growth (%) Projections by End-Use, 2024 to 2034

Figure 176: South Asia and Pacific Market Attractiveness by Type, 2024 to 2034

Figure 177: South Asia and Pacific Market Attractiveness by Packaging, 2024 to 2034

Figure 178: South Asia and Pacific Market Attractiveness by Process, 2024 to 2034

Figure 179: South Asia and Pacific Market Attractiveness by End-Use, 2024 to 2034

Figure 180: South Asia and Pacific Market Attractiveness by Country, 2024 to 2034

Figure 181: East Asia Market Value (US$ Million) by Type, 2024 to 2034

Figure 182: East Asia Market Value (US$ Million) by Packaging, 2024 to 2034

Figure 183: East Asia Market Value (US$ Million) by Process, 2024 to 2034

Figure 184: East Asia Market Value (US$ Million) by End-Use, 2024 to 2034

Figure 185: East Asia Market Value (US$ Million) by Country, 2024 to 2034

Figure 186: East Asia Market Value (US$ Million) Analysis by Country, 2019 to 2034

Figure 187: East Asia Market Volume (Units) Analysis by Country, 2019 to 2034

Figure 188: East Asia Market Value Share (%) and BPS Analysis by Country, 2024 to 2034

Figure 189: East Asia Market Y-o-Y Growth (%) Projections by Country, 2024 to 2034

Figure 190: East Asia Market Value (US$ Million) Analysis by Type, 2019 to 2034

Figure 191: East Asia Market Volume (Units) Analysis by Type, 2019 to 2034

Figure 192: East Asia Market Value Share (%) and BPS Analysis by Type, 2024 to 2034

Figure 193: East Asia Market Y-o-Y Growth (%) Projections by Type, 2024 to 2034

Figure 194: East Asia Market Value (US$ Million) Analysis by Packaging, 2019 to 2034

Figure 195: East Asia Market Volume (Units) Analysis by Packaging, 2019 to 2034

Figure 196: East Asia Market Value Share (%) and BPS Analysis by Packaging, 2024 to 2034

Figure 197: East Asia Market Y-o-Y Growth (%) Projections by Packaging, 2024 to 2034

Figure 198: East Asia Market Value (US$ Million) Analysis by Process, 2019 to 2034

Figure 199: East Asia Market Volume (Units) Analysis by Process, 2019 to 2034

Figure 200: East Asia Market Value Share (%) and BPS Analysis by Process, 2024 to 2034

Figure 201: East Asia Market Y-o-Y Growth (%) Projections by Process, 2024 to 2034

Figure 202: East Asia Market Value (US$ Million) Analysis by End-Use, 2019 to 2034

Figure 203: East Asia Market Volume (Units) Analysis by End-Use, 2019 to 2034

Figure 204: East Asia Market Value Share (%) and BPS Analysis by End-Use, 2024 to 2034

Figure 205: East Asia Market Y-o-Y Growth (%) Projections by End-Use, 2024 to 2034

Figure 206: East Asia Market Attractiveness by Type, 2024 to 2034

Figure 207: East Asia Market Attractiveness by Packaging, 2024 to 2034

Figure 208: East Asia Market Attractiveness by Process, 2024 to 2034

Figure 209: East Asia Market Attractiveness by End-Use, 2024 to 2034

Figure 210: East Asia Market Attractiveness by Country, 2024 to 2034

Figure 211: Middle East and Africa Market Value (US$ Million) by Type, 2024 to 2034

Figure 212: Middle East and Africa Market Value (US$ Million) by Packaging, 2024 to 2034

Figure 213: Middle East and Africa Market Value (US$ Million) by Process, 2024 to 2034

Figure 214: Middle East and Africa Market Value (US$ Million) by End-Use, 2024 to 2034

Figure 215: Middle East and Africa Market Value (US$ Million) by Country, 2024 to 2034

Figure 216: Middle East and Africa Market Value (US$ Million) Analysis by Country, 2019 to 2034

Figure 217: Middle East and Africa Market Volume (Units) Analysis by Country, 2019 to 2034

Figure 218: Middle East and Africa Market Value Share (%) and BPS Analysis by Country, 2024 to 2034

Figure 219: Middle East and Africa Market Y-o-Y Growth (%) Projections by Country, 2024 to 2034

Figure 220: Middle East and Africa Market Value (US$ Million) Analysis by Type, 2019 to 2034

Figure 221: Middle East and Africa Market Volume (Units) Analysis by Type, 2019 to 2034

Figure 222: Middle East and Africa Market Value Share (%) and BPS Analysis by Type, 2024 to 2034

Figure 223: Middle East and Africa Market Y-o-Y Growth (%) Projections by Type, 2024 to 2034

Figure 224: Middle East and Africa Market Value (US$ Million) Analysis by Packaging, 2019 to 2034

Figure 225: Middle East and Africa Market Volume (Units) Analysis by Packaging, 2019 to 2034

Figure 226: Middle East and Africa Market Value Share (%) and BPS Analysis by Packaging, 2024 to 2034

Figure 227: Middle East and Africa Market Y-o-Y Growth (%) Projections by Packaging, 2024 to 2034

Figure 228: Middle East and Africa Market Value (US$ Million) Analysis by Process, 2019 to 2034

Figure 229: Middle East and Africa Market Volume (Units) Analysis by Process, 2019 to 2034

Figure 230: Middle East and Africa Market Value Share (%) and BPS Analysis by Process, 2024 to 2034

Figure 231: Middle East and Africa Market Y-o-Y Growth (%) Projections by Process, 2024 to 2034

Figure 232: Middle East and Africa Market Value (US$ Million) Analysis by End-Use, 2019 to 2034

Figure 233: Middle East and Africa Market Volume (Units) Analysis by End-Use, 2019 to 2034

Figure 234: Middle East and Africa Market Value Share (%) and BPS Analysis by End-Use, 2024 to 2034

Figure 235: Middle East and Africa Market Y-o-Y Growth (%) Projections by End-Use, 2024 to 2034

Figure 236: Middle East and Africa Market Attractiveness by Type, 2024 to 2034

Figure 237: Middle East and Africa Market Attractiveness by Packaging, 2024 to 2034

Figure 238: Middle East and Africa Market Attractiveness by Process, 2024 to 2034

Figure 239: Middle East and Africa Market Attractiveness by End-Use, 2024 to 2034

Figure 240: Middle East and Africa Market Attractiveness by Country, 2024 to 2034

Recommendations

Packaging

Sustainable Packaging Market

Published : February 2024

Chemicals & Materials

Biobased Biodegradable Plastic Market

Published : October 2023

Packaging

Biodegradable Packaging Market

Published : September 2022

Explore Packaging Insights

View Reports

Sustainable Plastic Packaging Market