Sustainable Labels Market
Sustainable Labels: Innovative Labelling Solutions as Ideal Green Marketing Tools for Companies across the U.S., Japan, Korea, Germany, U.K., and 30+Countries! Explore More with FMI’s New Report
Sustainable Labels Market by Material Type, Label Type, Printing Technology, End Use & Region - Forecast 2022 – 2032
Sustainable Labels Market Outlook 2022-2032
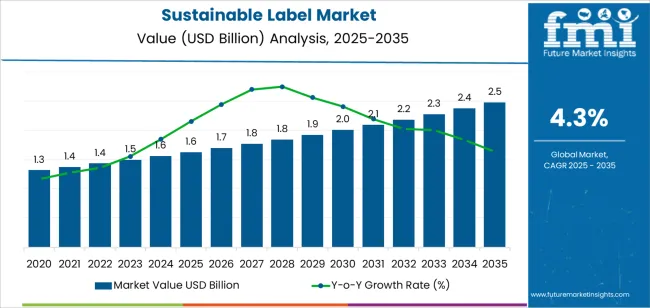
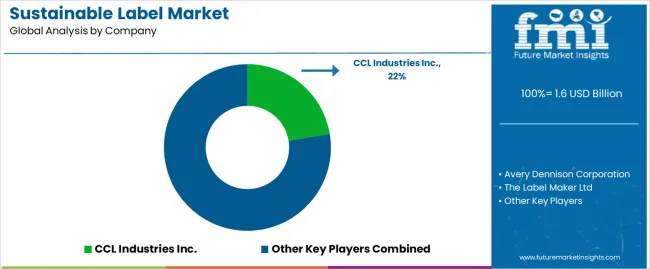
The global sustainable labels market is set to enjoy a valuation of US$ 15.6 Bn in 2022, and further expand at a CAGR of 5.7% between 2022 and 2032 to reach US$ 27.2 Bn by 2032. With sustainability becoming a more important factor in purchasing decisions, overall sustainable label sales are anticipated to bolster with the top 5 providers holding 15-20% of the global sustainable labels market in 2021.
Based on the material, paper is projected to remain the leading segment and it is estimated to create an incremental opportunity of US$ 7.7 Bn during 2022-2032. Growing usage of paper labels across various industries due to their eco-friendly nature is driving growth of the target segment. The sustainable labels industry is projected to grow 1.8x the current market value during the forecast period (2022-2032), creating an absolute incremental growth opportunity of US$ 12.1 Bn.
The overall sustainable labels market forms around 35-40% of the global labels market which stood at US$ 40 Bn in 2021, and this number is expected to further grow during the projected period amid increased adoption of sustainable and eco-friendly packaging by the end-users.
Sustainable labels are labelling solutions that testify to the product’s attention to safety for environment in comparison to others. These labels have become ideal marketing tools for companies to tell their customers that by purchasing their products, they are making a more eco-conscious and sustainable choice. These labels also reduce waste and impact on environmental as they use eco-friendly materials (paper) and adhesives, and are easy to recycle.
Rising demand for eco-friendly packaging solutions and labelling across the world coupled with rising environmental concerns is a key factor expected to boost the growth during the forecast period. Today, millennials and Gen Z are using their purchasing power to support brands that invest in ethical practices like environmental sustainability. As a result, more and more companies are utilizing sustainable labels in their products. This will continue to act as a catalyst triggering the growth in the market during the projection period.
Similarly, increasing production and consumption of packaged goods, especially packaged food items, across the globe is expected to boost the global market over the next decade. Factors such as population explosion, increasing disposable income, and changing lifestyles have resulted in increased consumption of packaged food products. As sustainable labels are being increasingly used in these packaged food items, rise in their production and consumption will eventually bolster sales in the market.
Attribute |
Key Insights |
Sustainable Labels Estimated Market Size (2022) |
US$ 15.6 Bn |
Projected Market Size (2032) |
US$ 27.2 Bn |
Value-based CAGR (2022-2032) |
5.7% |
Collective Value Share: Top 3 Countries (2022E) |
25-30% |
Let us know your requirement to get
100% FREE customization
2015-2021 Sustainable Labels Market Outlook Compared to 2022-2032 Forecast
The global demand for sustainable labels grew at a CAGR of 4.3% during the historic period from 2015 to 2021 and totaled a valuation of US$ 15.1 Bn by the end of 2021. However, with growing environmental concerns and increasing consumer preference for sustainable packaging, the overall sales of sustainable levels are projected to rise at 5.7% CAGR between 2022 and 2032.
A sustainable label is any labelling on product that indicates the product's courtesy to environmental safety compared to others. Further, sustainable labels, which have been applied to the products, indicate special symbols that alert the reader to the fact that the product is better for the environment than other products.
The constantly growing food & beverage as well as food service industry is predicted to drive the demand for sustainable labels during the assessment period. The increased usage of packed food is creating a growth opportunity for the sustainable labels industry and the trend is likely to continue during the forecast period.
Similarly, rise in the number of environment-conscious consumers across the globe is expected to propel sales of sustainable labels over the next ten years. With growing environmental concerns, consumers are adopting sustainable consumption patterns. They are preferring products with green packaging and labelling. This has prompted companies to use sustainable labels in their products and will continue to play a pivotal role in moving the global market for sustainable labels forwards throughout the forecast period.
Comparative Analysis of Sustainable Labels Markets
Sustainable Labels Market:
Differentiating Aspects |
Sustainable Labels Market |
CAGR in 2022-2032 |
5.7% |
Current Valuation in 2022 |
US$ 15.6 Bn |
Projected Valuation in 2032 |
US$ 27.2 Bn |
Demand Drivers |
|
Labels Market:
Differentiating Aspects |
Labels Market |
CAGR in 2022-2032 |
4.8% |
Current Valuation in 2022 |
US$ 39.8 Bn |
Projected Valuation in 2032 |
US$ 63.7 Bn |
Demand Drivers |
|
Linerless Labels Market:
Differentiating Aspects |
Linerless Labels Market |
CAGR in 2022-2032 |
4.9% |
Current Valuation in 2022 |
US$ 1.8 Bn |
Projected Valuation in 2032 |
US$ 2.9 Bn |
Demand Drivers |
|
Find your sweet spots for generating winning opportunities in this market.
Talk to AnalystWhat are the Key Trends Driving the Global Market for Sustainable Labels?
“Increasing Environmental Concerns Boosting the Market for Sustainable Labels”
Labels are generally used to inform consumers about credentials, directions for use, warnings, etc. to the consumers. The increased concern about the environment is driving the market for sustainable labels as labels play a significant role in every industry for packaging, and the shelf life of labels has become a perilous concern for the manufacturer as well as consumers.
Labels are used universally in everyday life products from large industries to small industries. However, with growing environmental concerns, sustainable labels are rapidly replacing other traditional labels.
Because of pollution, landfills, and non-recyclable scraps, the environment is currently facing a sustainability challenge. Consumers are demanding environmentally friendly packaging and labelling solutions to reduce the environmental impact of products. These factors are propelling the demand for sustainable labels and will eventually expand the global sustainable labels industry over the projected period.
Country-wise insights
Why is India Becoming a Lucrative Market for Sustainable Label Manufacturers?
“Growing Paper Industry Expected Driving Demand for Sustainable Labels in India”
As per FMI, the overall market for sustainable labels across India is predicted to accelerate at 6.1% CAGR during the forecast period, owing to the rapid growth of paper and packaging industries in the country.
The growing paper industry in India is projected to drive the demand for sustainable labels over the projected period. There has been substantial growth in the packaging industry in India. The reason for it is the availability of raw materials like paper.
According to the data provided by Indian Paper Manufacturers Association (IPMA), the Indian paper industry accounts for about 5% of the world’s production of paper. Further, about 71% of paper is produced from recycled fibre and the Indian paper industry is growing at a faster pace due to innovation and technology.
Paper is being increasingly used in the packaging industry to replace materials like plastic. As the paper is top material for sustainable labels, the growing paper industry is expected to increase the production. This will drive the market for sustainable labels swiftly in India during the projection period.
What is Driving the Market for Sustainable Labels Across the U.S.?
“High Recycling Rate of Paper Driving the U.S. Market”
FMI analysis states that the U.S. market is estimated to create an incremental opportunity of US$ 1.3 Bn during the assessment period of 2022-2032. Factors such as growing environmental concerns and consumer preference for packaged products are driving sustainable labels sales in the country.
Similarly, growing popularity of paper-based sustainable labels and high recycling rate of paper are positively influencing the overall sustainable labels industry in the country.
According to the data collected from the World Economic Forum, in 2021, more than 50 million tons of paper were recovered for recycling, with a recycling rate of 68%. This huge recycling rate and increased preference for packaged products have increased the usage of sustainable labels, thereby driving the market in the country.

A unified Market Research Subscription Platform, built for today's disparate research needs.
Category-wise Insights
Which is the Most Preferred Material for Making Sustainable Labels?
“Paper to Remain the Highly Sought-After Material Type Among Manufacturers”
Based on material type, the paper segment is predicted to hold around 59% of the market share by the end of 2022 and further growth at a steady pace over the next ten years. This is due to the attractive benefits of paper material such as easy recyclable properties, ease of use, and good tear stability. Thanks to these advantages, paper is being increasingly used for the production of sustainable labels across multiple industries.
Which is the Leading End Use Industry for Sustainable Labels?
“Most of the Demand to Arise from Pharmaceutical Industry”
As per FMI, based on the end use, the pharmaceutical sector is predicted to offer lucrative growth opportunities of US$ 1.6 Bn in the market during the forecast period. This can be attributed to the robust growth of pharmaceutical industry worldwide and increasing usage of sustainable labels in this sector over traditional ones.
The rise of the pharmaceutical industry has not halted even during the pandemic. Being an essential industry, there has been a massive spike in demand for medicines and other healthcare products from hospitals as well as consumers, and the trend is likely to continue during the upcoming years. This in turn is expected to create a profitable growth opportunity for sustainable labels manufacturers.
Competitive Landscape
Key manufacturers of sustainable labels are focusing on increasing their sales and revenues as well as meeting end user demands by expanding their capabilities. They are adopting merger & acquisition strategy to expand their resources and are developing new products to meet customer needs. Some of the recent key developments by the leading players are as follows –
- In June 2022, THE Label Makers LIMITED collaborated with cocktail mixologists, White Label Cocktails, to produce labels for the Marksologist range by M&S.
- In April 2022, HERMA GmbH developed the first thermal printer labelstock free from chemical developers.
- In October 2021, Paramount Labels collaborated with Bar Graphic Machinery for their 'BGM 370 eDSR with web advance High Speed Die Cutting Rewinder' to make the process of label manufacturing simpler.
Scope of the Report
Attribute |
Details |
Estimated Market Value (2022) |
US$ 15.6 Bn |
Projected Market Value (2032) |
US$ 27.2 Bn |
Anticipated Growth Rate (2022-2032) |
5.7% CAGR |
Historical Data |
2015-2021 |
Forecast Period |
2022-2032 |
Market Analysis |
Revenue in US$ Billion, Volume in Mn Sq.M, and CAGR from 2022-2032 |
Report Coverage |
Revenue Forecast, Volume Forecast, Company Ranking, Competitive Landscape, Growth Factors, Trends, and Pricing Analysis |
Segments Covered |
|
Regions Covered |
|
Key Countries Covered |
|
Key Companies Profiled |
|
Report Coverage |
Revenue Forecast, Volume Forecast, Company Ranking, Competitive Landscape, Growth Factors, Trends, and Pricing Analysis |
Sustainable Labels Industry by Category
By Material Type:
- Plastic
- Paper
By Label Type:
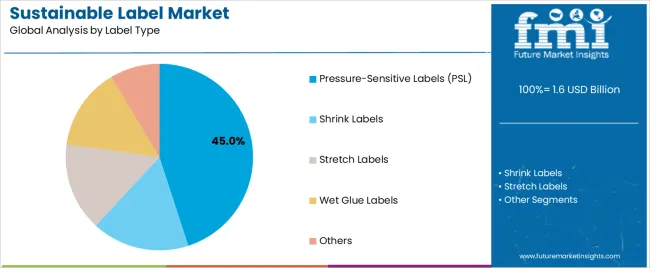
- Pressure Sensitive Labels (PSL)
- Shrink Labels
- Stretch Labels
- Wet Glue Labels
- Others (In-mold, Pre-gummed, etc.)
By Printing Technology:
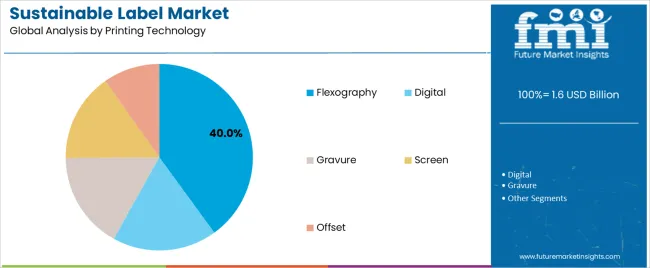
- Flexography
- Digital
- Gravure
- Screen
- Offset
By End Use:
- Food & Beverages
- Pharmaceuticals
- Cosmetics & Personal Care
- Homecare
- Clothing & Apparels
- Chemicals
- Automobiles
- Others Consumer Goods
By Region:
- North America
- Latin America
- Europe
- South Asia
- East Asia
- Middle East & Africa
- Oceania
Frequently Asked Questions
The global sustainable labels market size is expected to reach US$ 15.6 Bn in 2022.
At what rate is the global sustainable labels market projected to expand during the forecast period?
The global market for sustainable labels is anticipated to expand 1.8 times between 2022 and 2032.
The global sustainable labels industry is expected to reach US$ 27.2 Bn by the end of 2032.
During the forecast period, paper is likely to be the fastest-growing material segment.
Increasing environmental concerns among manufacturers and consumers is driving demand for sustainable labels.
HERMA GmbH, CCL Industries, Avery Products Pty Ltd., THE Label Makers LIMITED, Berkshire Labels, Crown Labels Mfg. Co Ltd, and JK Labels are the top players supplementing the sales of sustainable labels.
As per the FMI analysis, the India sustainable labels market is projected to expand at a CAGR of 5.7% during 2022-32.
Table of Content
1. Executive Summary
1.1. Global Market Outlook
1.2. Demand-side Trends
1.3. Supply-side Trends
1.4. Technology Roadmap Analysis
1.5. Analysis and Recommendations
2. Market Overview
2.1. Market Coverage / Taxonomy
2.2. Market Definition / Scope / Limitations
3. Market Background
3.1. Market Dynamics
3.1.1. Drivers
3.1.2. Restraints
3.1.3. Opportunity
3.1.4. Trends
3.2. Impact of Covid-19
3.2.1. Demand in Optimistic Scenario
3.2.2. Demand in Likely Scenario
3.2.3. Demand in Conservative Scenario
3.3. Macro Factors and Forecast Factors
3.4. Value Chain Analysis
3.4.1. Profit Margin Analysis
3.4.2. Raw Material Type Suppliers
3.4.3. Manufacturers, Wholesalers, and Distributors
3.4.4. End Use/ Customers
3.5. Regional Parent Market Outlook
3.6. Production and Consumption Statistics
3.7. Global Average Pricing Analysis Benchmark
4. Global Market Analysis 2015-2021 and Forecast, 2022-2032
4.1. Historical Market Size Value (US$ Bn) & Volume (Sq. Mt.) Analysis, 2015-2021
4.2. Current and Future Market Size Value (US$ Bn) & Volume (Sq. Mt.) Projections, 2022-2032
4.2.1. Y-o-Y Growth Trend Analysis
4.2.2. Absolute $ Opportunity Analysis
5. Global Market Analysis 2015–2021 and Forecast 2022–2032, By Material Type
5.1. Introduction / Key Findings
5.2. Historical Market Size Value (US$ Bn) & Volume (Sq. Mt.) Analysis By Material Type, 2015-2021
5.3. Current and Future Market Size Value (US$ Bn) & Volume (Sq. Mt.) Analysis and Forecast By Material Type, 2022-2032
5.3.1. Plastic
5.3.2. Paper
5.4. Y-o-Y Growth Trend Analysis By Material Type, 2015-2021
5.5. Absolute $ Opportunity Analysis By Material Type, 2022-2032
6. Global Market Analysis 2015–2021 and Forecast 2022–2032, By Label Type
6.1. Introduction / Key Findings
6.2. Historical Market Size Value (US$ Bn) & Volume (Sq. Mt.) Analysis By Label Type, 2015-2021
6.3. Current and Future Market Size Value (US$ Bn) & Volume (Sq. Mt.) Analysis and Forecast By Label Type, 2022-2032
6.3.1. Pressure Sensitive Labels (PSL)
6.3.2. Shrink Labels
6.3.3. Stretch Labels
6.3.4. Wet Glue Labels
6.3.5. Others (In-mold, Pre-gummed, etc.)
6.4. Y-o-Y Growth Trend Analysis By Label Type, 2015-2021
6.5. Absolute $ Opportunity Analysis By Label Type, 2022-2032
7. Global Market Analysis 2015–2021 and Forecast 2022–2032, By Printing Technology
7.1. Introduction / Key Findings
7.2. Historical Market Size Value (US$ Bn) & Volume (Sq. Mt.) Analysis By Printing Technology, 2015-2021
7.3. Current and Future Market Size Value (US$ Bn) & Volume (Sq. Mt.) Analysis and Forecast By Printing Technology, 2022-2032
7.3.1. Flexography
7.3.2. Digital
7.3.3. Gravure
7.3.4. Screen
7.3.5. Offset
7.4. Y-o-Y Growth Trend Analysis By Printing Technology, 2015-2021
7.5. Absolute $ Opportunity Analysis By Printing Technology, 2022-2032
8. Global Market Analysis 2015–2021 and Forecast 2022–2032, By End Use
8.1. Introduction / Key Findings
8.2. Historical Market Size Value (US$ Bn) & Volume (Sq. Mt.) Analysis By End Use, 2015-2021
8.3. Current and Future Market Size Value (US$ Bn) & Volume (Sq. Mt.) Analysis and Forecast By End Use, 2022-2032
8.3.1. Food & Beverages
8.3.2. Pharmaceuticals
8.3.3. Cosmetics & Personal Care
8.3.4. Homecare
8.3.5. Clothing & Apparels
8.3.6. Chemicals
8.3.7. Automobiles
8.3.8. Others Consumer Goods
8.4. Y-o-Y Growth Trend Analysis By End Use, 2015-2021
8.5. Absolute $ Opportunity Analysis By End Use, 2022-2032
9. Global Market Analysis 2015–2021 and Forecast 2022–2032, By Region
9.1. Introduction / Key Findings
9.2. Historical Market Size Value (US$ Bn) & Volume (Sq. Mt.) Analysis By Region, 2015-2021
9.3. Current and Future Market Size Value (US$ Bn) & Volume (Sq. Mt.) Analysis and Forecast By Region, 2022-2032
9.3.1. North America
9.3.2. Latin America
9.3.3. Europe
9.3.4. East Asia
9.3.5. South Asia
9.3.6. Oceania
9.3.7. Middle East and Africa (MEA)
9.4. Market Attractiveness Analysis, by Region
10. North America Market Analysis 2015–2021 and Forecast 2022–2032, By Country
10.1. Historical Market Size Value (US$ Bn) & Volume (Sq. Mt.) Trend Analysis By Market Taxonomy, 2015-2021
10.2. Market Size Value (US$ Bn) & Volume (Sq. Mt.) Forecast By Market Taxonomy, 2022-2032
10.2.1. By Country
10.2.1.1. U.S.
10.2.1.2. Canada
10.2.2. By Material Type
10.2.3. By Label Type
10.2.4. By Printing Technology
10.2.5. By End Use
10.3. Market Attractiveness Analysis
10.3.1. By Country
10.3.2. By Material Type
10.3.3. By Label Type
10.3.4. By Printing Technology
10.3.5. By End Use
10.4. Key Takeaways
11. Latin America Market Analysis 2015–2021 and Forecast 2022–2032, By Country
11.1. Historical Market Size Value (US$ Bn) & Volume (Sq. Mt.) Trend Analysis By Market Taxonomy, 2015-2021
11.2. Market Size Value (US$ Bn) & Volume (Sq. Mt.) Forecast By Market Taxonomy, 2022-2032
11.2.1. By Country
11.2.1.1. Brazil
11.2.1.2. Mexico
11.2.1.3. Argentina
11.2.1.4. Chile
11.2.1.5. Peru
11.2.1.6. Rest of Latin America
11.2.2. By Material Type
11.2.3. By Label Type
11.2.4. By Printing Technology
11.2.5. By End Use
11.3. Market Attractiveness Analysis
11.3.1. By Country
11.3.2. By Material Type
11.3.3. By Label Type
11.3.4. By Printing Technology
11.3.5. By End Use
11.4. Key Takeaways
12. Europe Market Analysis 2015–2021 and Forecast 2022–2032, By Country
12.1. Historical Market Size Value (US$ Bn) & Volume (Sq. Mt.) Trend Analysis By Market Taxonomy, 2015-2021
12.2. Market Size Value (US$ Bn) & Volume (Sq. Mt.) Forecast By Market Taxonomy, 2022-2032
12.2.1. By Country
12.2.1.1. Germany
12.2.1.2. Italy
12.2.1.3. France
12.2.1.4. U.K.
12.2.1.5. Spain
12.2.1.6. BENELUX
12.2.1.7. Nordic
12.2.1.8. Russia
12.2.1.9. Poland
12.2.1.10. Rest of Europe
12.2.2. By Material Type
12.2.3. By Label Type
12.2.4. By Printing Technology
12.2.5. By End Use
12.3. Market Attractiveness Analysis
12.3.1. By Country
12.3.2. By Material Type
12.3.3. By Label Type
12.3.4. By Printing Technology
12.3.5. By End Use
12.4. Key Takeaways
13. East Asia Market Analysis 2015–2021 and Forecast 2022–2032, By Country
13.1. Historical Market Size Value (US$ Bn) & Volume (Sq. Mt.) Trend Analysis By Market Taxonomy, 2015-2021
13.2. Market Size Value (US$ Bn) & Volume (Sq. Mt.) Forecast By Market Taxonomy, 2022-2032
13.2.1. By Country
13.2.1.1. China
13.2.1.2. Japan
13.2.1.3. South Korea
13.2.2. By Material Type
13.2.3. By Label Type
13.2.4. By Printing Technology
13.2.5. By End Use
13.3. Market Attractiveness Analysis
13.3.1. By Country
13.3.2. By Material Type
13.3.3. By Label Type
13.3.4. By Printing Technology
13.3.5. By End Use
13.4. Key Takeaways
14. South Asia Market Analysis 2015–2021 and Forecast 2022–2032, By Country
14.1. Historical Market Size Value (US$ Bn) & Volume (Sq. Mt.) Trend Analysis By Market Taxonomy, 2015-2021
14.2. Market Size Value (US$ Bn) & Volume (Sq. Mt.) Forecast By Market Taxonomy, 2022-2032
14.2.1. By Country
14.2.1.1. India
14.2.1.2. Thailand
14.2.1.3. Malaysia
14.2.1.4. Indonesia
14.2.1.5. Rest of South Asia
14.2.2. By Material Type
14.2.3. By Label Type
14.2.4. By Printing Technology
14.2.5. By End Use
14.3. Market Attractiveness Analysis
14.3.1. By Country
14.3.2. By Material Type
14.3.3. By Label Type
14.3.4. By Printing Technology
14.3.5. By End Use
14.4. Key Takeaways
15. Oceania Market Analysis 2015–2021 and Forecast 2022–2032, By Country
15.1. Historical Market Size Value (US$ Bn) & Volume (Sq. Mt.) Trend Analysis By Market Taxonomy, 2015-2021
15.2. Market Size Value (US$ Bn) & Volume (Sq. Mt.) Forecast By Market Taxonomy, 2022-2032
15.2.1. By Country
15.2.1.1. Australia
15.2.1.2. New Zealand
15.2.2. By Material Type
15.2.3. By Label Type
15.2.4. By Printing Technology
15.2.5. By End Use
15.3. Market Attractiveness Analysis
15.3.1. By Country
15.3.2. By Material Type
15.3.3. By Label Type
15.3.4. By Printing Technology
15.3.5. By End Use
15.4. Key Takeaways
16. Middle East & Africa Market Analysis 2015–2021 and Forecast 2022–2032, By Country
16.1. Historical Market Size Value (US$ Bn) & Volume (Sq. Mt.) Trend Analysis By Market Taxonomy, 2015-2021
16.2. Market Size Value (US$ Bn) & Volume (Sq. Mt.) Forecast By Market Taxonomy, 2022-2032
16.2.1. By Country
16.2.1.1. GCC Countries
16.2.1.2. Turkey
16.2.1.3. Northern Africa
16.2.1.4. South Africa
16.2.1.5. Rest of MEA
16.2.2. By Material Type
16.2.3. By Label Type
16.2.4. By Printing Technology
16.2.5. By End Use
16.3. Market Attractiveness Analysis
16.3.1. By Country
16.3.2. By Material Type
16.3.3. By Label Type
16.3.4. By Printing Technology
16.3.5. By End Use
16.4. Key Takeaways
17. Country wise Market Analysis
17.1. United States (U.S.)
17.1.1. Market Share Analysis, 2022
17.1.2. By Material Type
17.1.3. By Label Type
17.1.4. By Printing Technology
17.1.5. By End Use
17.2. Canada
17.2.1. Market Share Analysis, 2022
17.2.2. By Material Type
17.2.3. By Label Type
17.2.4. By Printing Technology
17.2.5. By End Use
17.3. Brazil
17.3.1. Market Share Analysis, 2022
17.3.2. By Material Type
17.3.3. By Label Type
17.3.4. By Printing Technology
17.3.5. By End Use
17.4. Mexico
17.4.1. Market Share Analysis, 2022
17.4.2. By Material Type
17.4.3. By Label Type
17.4.4. By Printing Technology
17.4.5. By End Use
17.5. Germany
17.5.1. Market Share Analysis, 2022
17.5.2. By Material Type
17.5.3. By Label Type
17.5.4. By Printing Technology
17.5.5. By End Use
17.6. Italy
17.6.1. Market Share Analysis, 2022
17.6.2. By Material Type
17.6.3. By Label Type
17.6.4. By Printing Technology
17.6.5. By End Use
17.7. France
17.7.1. Market Share Analysis, 2022
17.7.2. By Material Type
17.7.3. By Label Type
17.7.4. By Printing Technology
17.7.5. By End Use
17.8. Spain
17.8.1. Market Share Analysis, 2022
17.8.2. By Material Type
17.8.3. By Label Type
17.8.4. By Printing Technology
17.8.5. By End Use
17.9. U.K.
17.9.1. Market Share Analysis, 2022
17.9.2. By Material Type
17.9.3. By Label Type
17.9.4. By Printing Technology
17.9.5. By End Use
17.10. Russia
17.10.1. Market Share Analysis, 2022
17.10.2. By Material Type
17.10.3. By Label Type
17.10.4. By Printing Technology
17.10.5. By End Use
17.11. China
17.11.1. Market Share Analysis, 2022
17.11.2. By Material Type
17.11.3. By Label Type
17.11.4. By Printing Technology
17.11.5. By End Use
17.12. Japan
17.12.1. Market Share Analysis, 2022
17.12.2. By Material Type
17.12.3. By Label Type
17.12.4. By Printing Technology
17.12.5. By End Use
17.13. India
17.13.1. Market Share Analysis, 2022
17.13.2. By Material Type
17.13.3. By Label Type
17.13.4. By Printing Technology
17.13.5. By End Use
17.14. GCC Countries
17.14.1. Market Share Analysis, 2022
17.14.2. By Material Type
17.14.3. By Label Type
17.14.4. By Printing Technology
17.14.5. By End Use
17.15. Australia
17.15.1. Market Share Analysis, 2022
17.15.2. By Material Type
17.15.3. By Label Type
17.15.4. By Printing Technology
17.15.5. By End Use
18. Market Structure Analysis
18.1. Competition Dashboard
18.2. Competition Benchmarking
18.3. Market Share Analysis of Top Players
18.3.1. By Region
18.3.2. By Product Portfolio
19. Competition Analysis
19.1. Competition Deep Dive
19.1.1. HERMA GmbH
19.1.1.1. Overview
19.1.1.2. Product Portfolio
19.1.1.3. Profitability by Market Segments (Material Type/Label Type/Printing Technology/End Use/Region)
19.1.1.4. Sales Footprint
19.1.1.5. Strategy Overview
19.1.1.5.1. Marketing Strategy
19.1.1.5.2. Product Strategy
19.1.1.5.3. Channel Strategy
19.1.2. CCL Label
19.1.2.1. Overview
19.1.2.2. Product Portfolio
19.1.2.3. Profitability by Market Segments (Material Type/Label Type/Printing Technology/End Use/Region)
19.1.2.4. Sales Footprint
19.1.2.5. Strategy Overview
19.1.2.5.1. Marketing Strategy
19.1.2.5.2. Product Strategy
19.1.2.5.3. Channel Strategy
19.1.3. Avery Products Pty Ltd.
19.1.3.1. Overview
19.1.3.2. Product Portfolio
19.1.3.3. Profitability by Market Segments (Material Type/Label Type/Printing Technology/End Use/Region)
19.1.3.4. Sales Footprint
19.1.3.5. Strategy Overview
19.1.3.5.1. Marketing Strategy
19.1.3.5.2. Product Strategy
19.1.3.5.3. Channel Strategy
19.1.4. THE Label Makers LIMITED
19.1.4.1. Overview
19.1.4.2. Product Portfolio
19.1.4.3. Profitability by Market Segments (Material Type/Label Type/Printing Technology/End Use/Region)
19.1.4.4. Sales Footprint
19.1.4.5. Strategy Overview
19.1.4.5.1. Marketing Strategy
19.1.4.5.2. Product Strategy
19.1.4.5.3. Channel Strategy
19.1.5. Berkshire Labels
19.1.5.1. Overview
19.1.5.2. Product Portfolio
19.1.5.3. Profitability by Market Segments (Material Type/Label Type/Printing Technology/End Use/Region)
19.1.5.4. Sales Footprint
19.1.5.5. Strategy Overview
19.1.5.5.1. Marketing Strategy
19.1.5.5.2. Product Strategy
19.1.5.5.3. Channel Strategy
19.1.6. Crown Labels Mfg. Co Ltd
19.1.6.1. Overview
19.1.6.2. Product Portfolio
19.1.6.3. Profitability by Market Segments (Material Type/Label Type/Printing Technology/End Use/Region)
19.1.6.4. Sales Footprint
19.1.6.5. Strategy Overview
19.1.6.5.1. Marketing Strategy
19.1.6.5.2. Product Strategy
19.1.6.5.3. Channel Strategy
19.1.7. Weber Packaging Solutions.
19.1.7.1. Overview
19.1.7.2. Product Portfolio
19.1.7.3. Profitability by Market Segments (Material Type/Label Type/Printing Technology/End Use/Region)
19.1.7.4. Sales Footprint
19.1.7.5. Strategy Overview
19.1.7.5.1. Marketing Strategy
19.1.7.5.2. Product Strategy
19.1.7.5.3. Channel Strategy
19.1.8. JK Labels
19.1.8.1. Overview
19.1.8.2. Product Portfolio
19.1.8.3. Profitability by Market Segments (Material Type/Label Type/Printing Technology/End Use/Region)
19.1.8.4. Sales Footprint
19.1.8.5. Strategy Overview
19.1.8.5.1. Marketing Strategy
19.1.8.5.2. Product Strategy
19.1.8.5.3. Channel Strategy
19.1.9. Signal Labels Ltd
19.1.9.1. Overview
19.1.9.2. Product Portfolio
19.1.9.3. Profitability by Market Segments (Material Type/Label Type/Printing Technology/End Use/Region)
19.1.9.4. Sales Footprint
19.1.9.5. Strategy Overview
19.1.9.5.1. Marketing Strategy
19.1.9.5.2. Product Strategy
19.1.9.5.3. Channel Strategy
19.1.10. VR Labels & Stickers
19.1.10.1. Overview
19.1.10.2. Product Portfolio
19.1.10.3. Profitability by Market Segments (Material Type/Label Type/Printing Technology/End Use/Region)
19.1.10.4. Sales Footprint
19.1.10.5. Strategy Overview
19.1.10.5.1. Marketing Strategy
19.1.10.5.2. Product Strategy
19.1.10.5.3. Channel Strategy
19.1.11. Elevate Packaging, Inc.
19.1.11.1. Overview
19.1.11.2. Product Portfolio
19.1.11.3. Profitability by Market Segments (Material Type/Label Type/Printing Technology/End Use/Region)
19.1.11.4. Sales Footprint
19.1.11.5. Strategy Overview
19.1.11.5.1. Marketing Strategy
19.1.11.5.2. Product Strategy
19.1.11.5.3. Channel Strategy
19.1.12. Innovia Films Inc.
19.1.12.1. Overview
19.1.12.2. Product Portfolio
19.1.12.3. Profitability by Market Segments (Material Type/Label Type/Printing Technology/End Use/Region)
19.1.12.4. Sales Footprint
19.1.12.5. Strategy Overview
19.1.12.5.1. Marketing Strategy
19.1.12.5.2. Product Strategy
19.1.12.5.3. Channel Strategy
19.1.13. Checkpoint Systems, Inc.
19.1.13.1. Overview
19.1.13.2. Product Portfolio
19.1.13.3. Profitability by Market Segments (Material Type/Label Type/Printing Technology/End Use/Region)
19.1.13.4. Sales Footprint
19.1.13.5. Strategy Overview
19.1.13.5.1. Marketing Strategy
19.1.13.5.2. Product Strategy
19.1.13.5.3. Channel Strategy
19.1.14. Impression Label
19.1.14.1. Overview
19.1.14.2. Product Portfolio
19.1.14.3. Profitability by Market Segments (Material Type/Label Type/Printing Technology/End Use/Region)
19.1.14.4. Sales Footprint
19.1.14.5. Strategy Overview
19.1.14.5.1. Marketing Strategy
19.1.14.5.2. Product Strategy
19.1.14.5.3. Channel Strategy
19.1.15. WEAVABEL
19.1.15.1. Overview
19.1.15.2. Product Portfolio
19.1.15.3. Profitability by Market Segments (Material Type/Label Type/Printing Technology/End Use/Region)
19.1.15.4. Sales Footprint
19.1.15.5. Strategy Overview
19.1.15.5.1. Marketing Strategy
19.1.15.5.2. Product Strategy
19.1.15.5.3. Channel Strategy
19.1.16. Paramount Labels
19.1.16.1. Overview
19.1.16.2. Product Portfolio
19.1.16.3. Profitability by Market Segments (Material Type/Label Type/Printing Technology/End Use/Region)
19.1.16.4. Sales Footprint
19.1.16.5. Strategy Overview
19.1.16.5.1. Marketing Strategy
19.1.16.5.2. Product Strategy
19.1.16.5.3. Channel Strategy
20. Assumptions and Acronyms Used
21. Research Methodology
Let us know your requirement to get
100% FREE customization
List of Tables
Table 01: Global Market Value (US$ Bn) Forecast by Region, 2015-2032
Table 02: Global Market Volume (Sq. Mt.) Forecast by Region, 2015-2032
Table 03: Global Market Value (US$ Bn) Forecast by Material Type, 2015-2032
Table 04: Global Market Volume (Sq. Mt.) Forecast by Material Type, 2015-2032
Table 05: Global Market Value (US$ Bn) Forecast by Label Type, 2015-2032
Table 06: Global Market Volume (Sq. Mt.) Forecast by Label Type, 2015-2032
Table 07: Global Market Value (US$ Bn) Forecast by Printing Technology, 2015-2032
Table 08: Global Market Volume (Sq. Mt.) Forecast by Printing Technology, 2015-2032
Table 09: Global Market Value (US$ Bn) Forecast by End Use, 2015-2032
Table 10: Global Market Volume (Sq. Mt.) Forecast by End Use, 2015-2032
Table 11: North America Market Value (US$ Bn) Forecast by Country, 2015-2032
Table 12: North America Market Volume (Sq. Mt.) Forecast by Country, 2015-2032
Table 13: North America Market Value (US$ Bn) Forecast by Material Type, 2015-2032
Table 14: North America Market Volume (Sq. Mt.) Forecast by Material Type, 2015-2032
Table 15: North America Market Value (US$ Bn) Forecast by Label Type, 2015-2032
Table 16: North America Market Volume (Sq. Mt.) Forecast by Label Type, 2015-2032
Table 17: North America Market Value (US$ Bn) Forecast by Printing Technology, 2015-2032
Table 18: North America Market Volume (Sq. Mt.) Forecast by Printing Technology, 2015-2032
Table 19: North America Market Value (US$ Bn) Forecast by End Use, 2015-2032
Table 20: North America Market Volume (Sq. Mt.) Forecast by End Use, 2015-2032
Table 21: Latin America Market Value (US$ Bn) Forecast by Country, 2015-2032
Table 22: Latin America Market Volume (Sq. Mt.) Forecast by Country, 2015-2032
Table 23: Latin America Market Value (US$ Bn) Forecast by Material Type, 2015-2032
Table 24: Latin America Market Volume (Sq. Mt.) Forecast by Material Type, 2015-2032
Table 25: Latin America Market Value (US$ Bn) Forecast by Label Type, 2015-2032
Table 26: Latin America Market Volume (Sq. Mt.) Forecast by Label Type, 2015-2032
Table 27: Latin America Market Value (US$ Bn) Forecast by Printing Technology, 2015-2032
Table 28: Latin America Market Volume (Sq. Mt.) Forecast by Printing Technology, 2015-2032
Table 29: Latin America Market Value (US$ Bn) Forecast by End Use, 2015-2032
Table 30: Latin America Market Volume (Sq. Mt.) Forecast by End Use, 2015-2032
Table 31: Europe Market Value (US$ Bn) Forecast by Country, 2015-2032
Table 32: Europe Market Volume (Sq. Mt.) Forecast by Country, 2015-2032
Table 33: Europe Market Value (US$ Bn) Forecast by Material Type, 2015-2032
Table 34: Europe Market Volume (Sq. Mt.) Forecast by Material Type, 2015-2032
Table 35: Europe Market Value (US$ Bn) Forecast by Label Type, 2015-2032
Table 36: Europe Market Volume (Sq. Mt.) Forecast by Label Type, 2015-2032
Table 37: Europe Market Value (US$ Bn) Forecast by Printing Technology, 2015-2032
Table 38: Europe Market Volume (Sq. Mt.) Forecast by Printing Technology, 2015-2032
Table 39: Europe Market Value (US$ Bn) Forecast by End Use, 2015-2032
Table 40: Europe Market Volume (Sq. Mt.) Forecast by End Use, 2015-2032
Table 41: East Asia Market Value (US$ Bn) Forecast by Country, 2015-2032
Table 42: East Asia Market Volume (Sq. Mt.) Forecast by Country, 2015-2032
Table 43: East Asia Market Value (US$ Bn) Forecast by Material Type, 2015-2032
Table 44: East Asia Market Volume (Sq. Mt.) Forecast by Material Type, 2015-2032
Table 45: East Asia Market Value (US$ Bn) Forecast by Label Type, 2015-2032
Table 46: East Asia Market Volume (Sq. Mt.) Forecast by Label Type, 2015-2032
Table 47: East Asia Market Value (US$ Bn) Forecast by Printing Technology, 2015-2032
Table 48: East Asia Market Volume (Sq. Mt.) Forecast by Printing Technology, 2015-2032
Table 49: East Asia Market Value (US$ Bn) Forecast by End Use, 2015-2032
Table 50: East Asia Market Volume (Sq. Mt.) Forecast by End Use, 2015-2032
Table 51: South Asia Market Value (US$ Bn) Forecast by Country, 2015-2032
Table 52: South Asia Market Volume (Sq. Mt.) Forecast by Country, 2015-2032
Table 53: South Asia Market Value (US$ Bn) Forecast by Material Type, 2015-2032
Table 54: South Asia Market Volume (Sq. Mt.) Forecast by Material Type, 2015-2032
Table 55: South Asia Market Value (US$ Bn) Forecast by Label Type, 2015-2032
Table 56: South Asia Market Volume (Sq. Mt.) Forecast by Label Type, 2015-2032
Table 57: South Asia Market Value (US$ Bn) Forecast by Printing Technology, 2015-2032
Table 58: South Asia Market Volume (Sq. Mt.) Forecast by Printing Technology, 2015-2032
Table 59: South Asia Market Value (US$ Bn) Forecast by End Use, 2015-2032
Table 60: South Asia Market Volume (Sq. Mt.) Forecast by End Use, 2015-2032
Table 61: Oceania Market Value (US$ Bn) Forecast by Country, 2015-2032
Table 62: Oceania Market Volume (Sq. Mt.) Forecast by Country, 2015-2032
Table 63: Oceania Market Value (US$ Bn) Forecast by Material Type, 2015-2032
Table 64: Oceania Market Volume (Sq. Mt.) Forecast by Material Type, 2015-2032
Table 65: Oceania Market Value (US$ Bn) Forecast by Label Type, 2015-2032
Table 66: Oceania Market Volume (Sq. Mt.) Forecast by Label Type, 2015-2032
Table 67: Oceania Market Value (US$ Bn) Forecast by Printing Technology, 2015-2032
Table 68: Oceania Market Volume (Sq. Mt.) Forecast by Printing Technology, 2015-2032
Table 69: Oceania Market Value (US$ Bn) Forecast by End Use, 2015-2032
Table 70: Oceania Market Volume (Sq. Mt.) Forecast by End Use, 2015-2032
Table 71: MEA Market Value (US$ Bn) Forecast by Country, 2015-2032
Table 72: MEA Market Volume (Sq. Mt.) Forecast by Country, 2015-2032
Table 73: MEA Market Value (US$ Bn) Forecast by Material Type, 2015-2032
Table 74: MEA Market Volume (Sq. Mt.) Forecast by Material Type, 2015-2032
Table 75: MEA Market Value (US$ Bn) Forecast by Label Type, 2015-2032
Table 76: MEA Market Volume (Sq. Mt.) Forecast by Label Type, 2015-2032
Table 77: MEA Market Value (US$ Bn) Forecast by Printing Technology, 2015-2032
Table 78: MEA Market Volume (Sq. Mt.) Forecast by Printing Technology, 2015-2032
Table 79: MEA Market Value (US$ Bn) Forecast by End Use, 2015-2032
Table 80: MEA Market Volume (Sq. Mt.) Forecast by End Use, 2015-2032
Table 81: U.S. Market Value (US$ Bn) Forecast by Material Type, Label Type, Printing Technology, and End Use (2022(E) & 2032(F))
Table 82: Brazil Market Value (US$ Bn) Forecast by Material Type, Label Type, Printing Technology, and End Use (2022(E) & 2032(F))
Table 83: Mexico Market Value (US$ Bn) Forecast by Material Type, Label Type, Printing Technology, and End Use (2022(E) & 2032(F))
Table 84: Germany Market Value (US$ Bn) Forecast by Material Type, Label Type, Printing Technology, and End Use (2022(E) & 2032(F))
Table 85: Italy Market Value (US$ Bn) Forecast by Material Type, Label Type, Printing Technology, and End Use (2022(E) & 2032(F))
Table 86: France Market Value (US$ Bn) Forecast by Material Type, Label Type, Printing Technology, and End Use (2022(E) & 2032(F))
Table 87: Spain Market Value (US$ Bn) Forecast by Material Type, Label Type, Printing Technology, and End Use (2022(E) & 2032(F))
Table 88: U.K. Market Value (US$ Bn) Forecast by Material Type, Label Type, Printing Technology, and End Use (2022(E) & 2032(F))
Table 89: China Market Value (US$ Bn) Forecast by Material Type, Label Type, Printing Technology, and End Use (2022(E) & 2032(F))
Table 90: Japan Market Value (US$ Bn) Forecast by Material Type, Label Type, Printing Technology, and End Use (2022(E) & 2032(F))
Table 91: India Market Value (US$ Bn) Forecast by Material Type, Label Type, Printing Technology, and End Use (2022(E) & 2032(F))
Table 92: Australia Market Value (US$ Bn) Forecast by Material Type, Label Type, Printing Technology, and End Use (2022(E) & 2032(F))
Find your sweet spots for generating winning opportunities in this market.
Talk to AnalystList of Charts
Figure 01: Global Market Value (US$ Bn) By Material Type, 2022-2032
Figure 02: Global Market Value (US$ Bn) by Label Type, 2022-2032
Figure 03: Global Market Value (US$ Bn) by Printing Technology, 2022-2032
Figure 04: Global Market Value (US$ Bn) by End Use, 2022-2032
Figure 05: Global Market Value (US$ Bn) by Region, 2022-2032
Figure 06: Global Market Value (US$ Bn) Analysis by Region, 2015-2021
Figure 07: Global Market Volume (Sq. Mt.) Analysis by Region, 2015-2032
Figure 08: Global Market Value Share (%) and BPS Analysis by Region, 2022 & 2032
Figure 09: Global Market Y-o-Y Growth (%) Projections by Region, 2022-2032
Figure 10: Global Market Value (US$ Bn) Analysis by Material Type, 2015-2021
Figure 11: Global Market Volume (Sq. Mt.) Analysis by Material Type, 2015-2032
Figure 12: Global Market Value Share (%) and BPS Analysis by Material Type, 2022 & 2032
Figure 13: Global Market Y-o-Y Growth (%) Projections by Material Type, 2022-2032
Figure 14: Global Market Value (US$ Bn) Analysis by Label Type, 2015-2021
Figure 15: Global Market Volume (Sq. Mt.) Analysis by Label Type, 2015-2032
Figure 16: Global Market Value Share (%) and BPS Analysis by Label Type, 2022 & 2032
Figure 17: Global Market Y-o-Y Growth (%) Projections by Label Type, 2022-2032
Figure 18: Global Market Value (US$ Bn) Analysis by Printing Technology, 2015-2021
Figure 19: Global Market Volume (Sq. Mt.) Analysis by Printing Technology, 2015-2032
Figure 20: Global Market Value Share (%) and BPS Analysis by Printing Technology, 2022 & 2032
Figure 21: Global Market Y-o-Y Growth (%) Projections by Printing Technology, 2022-2032
Figure 22: Global Market Value (US$ Bn) Analysis by End Use, 2015-2021
Figure 23: Global Market Volume (Sq. Mt.) Analysis by End Use, 2015-2032
Figure 24: Global Market Value Share (%) and BPS Analysis by End Use, 2022 & 2032
Figure 25: Global Market Y-o-Y Growth (%) Projections by End Use, 2022-2032
Figure 26: Global Market Attractiveness by Material Type, 2022-2032
Figure 27: Global Market Attractiveness by Label Type, 2022-2032
Figure 28: Global Market Attractiveness by Printing Technology, 2022-2032
Figure 29: Global Market Attractiveness by End Use, 2022-2032
Figure 30: Global Market Attractiveness by End Use, 2022-2032
Figure 31: Global Market Attractiveness by Region, 2022-2032
Figure 32: North America Market Value (US$ Bn) By Material Type, 2022-2032
Figure 33: North America Market Value (US$ Bn) by Label Type, 2022-2032
Figure 34: North America Market Value (US$ Bn) by Printing Technology, 2022-2032
Figure 35: North America Market Value (US$ Bn) by End Use, 2022-2032
Figure 36: North America Market Value (US$ Bn) by Country, 2022-2032
Figure 37: North America Market Value (US$ Bn) Analysis by Country, 2015-2021
Figure 38: North America Market Volume (Sq. Mt.) Analysis by Country, 2015-2032
Figure 39: North America Market Value Share (%) and BPS Analysis by Country, 2022 & 2032
Figure 40: North America Market Y-o-Y Growth (%) Projections by Country, 2022-2032
Figure 41: North America Market Value (US$ Bn) Analysis by Material Type, 2015-2021
Figure 42: North America Market Volume (Sq. Mt.) Analysis by Material Type, 2015-2032
Figure 43: North America Market Value Share (%) and BPS Analysis by Material Type, 2022 & 2032
Figure 44: North America Market Y-o-Y Growth (%) Projections by Material Type, 2022-2032
Figure 45: North America Market Value (US$ Bn) Analysis by Label Type, 2015-2021
Figure 46: North America Market Volume (Sq. Mt.) Analysis by Label Type, 2015-2032
Figure 47: North America Market Value Share (%) and BPS Analysis by Label Type, 2022 & 2032
Figure 48: North America Market Y-o-Y Growth (%) Projections by Label Type, 2022-2032
Figure 49: North America Market Value (US$ Bn) Analysis by Printing Technology, 2015-2021
Figure 50: North America Market Volume (Sq. Mt.) Analysis by Printing Technology, 2015-2032
Figure 51: North America Market Value Share (%) and BPS Analysis by Printing Technology, 2022 & 2032
Figure 52: North America Market Y-o-Y Growth (%) Projections by Printing Technology, 2022-2032
Figure 53: North America Market Value (US$ Bn) Analysis by End Use, 2015-2021
Figure 54: North America Market Volume (Sq. Mt.) Analysis by End Use, 2015-2032
Figure 55: North America Market Value Share (%) and BPS Analysis by End Use, 2022 & 2032
Figure 56: North America Market Y-o-Y Growth (%) Projections by End Use, 2022-2032
Figure 57: North America Market Attractiveness by Material Type, 2022-2032
Figure 58: North America Market Attractiveness by Label Type, 2022-2032
Figure 59: North America Market Attractiveness by Printing Technology, 2022-2032
Figure 60: North America Market Attractiveness by End Use, 2022-2032
Figure 61: North America Market Attractiveness by Country, 2022-2032
Figure 62: Latin America Market Value (US$ Bn) By Material Type, 2022 & 2032
Figure 63: Latin America Market Value (US$ Bn) by Label Type, 2022 & 2032
Figure 64: Latin America Market Value (US$ Bn) by Printing Technology, 2022-2032
Figure 65: Latin America Market Value (US$ Bn) by End Use, 2022-2032
Figure 66: Latin America Market Value (US$ Bn) by Country, 2022-2032
Figure 67: Latin America Market Value (US$ Bn) Analysis by Country, 2015-2021
Figure 68: Latin America Market Volume (Sq. Mt.) Analysis by Country, 2015-2032
Figure 69: Latin America Market Value Share (%) and BPS Analysis by Country, 2022 & 2032
Figure 70: Latin America Market Y-o-Y Growth (%) Projections by Country, 2022-2032
Figure 71: Latin America Market Value (US$ Bn) Analysis by Material Type, 2015-2021
Figure 72: Latin America Market Volume (Sq. Mt.) Analysis by Material Type, 2015-2032
Figure 73: Latin America Market Value Share (%) and BPS Analysis by Material Type, 2022 & 2032
Figure 74: Latin America Market Y-o-Y Growth (%) Projections by Material Type, 2022-2032
Figure 75: Latin America Market Value (US$ Bn) Analysis by Label Type, 2015-2021
Figure 76: Latin America Market Volume (Sq. Mt.) Analysis by Label Type, 2015-2032
Figure 77: Latin America Market Value Share (%) and BPS Analysis by Label Type, 2022 & 2032
Figure 78: Latin America Market Y-o-Y Growth (%) Projections by Label Type, 2022-2032
Figure 79: Latin America Market Value (US$ Bn) Analysis by Printing Technology, 2015-2021
Figure 80: Latin America Market Volume (Sq. Mt.) Analysis by Printing Technology, 2015-2032
Figure 81: Latin America Market Value Share (%) and BPS Analysis by Printing Technology, 2022 & 2032
Figure 82: Latin America Market Y-o-Y Growth (%) Projections by Printing Technology, 2022-2032
Figure 83: Latin America Market Value (US$ Bn) Analysis by End Use, 2015-2021
Figure 84: Latin America Market Volume (Sq. Mt.) Analysis by End Use, 2015-2032
Figure 85: Latin America Market Value Share (%) and BPS Analysis by End Use, 2022 & 2032
Figure 86: Latin America Market Y-o-Y Growth (%) Projections by End Use, 2022-2032
Figure 87: Latin America Market Attractiveness by Material Type, 2022-2032
Figure 88: Latin America Market Attractiveness by Label Type, 2022-2032
Figure 89: Latin America Market Attractiveness by Printing Technology, 2022-2032
Figure 90: Latin America Market Attractiveness by End Use, 2022-2032
Figure 91: Latin America Market Attractiveness by Country, 2022-2032
Figure 92: Europe Market Value (US$ Bn) By Material Type, 2022-2032
Figure 93: Europe Market Value (US$ Bn) by Label Type, 2022-2032
Figure 94: Europe Market Value (US$ Bn) by Printing Technology, 2022-2032
Figure 95: Europe Market Value (US$ Bn) by End Use, 2022-2032
Figure 96: Europe Market Value (US$ Bn) by Country, 2022-2032
Figure 97: Europe Market Value (US$ Bn) Analysis by Country, 2015-2021
Figure 98: Europe Market Volume (Sq. Mt.) Analysis by Country, 2015-2032
Figure 99: Europe Market Value Share (%) and BPS Analysis by Country, 2022 & 2032
Figure 100: Europe Market Y-o-Y Growth (%) Projections by Country, 2022-2032
Figure 101: Europe Market Value (US$ Bn) Analysis by Material Type, 2015-2021
Figure 102: Europe Market Volume (Sq. Mt.) Analysis by Material Type, 2015-2032
Figure 103: Europe Market Value Share (%) and BPS Analysis by Material Type, 2022 & 2032
Figure 104: Europe Market Y-o-Y Growth (%) Projections by Material Type, 2022-2032
Figure 105: Europe Market Value (US$ Bn) Analysis by Label Type, 2015-2021
Figure 106: Europe Market Volume (Sq. Mt.) Analysis by Label Type, 2015-2032
Figure 107: Europe Market Value Share (%) and BPS Analysis by Label Type, 2022 & 2032
Figure 108: Europe Market Y-o-Y Growth (%) Projections by Label Type, 2022-2032
Figure 109: Europe Market Value (US$ Bn) Analysis by Printing Technology, 2015-2021
Figure 110: Europe Market Volume (Sq. Mt.) Analysis by Printing Technology, 2015-2032
Figure 111: Europe Market Value Share (%) and BPS Analysis by Printing Technology, 2022 & 2032
Figure 112: Europe Market Y-o-Y Growth (%) Projections by Printing Technology, 2022-2032
Figure 113: Europe Market Value (US$ Bn) Analysis by End Use, 2015-2021
Figure 114: Europe Market Volume (Sq. Mt.) Analysis by End Use, 2015-2032
Figure 115: Europe Market Value Share (%) and BPS Analysis by End Use, 2022 & 2032
Figure 116: Europe Market Y-o-Y Growth (%) Projections by End Use, 2022-2032
Figure 117: Europe Market Attractiveness by Material Type, 2022-2032
Figure 118: Europe Market Attractiveness by Label Type, 2022-2032
Figure 119: Europe Market Attractiveness by Printing Technology, 2022-2032
Figure 120: Europe Market Attractiveness by End Use, 2022-2032
Figure 121: Europe Market Attractiveness by Country, 2022-2032
Figure 122: East Asia Market Value (US$ Bn) By Material Type, 2022-2032
Figure 123: East Asia Market Value (US$ Bn) by Label Type, 2022-2032
Figure 124: East Asia Market Value (US$ Bn) by Printing Technology, 2022-2032
Figure 125: East Asia Market Value (US$ Bn) by End Use, 2022-2032
Figure 126: East Asia Market Value (US$ Bn) by Country, 2022-2032
Figure 127: East Asia Market Value (US$ Bn) Analysis by Country, 2015-2021
Figure 128: East Asia Market Volume (Sq. Mt.) Analysis by Country, 2015-2032
Figure 129: East Asia Market Value Share (%) and BPS Analysis by Country, 2022 & 2032
Figure 130: East Asia Market Y-o-Y Growth (%) Projections by Country, 2022-2032
Figure 131: East Asia Market Value (US$ Bn) Analysis by Material Type, 2015-2021
Figure 132: East Asia Market Volume (Sq. Mt.) Analysis by Material Type, 2015-2032
Figure 133: East Asia Market Value Share (%) and BPS Analysis by Material Type, 2022 & 2032
Figure 134: East Asia Market Y-o-Y Growth (%) Projections by Material Type, 2022-2032
Figure 135: East Asia Market Value (US$ Bn) Analysis by Label Type, 2015-2021
Figure 136: East Asia Market Volume (Sq. Mt.) Analysis by Label Type, 2015-2032
Figure 137: East Asia Market Value Share (%) and BPS Analysis by Label Type, 2022 & 2032
Figure 138: East Asia Market Y-o-Y Growth (%) Projections by Label Type, 2022-2032
Figure 139: East Asia Market Value (US$ Bn) Analysis by Printing Technology, 2015-2021
Figure 140: East Asia Market Volume (Sq. Mt.) Analysis by Printing Technology, 2015-2032
Figure 141: East Asia Market Value Share (%) and BPS Analysis by Printing Technology, 2022 & 2032
Figure 142: East Asia Market Y-o-Y Growth (%) Projections by Printing Technology, 2022-2032
Figure 143: East Asia Market Value (US$ Bn) Analysis by End Use, 2015-2021
Figure 144: East Asia Market Volume (Sq. Mt.) Analysis by End Use, 2015-2032
Figure 145: East Asia Market Value Share (%) and BPS Analysis by End Use, 2022 & 2032
Figure 146: East Asia Market Y-o-Y Growth (%) Projections by End Use, 2022-2032
Figure 147: East Asia Market Attractiveness by Material Type, 2022-2032
Figure 148: East Asia Market Attractiveness by Label Type, 2022-2032
Figure 149: East Asia Market Attractiveness by Printing Technology, 2022-2032
Figure 150: East Asia Market Attractiveness by End Use, 2022-2032
Figure 151: East Asia Market Attractiveness by Country, 2022-2032
Figure 152: South Asia Market Value (US$ Bn) By Material Type, 2022-2032
Figure 153: South Asia Market Value (US$ Bn) by Label Type, 2022-2032
Figure 154: South Asia Market Value (US$ Bn) by Printing Technology, 2022-2032
Figure 155: South Asia Market Value (US$ Bn) by End Use, 2022-2032
Figure 156: South Asia Market Value (US$ Bn) by Country, 2022-2032
Figure 157: South Asia Market Value (US$ Bn) Analysis by Country, 2015-2021
Figure 158: South Asia Market Volume (Sq. Mt.) Analysis by Country, 2015-2032
Figure 159: South Asia Market Value Share (%) and BPS Analysis by Country, 2022 & 2032
Figure 160: South Asia Market Y-o-Y Growth (%) Projections by Country, 2022-2032
Figure 161: South Asia Market Value (US$ Bn) Analysis by Material Type, 2015-2021
Figure 162: South Asia Market Volume (Sq. Mt.) Analysis by Material Type, 2015-2032
Figure 163: South Asia Market Value Share (%) and BPS Analysis by Material Type, 2022 & 2032
Figure 164: South Asia Market Y-o-Y Growth (%) Projections by Material Type, 2022-2032
Figure 165: South Asia Market Value (US$ Bn) Analysis by Label Type, 2015-2021
Figure 166: South Asia Market Volume (Sq. Mt.) Analysis by Label Type, 2015-2032
Figure 167: South Asia Market Value Share (%) and BPS Analysis by Label Type, 2022 & 2032
Figure 168: South Asia Market Y-o-Y Growth (%) Projections by Label Type, 2022-2032
Figure 169: South Asia Market Value (US$ Bn) Analysis by Printing Technology, 2015-2021
Figure 170: South Asia Market Volume (Sq. Mt.) Analysis by Printing Technology, 2015-2032
Figure 171: South Asia Market Value Share (%) and BPS Analysis by Printing Technology, 2022 & 2032
Figure 172: South Asia Market Y-o-Y Growth (%) Projections by Printing Technology, 2022-2032
Figure 173: South Asia Market Value (US$ Bn) Analysis by End Use, 2015-2021
Figure 174: South Asia Market Volume (Sq. Mt.) Analysis by End Use, 2015-2032
Figure 175: South Asia Market Value Share (%) and BPS Analysis by End Use, 2022 & 2032
Figure 176: South Asia Market Y-o-Y Growth (%) Projections by End Use, 2022-2032
Figure 177: South Asia Market Attractiveness by Material Type, 2022-2032
Figure 178: South Asia Market Attractiveness by Sales Chanel, 2022-2032
Figure 179: South Asia Market Attractiveness by Printing Technology, 2022-2032
Figure 180: South Asia Market Attractiveness by End Use, 2022-2032
Figure 181: South Asia Market Attractiveness by Country, 2022-2032
Figure 182: Oceania Market Value (US$ Bn) By Material Type, 2022-2032
Figure 183: Oceania Market Value (US$ Bn) by Label Type, 2022-2032
Figure 184: Oceania Market Value (US$ Bn) by Printing Technology, 2022-2032
Figure 185: Oceania Market Value (US$ Bn) by End Use, 2022-2032
Figure 186: Oceania Market Value (US$ Bn) by Country, 2022-2032
Figure 187: Oceania Market Value (US$ Bn) Analysis by Country, 2015-2021
Figure 188: Oceania Market Volume (Sq. Mt.) Analysis by Country, 2015-2032
Figure 189: Oceania Market Value Share (%) and BPS Analysis by Country, 2022 & 2032
Figure 190: Oceania Market Y-o-Y Growth (%) Projections by Country, 2022-2032
Figure 191: Oceania Market Value (US$ Bn) Analysis by Material Type, 2015-2021
Figure 192: Oceania Market Volume (Sq. Mt.) Analysis by Material Type, 2015-2032
Figure 193: Oceania Market Value Share (%) and BPS Analysis by Material Type, 2022 & 2032
Figure 194: Oceania Market Y-o-Y Growth (%) Projections by Material Type, 2022-2032
Figure 195: Oceania Market Value (US$ Bn) Analysis by Label Type, 2015-2021
Figure 196: Oceania Market Volume (Sq. Mt.) Analysis by Label Type, 2015-2032
Figure 197: Oceania Market Value Share (%) and BPS Analysis by Label Type, 2022 & 2032
Figure 198: Oceania Market Y-o-Y Growth (%) Projections by Label Type, 2022-2032
Figure 199: Oceania Market Value (US$ Bn) Analysis by Printing Technology, 2015-2021
Figure 200: Oceania Market Volume (Sq. Mt.) Analysis by Printing Technology, 2015-2032
Figure 201: Oceania Market Value Share (%) and BPS Analysis by Printing Technology, 2022 & 2032
Figure 202: Oceania Market Y-o-Y Growth (%) Projections by Printing Technology, 2022-2032
Figure 203: Oceania Market Value (US$ Bn) Analysis by End Use, 2015-2021
Figure 204: Oceania Market Volume (Sq. Mt.) Analysis by End Use, 2015-2032
Figure 205: Oceania Market Value Share (%) and BPS Analysis by End Use, 2022 & 2032
Figure 206: Oceania Market Y-o-Y Growth (%) Projections by End Use, 2022-2032
Figure 207: Oceania Market Attractiveness by Material Type, 2022-2032
Figure 208: Oceania Market Attractiveness by Label Type, 2022-2032
Figure 209: Oceania Market Attractiveness by Printing Technology, 2022-2032
Figure 210: Oceania Market Attractiveness by End Use, 2022-2032
Figure 211: Oceania Market Attractiveness by Country, 2022-2032
Figure 212: MEA Market Value (US$ Bn) By Material Type, 2022-2032
Figure 213: MEA Market Value (US$ Bn) by Label Type, 2022-2032
Figure 214: MEA Market Value (US$ Bn) by Printing Technology, 2022-2032
Figure 215: MEA Market Value (US$ Bn) by End Use, 2022-2032
Figure 216: MEA Market Value (US$ Bn) by Country, 2022-2032
Figure 217: MEA Market Value (US$ Bn) Analysis by Country, 2015-2021
Figure 218: MEA Market Volume (Sq. Mt.) Analysis by Country, 2015-2032
Figure 219: MEA Market Value Share (%) and BPS Analysis by Country, 2022 & 2032
Figure 220: MEA Market Y-o-Y Growth (%) Projections by Country, 2022-2032
Figure 221: MEA Market Value (US$ Bn) Analysis by Material Type, 2015-2021
Figure 222: MEA Market Volume (Sq. Mt.) Analysis by Material Type, 2015-2032
Figure 223: MEA Market Value Share (%) and BPS Analysis by Material Type, 2022 & 2032
Figure 224: MEA Market Y-o-Y Growth (%) Projections by Material Type, 2022-2032
Figure 225: MEA Market Value (US$ Bn) Analysis by Label Type, 2015-2021
Figure 226: MEA Market Volume (Sq. Mt.) Analysis by Label Type, 2015-2032
Figure 227: MEA Market Value Share (%) and BPS Analysis by Label Type, 2022 & 2032
Figure 228: MEA Market Y-o-Y Growth (%) Projections by Label Type, 2022-2032
Figure 229: MEA Market Value (US$ Bn) Analysis by Printing Technology, 2015-2021
Figure 230: MEA Market Volume (Sq. Mt.) Analysis by Printing Technology, 2015-2032
Figure 231: MEA Market Value Share (%) and BPS Analysis by Printing Technology, 2022 & 2032
Figure 232: MEA Market Y-o-Y Growth (%) Projections by Printing Technology, 2022-2032
Figure 233: MEA Market Value (US$ Bn) Analysis by End Use, 2015-2021
Figure 234: MEA Market Volume (Sq. Mt.) Analysis by End Use, 2015-2032
Figure 235: MEA Market Value Share (%) and BPS Analysis by End Use, 2022 & 2032
Figure 236: MEA Market Y-o-Y Growth (%) Projections by End Use, 2022-2032
Figure 237: MEA Market Attractiveness by Material Type, 2022-2032
Figure 238: MEA Market Attractiveness by Label Type, 2022-2032
Figure 239: MEA Market Attractiveness by Printing Technology, 2022-2032
Figure 240: MEA Market Attractiveness by End Use, 2022-2032
Figure 241 MEA Market Attractiveness by Country, 2022-2032
Need specific information?
Request CustomizationExplore Packaging Insights
View Reports