Label Printers Market Size and Share Forecast Outlook 2025 to 2035

The label printers market is valued at USD 553.9 million in 2025 and is slated to reach USD 836.4 million by 2035, reflecting a CAGR of 4.2% during the forecast period. Growth is driven by increased demand for efficient labelling solutions across retail, logistics, healthcare, and manufacturing sectors. Automation in warehouses, rising e-commerce shipments, and regulatory requirements for traceable labelling are key factors supporting market expansion globally.

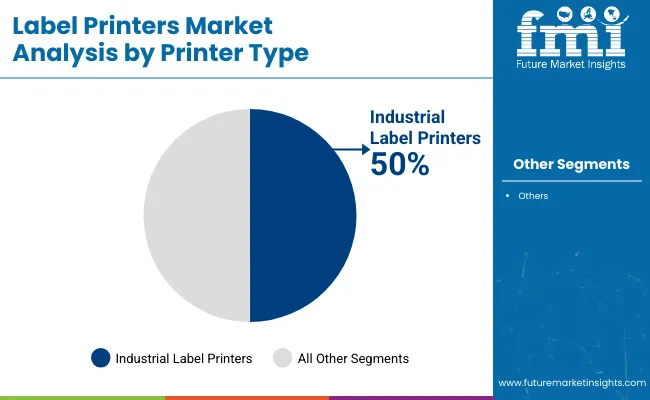
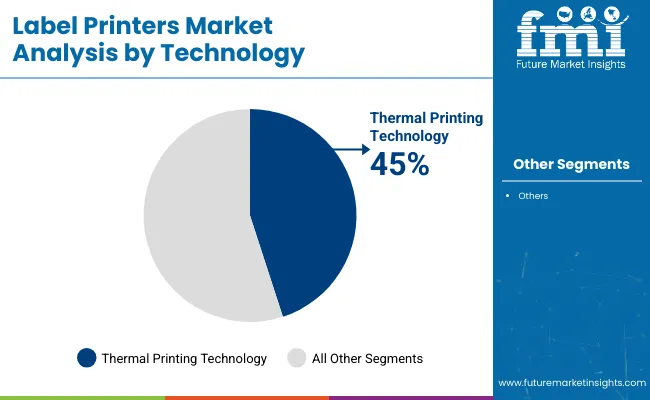
In 2025, industrial label printers are expected to dominate with approximately 50% market share due to their use in mass manufacturing, logistics, and pharmaceutical labelling operations. Thermal printing technology is projected to lead with over 45% market share, driven by its cost-effectiveness and high-resolution capabilities for shipping, barcode, and retail labelling applications. USA is forecast to register the fastest growth with a CAGR of 4.2%, supported by e-commerce expansion and Industry 4.0 integration.
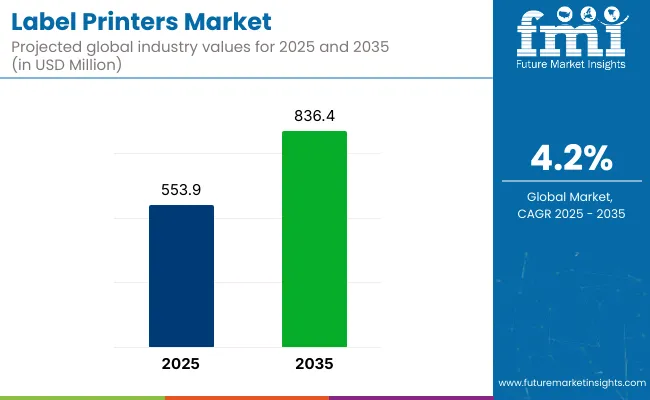
Quick Stats of Label Printers Market

  • Market Value (2025): USD 553.9 million
  • Forecast Value (2035): USD 836.4 million
  • Forecast CAGR: 4.2%
  • Leading Printer Type in 2025: Industrial (approx. 50% market share)
  • Top Technology Segment: Thermal (over 45% market share)
  • Key Growth Region:North America (USA fastest-growing market with 4.2% CAGR)
Metric Value
Estimated Market Size (2025) USD 553.9 Million
Projected Market Size (2035) USD 836.4 Million
CAGR (2025 to 2035) 4.2%

Technological innovations in the label printers market are focusing on AI integration to enhance operational accuracy and efficiency. AI-enabled label printers are being developed for automatic error detection, layout optimization, and seamless integration with enterprise software.

IoT-enabled label printers are gaining traction as companies invest in real-time inventory tracking and connected printing solutions to improve warehouse and supply chain productivity. Furthermore, liner less label technologies are witnessing increasing investment, as they eliminate the need for backing paper, reducing material waste and enhancing sustainability goals.

Label printers hold approximately 30% to 35% share in the barcode and RFID solutions market, driven by widespread use in inventory and asset tracking. In the product identification and tracking market, their share is around 25%, supporting regulatory compliance and traceability. Within the industrial printing market, label printers account for 15% to 18%, primarily for packaging and logistics applications.

They hold a 12% to 15% share in the broader printing equipment market and about 10% in the packaging machinery market. In the office equipment and retail automation markets, label printers contribute 8% to 10%, supporting point-of-sale and back-office functions.

Analyzing Label Printers Market by Top Investment Segments

The market is segmented into printer type, technology, end use, and region. By printer type, the market is divided into industrial, desktop, and mobile/portable. Based on technology, it is categorized into direct, thermal, inkjet, and laser. In terms of end use, the market is segmented into manufacturing, warehousing, retail, transportation & logistics. Regionally, the market is classified into North America, Latin America, Western Europe, Eastern Europe, East Asia, South Asia Pacific, and Middle East and Africa.

Industrial Label Printers to Lead the Printer Type Segment with 50% Market Share

Industrial label printers are projected to lead the printer type segment, accounting for approximately 50% of the global market share by 2025. These printers are widely used for large-scale labelling needs in manufacturing, automotive, logistics, and pharmaceutical industries due to their high-speed, high-volume capabilities. Their integration with ERP and warehouse management systems supports efficient operations and real-time inventory tracking.
  • Used extensively for barcode labelling in automotive and electronics manufacturing
  • Integrated with ERP and WMS systems for real-time labelling and inventory control
  • Preferred for their durability in extreme industrial environments

Thermal Printing Technology to Dominate the Technology Segment with Over 45% Market Share

Thermal printing technology is expected to dominate the technology segment, capturing over 45% market share in 2025. Thermal printers are favored across logistics, retail, and healthcare sectors because of their fast printing speeds, cost-effectiveness, and high-resolution outputs. Direct thermal printers are commonly used for shipping labels, barcodes, and receipts where short-term use is required, while thermal transfer printers are preferred for durable, long-lasting labels in industrial and pharmaceutical settings.
  • Direct thermal printers are used for shipping labels, receipts, and barcodes
  • Thermal transfer printers are used in pharmaceuticals and automotive for durable labelling
  • Companies prefer thermal printing due to low maintenance and high-resolution output

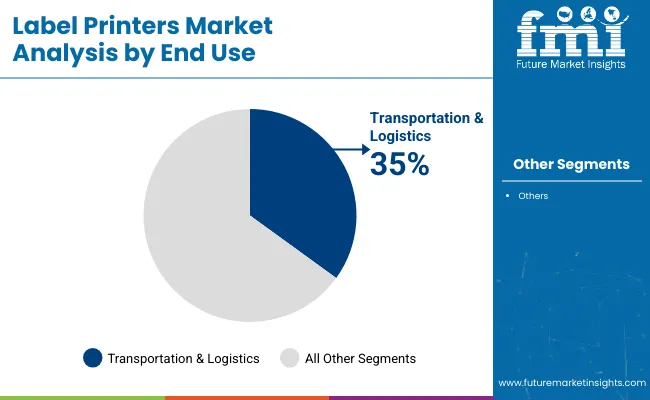
Transportation & Logistics to Lead the End Use Segment with 35% Market Share

The transportation & logistics sector is projected to lead the end use segment, accounting for approximately 35% of the global market share by 2025. Demand is driven by expanding e-commerce, international trade, and the adoption of automated warehousing systems. Label printers in this sector are essential for generating accurate shipping labels, asset tracking tags, and inventory management barcodes to ensure efficient supply chain operations.
  • Used for shipping labels, asset tracking, and inventory management
  • Mobile printers are adopted for on-the-go labelling by logistics providers
  • Cold chain logistics demand temperature-sensitive labels for compliance

Top Label Printers Market Dynamics

The label printers market has been witnessing consistent growth, driven by increasing demand for efficient packaging solutions, product traceability, and regulatory compliance across food & beverage, healthcare, and logistics industries.

Recent Trends in the Label Printers Market

  • The adoption of AI-integrated label printers for automatic error detection and print optimization has been increasing.
  • Research into linerless and compostable label substrates for sustainable printing solutions has expanded.
  • Industrial automation is integrating label printers with IoT and ERP systems for real-time labelling and inventory tracking.

Challenges in the Label Printers Market
  • Fluctuating raw material costs and environmental concerns related to plastic-based labels have posed operational challenges.
  • Regulatory requirements for sustainable labelling materials and production processes have impacted expansion strategies.
  • High initial investment costs for advanced AI-integrated and RFID-enabled label printers have limited adoption among small and medium-sized enterprises.

Analyzing Top Countries Exporting, Distributing, and Supplying Label Printers

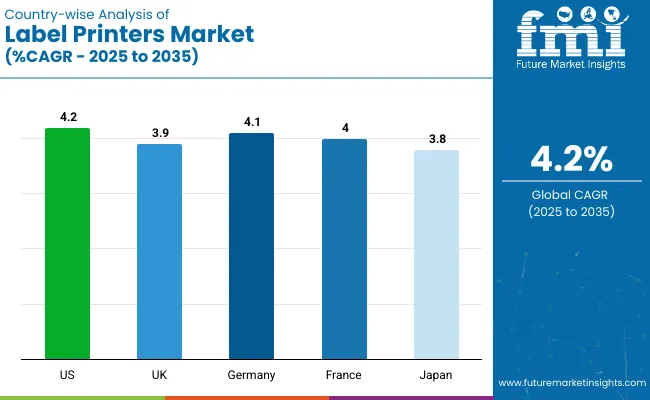
The USA label printers market is set to grow at a CAGR of 4.2% (2025 to 2035), fueled by e-commerce, RFID adoption, and sustainable labeling. The UK follows with a 3.9% CAGR, driven by retail digitalization, REACH compliance, and smart labels. Germany (4.1%) benefits from strong automotive and logistics sectors, with a focus on green printing.

France (4.0%) sees rising demand in food, pharma, and F&B industries, emphasizing environmental compliance. Japan, growing at 3.8%, leverages electronics, automotive, and healthcare sectors, adopting compact, sustainable printing solutions. Across all countries, regulatory compliance and smart labeling technologies are central to market expansion.

The report covers in-depth analysis of 40+ countries; five top-performing OECD countries are highlighted below.

USA Label Printers Market Analysis

The label printers demand in the USA is projected to grow at a CAGR of 4.2% from 2025 to 2035. Growth has been supported by rising e-commerce activities, automated warehouse management, and increased retail labelling applications.

  • Strong logistics and distribution sector demand for RFID-enabled printers.
  • Retail and healthcare sectors expanding adoption for compliance labelling.
  • Investments in smart and sustainable label technologies are increasing.
  • Regulatory standards are emphasizing eco-friendly label materials and processes.

Label Printers Demand Analysis in the UK

The UK label printers market is forecast to expand at a CAGR of 3.9% over the forecast period. Demand has been driven by the retail, pharmaceutical, and logistics sectors with an emphasis on sustainability and digitalization.

  • Retailers are adopting dynamic pricing and electronic shelf labels (ESL).
  • REACH regulations encourage non-toxic inks and recycled label substrates.
  • Pharmaceuticals are adopting digital printing for traceability compliance.
  • Growing demand for RFID and smart labels in logistics and healthcare.

Label Printers Demand Analysis in Germany

Label printers demand in Germany is projected to grow at a CAGR of 4.1% between 2025 and 2035. The nation’s strong automotive, manufacturing, and logistics sectors are driving market growth.

  • Automotive firms use industrial label printers for parts tracking and safety compliance.
  • Retail and logistics sectors adopt thermal and RFID label printing solutions.
  • Strict EU packaging regulations are promoting sustainable printing practices.
  • Companies are investing in green printing and recyclable label substrates.

France Label Printers Market Analysis

France’s label printers market is expected to grow at a CAGR of 4.0% from 2025 to 2035. Growth has been supported by increased adoption in retail, food & beverage, and pharmaceutical sectors for advanced labelling applications.

  • Food sector adopts thermal printers for allergen and compliance labelling.
  • Pharmaceuticals use industrial printers for medical device and drug packaging.
  • Investments in sustainable printing technologies are increasing.
  • Regulatory frameworks are emphasizing environmental compliance and waste reduction.

Label Printers Sales Analysis in Japan

Label printers sales in Japan are forecast to grow at a CAGR of 3.8% through 2035. Growth has been driven by electronics manufacturing, automotive production, and healthcare applications.

  • Electronics sector adopts high-resolution printers for component labelling.
  • Automotive industry uses durable thermal transfer printers for parts tracking.
  • Healthcare sector demands accurate labelling for regulatory compliance.
  • Industry is focusing on sustainable and compact label printing solutions.

Leading Label Printers Suppliers and Distributors

The label printers market is moderately consolidated, with global leaders holding significant shares while regional players innovate in mobile, sustainable, and smart printing solutions. Competitive strategies include technological advancements, product portfolio expansion, and strategic collaborations to strengthen market presence.

Tier-one firms such as Brother Industries, Ltd., Rollo, Pitney Bowes, Epson, Bixolon, Phomemo, Nelko, NIIMBOT, FreeX, and MUNBYN are investing in RFID-enabled printing technologies, linerless and eco-friendly printing solutions, and compact mobile printers to enhance their market positioning. Partnerships with logistics providers, retail chains, and manufacturing companies have been formed to secure long-term demand.

These companies are focusing on integrating IoT and AI capabilities into their printers to improve operational efficiency, error detection, and print accuracy. Additionally, they are expanding their service and distribution networks globally to provide faster technical support and delivery. The strategic focus on sustainability, automation, and real-time data solutions continues to define their competitive edge in the label printers market.

Recent Label Printers Industry News

  • In April 2025, BIXOLON Europe showcased its XM7 series linerless and RFID-enabled mobile printers, XD3-40d and XD5-40tR desktop printers, and the XQ-840II Android tablet-integrated printer at SITL 2025 in Paris, strengthening its transport and logistics solutions portfolio.
  • In January 2025, Pitney Bowes continued to expand sales of its PitneyShip Cube, an all-in-one Wi-Fi-enabled thermal shipping label printer with an integrated scale, enhancing shipping efficiency for low- to mid-volume shippers.

Label Printers Market Report Scope

Report Attributes Details
Current Total Market Size (2025) USD 553.9 million
Projected Market Size (2035) USD 836.4 million
CAGR (2025 to 2035) 4.2%
Base Year for Estimation 2024
Historical Period 2020 to 2024
Projections Period 2025 to 2035
Market Analysis Parameters Revenue in USD million / Volume in units
By Printer Type Industrial, Desktop, Mobile/Portable
By Technology Thermal, Inkjet, Laser, Direct
By End Use Manufacturing, Warehousing, Retail, Transportation & Logistics
Regions Covered North America, Latin America, Western Europe, Eastern Europe, East Asia, South Asia Pacific, Middle East and Africa
Countries Covered United States, United Kingdom, Germany, France, Japan, South Korea, China, Brazil, India, Italy
Key Players Brother Industries, Ltd., Rollo, Pitney Bowes, Epson, Bixolon , Phomemo , Nelko , NIIMBOT, FreeX , MUNBYN
Additional Attributes Market share analysis by printer type and technology, country-wise CAGR analysis, and brand positioning insights

Key Segmentation

By Printer Type:

  • Industrial
  • Desktop
  • Mobile/Portable

By Technology:

  • Thermal
  • Direc
  • Inkjet
  • Laser

By End Use:

  • Manufacturing
  • Warehousing
  • Retail
  • Transportation & Logistics

By Region:

  • North America
  • Latin America
  • Western Europe
  • Eastern Europe
  • East Asia
  • South Asia Pacific
  • Middle East and Africa

Table of Content

  1. Executive Summary
    • Global Market Outlook
    • Demand-side Trends
    • Supply-side Trends
    • Technology Roadmap Analysis
    • Analysis and Recommendations
  2. Market Overview
    • Market Coverage / Taxonomy
    • Market Definition / Scope / Limitations
  3. Market Background
    • Market Dynamics
      • Drivers
      • Restraints
      • Opportunity
      • Trends
    • Scenario Forecast
      • Demand in Optimistic Scenario
      • Demand in Likely Scenario
      • Demand in Conservative Scenario
    • Opportunity Map Analysis
    • Product Life Cycle Analysis
    • Supply Chain Analysis
      • Supply Side Participants and their Roles
        • Producers
        • Mid-Level Participants (Traders/ Agents/ Brokers)
        • Wholesalers and Distributors
      • Value Added and Value Created at Node in the Supply Chain
      • List of Raw Material Suppliers
      • List of Existing and Potential Buyer’s
    • Investment Feasibility Matrix
    • Value Chain Analysis
      • Profit Margin Analysis
      • Wholesalers and Distributors
      • Retailers
    • PESTLE and Porter’s Analysis
    • Regulatory Landscape
      • By Key Regions
      • By Key Countries
    • Regional Parent Market Outlook
    • Production and Consumption Statistics
    • Import and Export Statistics
  4. Global Market Analysis 2020 to 2024 and Forecast, 2025 to 2035
    • Historical Market Size Value (USD Million) & Volume (Units) Analysis, 2020 to 2024
    • Current and Future Market Size Value (USD Million) & Volume (Units) Projections, 2025 to 2035
      • Y-o-Y Growth Trend Analysis
      • Absolute $ Opportunity Analysis
  5. Global Market Pricing Analysis 2020 to 2024 and Forecast 2025 to 2035
  6. Global Market Analysis 2020 to 2024 and Forecast 2025 to 2035, By Printer Type
    • Introduction / Key Findings
    • Historical Market Size Value (USD Million) & Volume (Units) Analysis By Printer Type, 2020 to 2024
    • Current and Future Market Size Value (USD Million) & Volume (Units) Analysis and Forecast By Printer Type, 2025 to 2035
      • Industrial
      • Desktop
      • Mobile/Portable
    • Y-o-Y Growth Trend Analysis By Printer Type, 2020 to 2024
    • Absolute $ Opportunity Analysis By Printer Type, 2025 to 2035
  7. Global Market Analysis 2020 to 2024 and Forecast 2025 to 2035, By Technology
    • Introduction / Key Findings
    • Historical Market Size Value (USD Million) & Volume (Units) Analysis By Technology, 2020 to 2024
    • Current and Future Market Size Value (USD Million) & Volume (Units) Analysis and Forecast By Technology, 2025 to 2035
      • Thermal
      • Direct
      • Inkjet
      • Laser
    • Y-o-Y Growth Trend Analysis By Technology, 2020 to 2024
    • Absolute $ Opportunity Analysis By Technology, 2025 to 2035
  8. Global Market Analysis 2020 to 2024 and Forecast 2025 to 2035, By End Use
    • Introduction / Key Findings
    • Historical Market Size Value (USD Million) & Volume (Units) Analysis By End Use, 2020 to 2024
    • Current and Future Market Size Value (USD Million) & Volume (Units) Analysis and Forecast By End Use, 2025 to 2035
      • Manufacturing
      • Warehousing
      • Retail
      • Transportation & Logistics
    • Y-o-Y Growth Trend Analysis By End Use, 2020 to 2024
    • Absolute $ Opportunity Analysis By End Use, 2025 to 2035
  9. Global Market Analysis 2020 to 2024 and Forecast 2025 to 2035, By Region
    • Introduction
    • Historical Market Size Value (USD Million) & Volume (Units) Analysis By Region, 2020 to 2024
    • Current Market Size Value (USD Million) & Volume (Units) Analysis and Forecast By Region, 2025 to 2035
      • North America
      • Latin America
      • Western Europe
      • Eastern Europe
      • East Asia
      • South Asia & Pacific
      • Middle East and Africa
    • Market Attractiveness Analysis By Region
  10. North America Market Analysis 2020 to 2024 and Forecast 2025 to 2035, By Country
    • Historical Market Size Value (USD Million) & Volume (Units) Trend Analysis By Market Taxonomy, 2020 to 2024
    • Market Size Value (USD Million) & Volume (Units) Forecast By Market Taxonomy, 2025 to 2035
      • By Country
        • U.S.
        • Canada
        • Mexico
      • By Printer Type
      • By Technology
      • By End Use
    • Market Attractiveness Analysis
      • By Country
      • By Printer Type
      • By Technology
      • By End Use
    • Key Takeaways
  11. Latin America Market Analysis 2020 to 2024 and Forecast 2025 to 2035, By Country
    • Historical Market Size Value (USD Million) & Volume (Units) Trend Analysis By Market Taxonomy, 2020 to 2024
    • Market Size Value (USD Million) & Volume (Units) Forecast By Market Taxonomy, 2025 to 2035
      • By Country
        • Brazil
        • Argentina
        • Rest of LATAM
      • By Printer Type
      • By Technology
      • By End Use
    • Market Attractiveness Analysis
      • By Country
      • By Printer Type
      • By Technology
      • By End Use
    • Key Takeaways
  12. Western Europe Market Analysis 2020 to 2024 and Forecast 2025 to 2035, By Country
    • Historical Market Size Value (USD Million) & Volume (Units) Trend Analysis By Market Taxonomy, 2020 to 2024
    • Market Size Value (USD Million) & Volume (Units) Forecast By Market Taxonomy, 2025 to 2035
      • By Country
        • Germany
        • Italy
        • France
        • UK
        • Spain
        • BENELUX
        • Nordic
        • Rest of W.Europe
      • By Printer Type
      • By Technology
      • By End Use
    • Market Attractiveness Analysis
      • By Country
      • By Printer Type
      • By Technology
      • By End Use
    • Key Takeaways
  13. Eastern Europe Market Analysis 2020 to 2024 and Forecast 2025 to 2035, By Country
    • Historical Market Size Value (USD Million) & Volume (Units) Trend Analysis By Market Taxonomy, 2020 to 2024
    • Market Size Value (USD Million) & Volume (Units) Forecast By Market Taxonomy, 2025 to 2035
      • By Country
        • Russia
        • Hungary
        • Poland
        • Balkan & Baltics
        • Rest of E. Europe
      • By Printer Type
      • By Technology
      • By End Use
    • Market Attractiveness Analysis
      • By Country
      • By Printer Type
      • By Technology
      • By End Use
    • Key Takeaways
  14. East Asia Market Analysis 2020 to 2024 and Forecast 2025 to 2035, By Country
    • Historical Market Size Value (USD Million) & Volume (Units) Trend Analysis By Market Taxonomy, 2020 to 2024
    • Market Size Value (USD Million) & Volume (Units) Forecast By Market Taxonomy, 2025 to 2035
      • By Country
        • China
        • Japan
        • South Korea
      • By Printer Type
      • By Technology
      • By End Use
    • Market Attractiveness Analysis
      • By Country
      • By Printer Type
      • By Technology
      • By End Use
    • Key Takeaways
  15. South Asia & Pacific Market Analysis 2020 to 2024 and Forecast 2025 to 2035, By Country
    • Historical Market Size Value (USD Million) & Volume (Units) Trend Analysis By Market Taxonomy, 2020 to 2024
    • Market Size Value (USD Million) & Volume (Units) Forecast By Market Taxonomy, 2025 to 2035
      • By Country
        • India
        • Australia & New Zealand
        • ASEAN
        • Rest of SAP
      • By Printer Type
      • By Technology
      • By End Use
    • Market Attractiveness Analysis
      • By Country
      • By Printer Type
      • By Technology
      • By End Use
    • Key Takeaways
  16. Middle East and Africa Market Analysis 2020 to 2024 and Forecast 2025 to 2035, By Country
    • Historical Market Size Value (USD Million) & Volume (Units) Trend Analysis By Market Taxonomy, 2020 to 2024
    • Market Size Value (USD Million) & Volume (Units) Forecast By Market Taxonomy, 2025 to 2035
      • By Country
        • GCC Countries
        • Northern Africa
        • South Africa
        • Turkiye
        • Rest of MEA
      • By Printer Type
      • By Technology
      • By End Use
    • Market Attractiveness Analysis
      • By Country
      • By Printer Type
      • By Technology
      • By End Use
    • Key Takeaways
  17. Key Countries Market Analysis
    • U.S.
      • Pricing Analysis
      • Market Share Analysis, 2024
        • By Printer Type
        • By Technology
        • By End Use
    • Canada
      • Pricing Analysis
      • Market Share Analysis, 2024
        • By Printer Type
        • By Technology
        • By End Use
    • Brazil
      • Pricing Analysis
      • Market Share Analysis, 2024
        • By Printer Type
        • By Technology
        • By End Use
    • Mexico
      • Pricing Analysis
      • Market Share Analysis, 2024
        • By Printer Type
        • By Technology
        • By End Use
    • Argentina
      • Pricing Analysis
      • Market Share Analysis, 2024
        • By Printer Type
        • By Technology
        • By End Use
  18. Market Structure Analysis
    • Competition Dashboard
    • Competition Benchmarking
    • Market Share Analysis of Top Players
      • By Regional
      • By Printer Type
      • By Technology
      • By End Use
  19. Competition Analysis
    • Competition Deep Dive
      • Brother Industries, Ltd.
        • Overview
        • Product Portfolio
        • Profitability by Market Segments (Product/Age /Sales Channel/Region)
        • Sales Footprint
        • Strategy Overview
          • Marketing Strategy
          • Product Strategy
          • Channel Strategy
      • Rollo
        • Overview
        • Product Portfolio
        • Profitability by Market Segments (Product/Age /Sales Channel/Region)
        • Sales Footprint
        • Strategy Overview
          • Marketing Strategy
          • Product Strategy
          • Channel Strategy
      • Pitney Bowes
        • Overview
        • Product Portfolio
        • Profitability by Market Segments (Product/Age /Sales Channel/Region)
        • Sales Footprint
        • Strategy Overview
          • Marketing Strategy
          • Product Strategy
          • Channel Strategy
      • Epson
        • Overview
        • Product Portfolio
        • Profitability by Market Segments (Product/Age /Sales Channel/Region)
        • Sales Footprint
        • Strategy Overview
          • Marketing Strategy
          • Product Strategy
          • Channel Strategy
      • Bixolon
        • Overview
        • Product Portfolio
        • Profitability by Market Segments (Product/Age /Sales Channel/Region)
        • Sales Footprint
        • Strategy Overview
          • Marketing Strategy
          • Product Strategy
          • Channel Strategy
      • Phomemo
        • Overview
        • Product Portfolio
        • Profitability by Market Segments (Product/Age /Sales Channel/Region)
        • Sales Footprint
        • Strategy Overview
          • Marketing Strategy
          • Product Strategy
          • Channel Strategy
      • Nelko
        • Overview
        • Product Portfolio
        • Profitability by Market Segments (Product/Age /Sales Channel/Region)
        • Sales Footprint
        • Strategy Overview
          • Marketing Strategy
          • Product Strategy
          • Channel Strategy
      • NIIMBOT
        • Overview
        • Product Portfolio
        • Profitability by Market Segments (Product/Age /Sales Channel/Region)
        • Sales Footprint
        • Strategy Overview
          • Marketing Strategy
          • Product Strategy
          • Channel Strategy
      • FreeX
        • Overview
        • Product Portfolio
        • Profitability by Market Segments (Product/Age /Sales Channel/Region)
        • Sales Footprint
        • Strategy Overview
          • Marketing Strategy
          • Product Strategy
          • Channel Strategy
      • MUNBYN
        • Overview
        • Product Portfolio
        • Profitability by Market Segments (Product/Age /Sales Channel/Region)
        • Sales Footprint
        • Strategy Overview
          • Marketing Strategy
          • Product Strategy
          • Channel Strategy
  20. Assumptions & Acronyms Used
  21. Research Methodology

List of Tables

  • Table 1: Global Market Value (USD Million) Forecast by Region, 2020 to 2035
  • Table 2: Global Market Volume (Units) Forecast by Region, 2020 to 2035
  • Table 3: Global Market Value (USD Million) Forecast by Printer Type, 2020 to 2035
  • Table 4: Global Market Volume (Units) Forecast by Printer Type, 2020 to 2035
  • Table 5: Global Market Value (USD Million) Forecast by Technology, 2020 to 2035
  • Table 6: Global Market Volume (Units) Forecast by Technology, 2020 to 2035
  • Table 7: Global Market Value (USD Million) Forecast by End Use, 2020 to 2035
  • Table 8: Global Market Volume (Units) Forecast by End Use, 2020 to 2035
  • Table 9: North America Market Value (USD Million) Forecast by Country, 2020 to 2035
  • Table 10: North America Market Volume (Units) Forecast by Country, 2020 to 2035
  • Table 11: North America Market Value (USD Million) Forecast by Printer Type, 2020 to 2035
  • Table 12: North America Market Volume (Units) Forecast by Printer Type, 2020 to 2035
  • Table 13: North America Market Value (USD Million) Forecast by Technology, 2020 to 2035
  • Table 14: North America Market Volume (Units) Forecast by Technology, 2020 to 2035
  • Table 15: North America Market Value (USD Million) Forecast by End Use, 2020 to 2035
  • Table 16: North America Market Volume (Units) Forecast by End Use, 2020 to 2035
  • Table 17: Latin America Market Value (USD Million) Forecast by Country, 2020 to 2035
  • Table 18: Latin America Market Volume (Units) Forecast by Country, 2020 to 2035
  • Table 19: Latin America Market Value (USD Million) Forecast by Printer Type, 2020 to 2035
  • Table 20: Latin America Market Volume (Units) Forecast by Printer Type, 2020 to 2035
  • Table 21: Latin America Market Value (USD Million) Forecast by Technology, 2020 to 2035
  • Table 22: Latin America Market Volume (Units) Forecast by Technology, 2020 to 2035
  • Table 23: Latin America Market Value (USD Million) Forecast by End Use, 2020 to 2035
  • Table 24: Latin America Market Volume (Units) Forecast by End Use, 2020 to 2035
  • Table 25: Western Europe Market Value (USD Million) Forecast by Country, 2020 to 2035
  • Table 26: Western Europe Market Volume (Units) Forecast by Country, 2020 to 2035
  • Table 27: Western Europe Market Value (USD Million) Forecast by Printer Type, 2020 to 2035
  • Table 28: Western Europe Market Volume (Units) Forecast by Printer Type, 2020 to 2035
  • Table 29: Western Europe Market Value (USD Million) Forecast by Technology, 2020 to 2035
  • Table 30: Western Europe Market Volume (Units) Forecast by Technology, 2020 to 2035
  • Table 31: Western Europe Market Value (USD Million) Forecast by End Use, 2020 to 2035
  • Table 32: Western Europe Market Volume (Units) Forecast by End Use, 2020 to 2035
  • Table 33: Eastern Europe Market Value (USD Million) Forecast by Country, 2020 to 2035
  • Table 34: Eastern Europe Market Volume (Units) Forecast by Country, 2020 to 2035
  • Table 35: Eastern Europe Market Value (USD Million) Forecast by Printer Type, 2020 to 2035
  • Table 36: Eastern Europe Market Volume (Units) Forecast by Printer Type, 2020 to 2035
  • Table 37: Eastern Europe Market Value (USD Million) Forecast by Technology, 2020 to 2035
  • Table 38: Eastern Europe Market Volume (Units) Forecast by Technology, 2020 to 2035
  • Table 39: Eastern Europe Market Value (USD Million) Forecast by End Use, 2020 to 2035
  • Table 40: Eastern Europe Market Volume (Units) Forecast by End Use, 2020 to 2035
  • Table 41: East Asia Market Value (USD Million) Forecast by Country, 2020 to 2035
  • Table 42: East Asia Market Volume (Units) Forecast by Country, 2020 to 2035
  • Table 43: East Asia Market Value (USD Million) Forecast by Printer Type, 2020 to 2035
  • Table 44: East Asia Market Volume (Units) Forecast by Printer Type, 2020 to 2035
  • Table 45: East Asia Market Value (USD Million) Forecast by Technology, 2020 to 2035
  • Table 46: East Asia Market Volume (Units) Forecast by Technology, 2020 to 2035
  • Table 47: East Asia Market Value (USD Million) Forecast by End Use, 2020 to 2035
  • Table 48: East Asia Market Volume (Units) Forecast by End Use, 2020 to 2035
  • Table 49: South Asia & Pacific Market Value (USD Million) Forecast by Country, 2020 to 2035
  • Table 50: South Asia & Pacific Market Volume (Units) Forecast by Country, 2020 to 2035
  • Table 51: South Asia & Pacific Market Value (USD Million) Forecast by Printer Type, 2020 to 2035
  • Table 52: South Asia & Pacific Market Volume (Units) Forecast by Printer Type, 2020 to 2035
  • Table 53: South Asia & Pacific Market Value (USD Million) Forecast by Technology, 2020 to 2035
  • Table 54: South Asia & Pacific Market Volume (Units) Forecast by Technology, 2020 to 2035
  • Table 55: South Asia & Pacific Market Value (USD Million) Forecast by End Use, 2020 to 2035
  • Table 56: South Asia & Pacific Market Volume (Units) Forecast by End Use, 2020 to 2035
  • Table 57: Middle East and Africa Market Value (USD Million) Forecast by Country, 2020 to 2035
  • Table 58: Middle East and Africa Market Volume (Units) Forecast by Country, 2020 to 2035
  • Table 59: Middle East and Africa Market Value (USD Million) Forecast by Printer Type, 2020 to 2035
  • Table 60: Middle East and Africa Market Volume (Units) Forecast by Printer Type, 2020 to 2035
  • Table 61: Middle East and Africa Market Value (USD Million) Forecast by Technology, 2020 to 2035
  • Table 62: Middle East and Africa Market Volume (Units) Forecast by Technology, 2020 to 2035
  • Table 63: Middle East and Africa Market Value (USD Million) Forecast by End Use, 2020 to 2035
  • Table 64: Middle East and Africa Market Volume (Units) Forecast by End Use, 2020 to 2035

List of Figures

  • Figure 1: Global Market Volume (Units) Forecast 2020 to 2035
  • Figure 2: Global Market Pricing Analysis
  • Figure 3: Global Market Value (USD Million) Forecast 2020 to 2035
  • Figure 4: Global Market Value Share and BPS Analysis by Printer Type, 2025 and 2035
  • Figure 5: Global Market Y-o-Y Growth Comparison by Printer Type, 2025 to 2035
  • Figure 6: Global Market Attractiveness Analysis by Printer Type
  • Figure 7: Global Market Value Share and BPS Analysis by Technology, 2025 and 2035
  • Figure 8: Global Market Y-o-Y Growth Comparison by Technology, 2025 to 2035
  • Figure 9: Global Market Attractiveness Analysis by Technology
  • Figure 10: Global Market Value Share and BPS Analysis by End Use, 2025 and 2035
  • Figure 11: Global Market Y-o-Y Growth Comparison by End Use, 2025 to 2035
  • Figure 12: Global Market Attractiveness Analysis by End Use
  • Figure 13: Global Market Value (USD Million) Share and BPS Analysis by Region, 2025 and 2035
  • Figure 14: Global Market Y-o-Y Growth Comparison by Region, 2025 to 2035
  • Figure 15: Global Market Attractiveness Analysis by Region
  • Figure 16: North America Market Incremental $ Opportunity, 2025 to 2035
  • Figure 17: Latin America Market Incremental $ Opportunity, 2025 to 2035
  • Figure 18: Western Europe Market Incremental $ Opportunity, 2025 to 2035
  • Figure 19: Eastern Europe Market Incremental $ Opportunity, 2025 to 2035
  • Figure 20: East Asia Market Incremental $ Opportunity, 2025 to 2035
  • Figure 21: South Asia & Pacific Market Incremental $ Opportunity, 2025 to 2035
  • Figure 22: Middle East and Africa Market Incremental $ Opportunity, 2025 to 2035
  • Figure 23: North America Market Value Share and BPS Analysis by Country, 2025 and 2035
  • Figure 24: North America Market Value Share and BPS Analysis by Printer Type, 2025 and 2035
  • Figure 25: North America Market Y-o-Y Growth Comparison by Printer Type, 2025 to 2035
  • Figure 26: North America Market Attractiveness Analysis by Printer Type
  • Figure 27: North America Market Value Share and BPS Analysis by Technology, 2025 and 2035
  • Figure 28: North America Market Y-o-Y Growth Comparison by Technology, 2025 to 2035
  • Figure 29: North America Market Attractiveness Analysis by Technology
  • Figure 30: North America Market Value Share and BPS Analysis by End Use, 2025 and 2035
  • Figure 31: North America Market Y-o-Y Growth Comparison by End Use, 2025 to 2035
  • Figure 32: North America Market Attractiveness Analysis by End Use
  • Figure 33: Latin America Market Value Share and BPS Analysis by Country, 2025 and 2035
  • Figure 34: Latin America Market Value Share and BPS Analysis by Printer Type, 2025 and 2035
  • Figure 35: Latin America Market Y-o-Y Growth Comparison by Printer Type, 2025 to 2035
  • Figure 36: Latin America Market Attractiveness Analysis by Printer Type
  • Figure 37: Latin America Market Value Share and BPS Analysis by Technology, 2025 and 2035
  • Figure 38: Latin America Market Y-o-Y Growth Comparison by Technology, 2025 to 2035
  • Figure 39: Latin America Market Attractiveness Analysis by Technology
  • Figure 40: Latin America Market Value Share and BPS Analysis by End Use, 2025 and 2035
  • Figure 41: Latin America Market Y-o-Y Growth Comparison by End Use, 2025 to 2035
  • Figure 42: Latin America Market Attractiveness Analysis by End Use
  • Figure 43: Western Europe Market Value Share and BPS Analysis by Country, 2025 and 2035
  • Figure 44: Western Europe Market Value Share and BPS Analysis by Printer Type, 2025 and 2035
  • Figure 45: Western Europe Market Y-o-Y Growth Comparison by Printer Type, 2025 to 2035
  • Figure 46: Western Europe Market Attractiveness Analysis by Printer Type
  • Figure 47: Western Europe Market Value Share and BPS Analysis by Technology, 2025 and 2035
  • Figure 48: Western Europe Market Y-o-Y Growth Comparison by Technology, 2025 to 2035
  • Figure 49: Western Europe Market Attractiveness Analysis by Technology
  • Figure 50: Western Europe Market Value Share and BPS Analysis by End Use, 2025 and 2035
  • Figure 51: Western Europe Market Y-o-Y Growth Comparison by End Use, 2025 to 2035
  • Figure 52: Western Europe Market Attractiveness Analysis by End Use
  • Figure 53: Eastern Europe Market Value Share and BPS Analysis by Country, 2025 and 2035
  • Figure 54: Eastern Europe Market Value Share and BPS Analysis by Printer Type, 2025 and 2035
  • Figure 55: Eastern Europe Market Y-o-Y Growth Comparison by Printer Type, 2025 to 2035
  • Figure 56: Eastern Europe Market Attractiveness Analysis by Printer Type
  • Figure 57: Eastern Europe Market Value Share and BPS Analysis by Technology, 2025 and 2035
  • Figure 58: Eastern Europe Market Y-o-Y Growth Comparison by Technology, 2025 to 2035
  • Figure 59: Eastern Europe Market Attractiveness Analysis by Technology
  • Figure 60: Eastern Europe Market Value Share and BPS Analysis by End Use, 2025 and 2035
  • Figure 61: Eastern Europe Market Y-o-Y Growth Comparison by End Use, 2025 to 2035
  • Figure 62: Eastern Europe Market Attractiveness Analysis by End Use
  • Figure 63: East Asia Market Value Share and BPS Analysis by Country, 2025 and 2035
  • Figure 64: East Asia Market Value Share and BPS Analysis by Printer Type, 2025 and 2035
  • Figure 65: East Asia Market Y-o-Y Growth Comparison by Printer Type, 2025 to 2035
  • Figure 66: East Asia Market Attractiveness Analysis by Printer Type
  • Figure 67: East Asia Market Value Share and BPS Analysis by Technology, 2025 and 2035
  • Figure 68: East Asia Market Y-o-Y Growth Comparison by Technology, 2025 to 2035
  • Figure 69: East Asia Market Attractiveness Analysis by Technology
  • Figure 70: East Asia Market Value Share and BPS Analysis by End Use, 2025 and 2035
  • Figure 71: East Asia Market Y-o-Y Growth Comparison by End Use, 2025 to 2035
  • Figure 72: East Asia Market Attractiveness Analysis by End Use
  • Figure 73: South Asia & Pacific Market Value Share and BPS Analysis by Country, 2025 and 2035
  • Figure 74: South Asia & Pacific Market Value Share and BPS Analysis by Printer Type, 2025 and 2035
  • Figure 75: South Asia & Pacific Market Y-o-Y Growth Comparison by Printer Type, 2025 to 2035
  • Figure 76: South Asia & Pacific Market Attractiveness Analysis by Printer Type
  • Figure 77: South Asia & Pacific Market Value Share and BPS Analysis by Technology, 2025 and 2035
  • Figure 78: South Asia & Pacific Market Y-o-Y Growth Comparison by Technology, 2025 to 2035
  • Figure 79: South Asia & Pacific Market Attractiveness Analysis by Technology
  • Figure 80: South Asia & Pacific Market Value Share and BPS Analysis by End Use, 2025 and 2035
  • Figure 81: South Asia & Pacific Market Y-o-Y Growth Comparison by End Use, 2025 to 2035
  • Figure 82: South Asia & Pacific Market Attractiveness Analysis by End Use
  • Figure 83: Middle East and Africa Market Value Share and BPS Analysis by Country, 2025 and 2035
  • Figure 84: Middle East and Africa Market Value Share and BPS Analysis by Printer Type, 2025 and 2035
  • Figure 85: Middle East and Africa Market Y-o-Y Growth Comparison by Printer Type, 2025 to 2035
  • Figure 86: Middle East and Africa Market Attractiveness Analysis by Printer Type
  • Figure 87: Middle East and Africa Market Value Share and BPS Analysis by Technology, 2025 and 2035
  • Figure 88: Middle East and Africa Market Y-o-Y Growth Comparison by Technology, 2025 to 2035
  • Figure 89: Middle East and Africa Market Attractiveness Analysis by Technology
  • Figure 90: Middle East and Africa Market Value Share and BPS Analysis by End Use, 2025 and 2035
  • Figure 91: Middle East and Africa Market Y-o-Y Growth Comparison by End Use, 2025 to 2035
  • Figure 92: Middle East and Africa Market Attractiveness Analysis by End Use
  • Figure 93: Global Market - Tier Structure Analysis
  • Figure 94: Global Market - Company Share Analysis

Frequently Asked Questions

What is the projected size of the label printers market by 2035?

The market is expected to reach USD 836.4 million by 2035.

What is the CAGR of the label printers market from 2025 to 2035?

The global market is projected to grow at a CAGR of 4.2% during this period.

Which printer type holds the highest share in the label printers market in 2025?

Industrial label printers are expected to lead with approximately 50% market share in 2025.

What is the projected share of thermal printing technology in the label printers market by 2025?

Thermal printing technology is expected to hold over 45% of the market share in 2025.

Which country is projected to grow fastest in the label printers market?

The USA is anticipated to grow fastest with a 4.2% CAGR through 2035.

Explore Similar Insights

Future Market Insights

Label Printers Market